| Param | Original file | Final file |
|---|---|---|
| Filename | modeM0/AS1A05_046T01_9000002838_19144cztM0_level2.evt | modeM0/AS1A05_046T01_9000002838_19144cztM0_level2_quad_clean.evt |
| Size (bytes) | 1,669,322,880 | 256,973,760 |
| Size | 1.6 GB | 245.1 MB |
| Events in quadrant A | 10,648,830 | 1,562,297 |
| Events in quadrant B | 12,315,987 | 1,596,402 |
| Events in quadrant C | 11,278,351 | 1,549,199 |
| Events in quadrant D | 14,771,216 | 1,504,789 |
| Mode M0 | |||
|---|---|---|---|
| Quadrant | BADHDUFLAG | Total packets | Discarded packets |
| A | 0 | 46668 | 4 |
| B | 0 | 51209 | 4 |
| C | 0 | 47778 | 4 |
| D | 0 | 59316 | 4 |
| Mode SS | |||
|---|---|---|---|
| Quadrant | BADHDUFLAG | Total packets | Discarded packets |
| A | 0 | 462 | 0 |
| B | 0 | 462 | 0 |
| C | 0 | 462 | 0 |
| D | 0 | 462 | 0 |
| Mode M9 | |||
|---|---|---|---|
| Quadrant | BADHDUFLAG | Total packets | Discarded packets |
| A | 0 | 12 | 0 |
| B | 0 | 12 | 0 |
| C | 0 | 12 | 0 |
| D | 0 | 12 | 0 |
| Quadrant | Total seconds | Saturated seconds | Saturation percentage |
|---|---|---|---|
| A | 22802 | 370 | 1.622665% |
| B | 22803 | 596 | 2.613691% |
| C | 22803 | 511 | 2.240933% |
| D | 22804 | 1612 | 7.068935% |
Noise dominated data is calculated using 1-second bins in cleaned event files. If a bin has >2000 counts, and if more than 50% of those come from <1% of pixels, then it is considered to be noise-dominated and hence unusable.
| Quadrant | # 1 sec bins | Bins with >0 counts | Bins with >2000 counts | High rate bins dominated by noise | Noise dominated (total time) | Noise dominated (detector-on time) | Marked lightcurve |
|---|---|---|---|---|---|---|---|
| A | 37988 | 22804 | 0 | 0 | 0.00% | 0.00% | 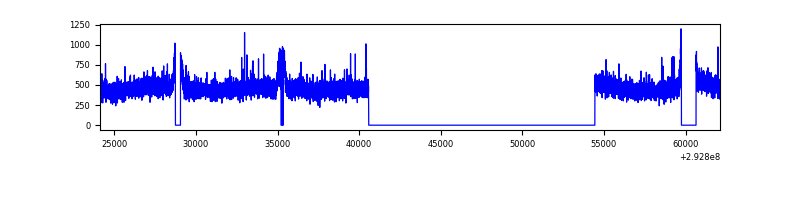 |
| B | 37988 | 22806 | 105 | 105 | 0.28% | 0.46% | 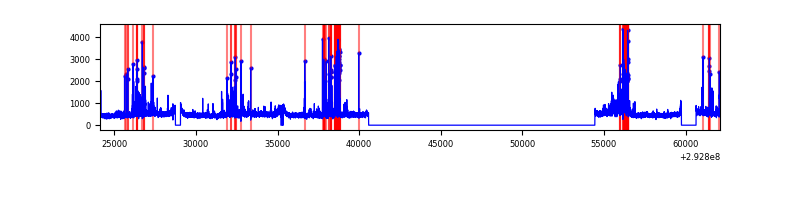 |
| C | 37988 | 22807 | 29 | 29 | 0.08% | 0.13% | 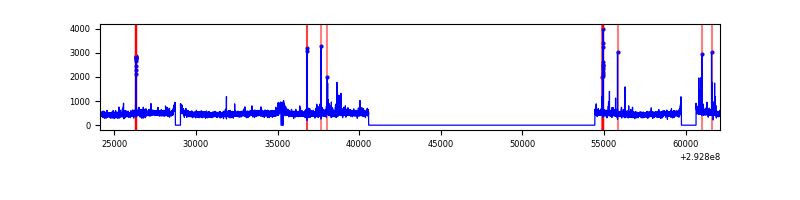 |
| D | 37989 | 22808 | 1223 | 1223 | 3.22% | 5.36% | 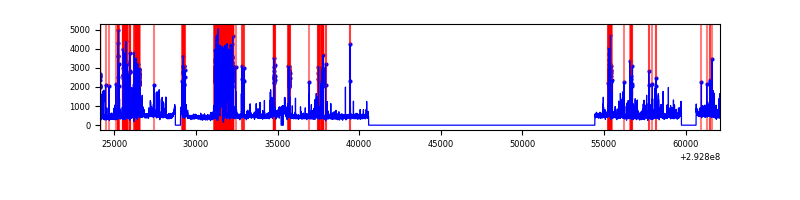 |
Top three noisy pixels from each quadrant. If the there are fewer than three noisy pixels in the level2.evt file, extra rows are filled as -1
| Pixel properties | Quadrant properties | ||||||
|---|---|---|---|---|---|---|---|
| Quadrant | DetID | PixID | Counts | Sigma | Mean | Median | Sigma |
| A | 0 | 226 | 23962 | 38.31 | 2758 | 2695 | 555.1 |
| A | 13 | 254 | 23622 | 37.7 | 2758 | 2695 | 555.1 |
| A | 3 | 137 | 21928 | 34.65 | 2758 | 2695 | 555.1 |
| B | 6 | 36 | 517070 | 982.36 | 2749 | 2676 | 523.6 |
| B | 7 | 220 | 434323 | 824.33 | 2749 | 2676 | 523.6 |
| B | 3 | 64 | 299352 | 566.57 | 2749 | 2676 | 523.6 |
| C | 14 | 238 | 412275 | 652.61 | 2668 | 2680 | 627.6 |
| C | 3 | 233 | 314431 | 496.72 | 2668 | 2680 | 627.6 |
| C | 0 | 207 | 144885 | 226.58 | 2668 | 2680 | 627.6 |
| D | 1 | 52 | 4393304 | 6893.27 | 2630 | 2555 | 637.0 |
| D | 11 | 176 | 164067 | 253.57 | 2630 | 2555 | 637.0 |
| D | 1 | 20 | 137670 | 212.12 | 2630 | 2555 | 637.0 |
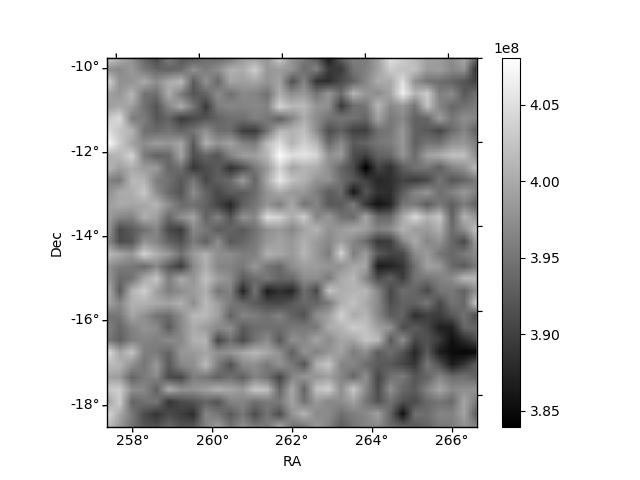
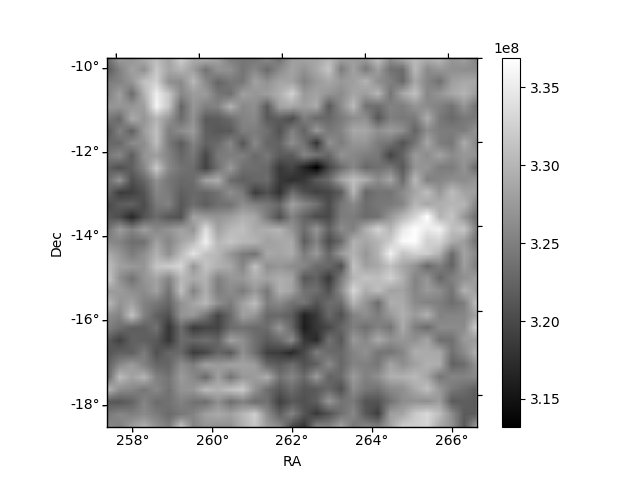
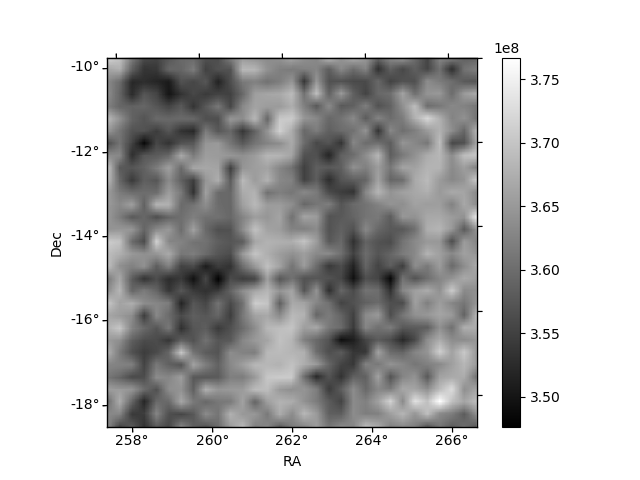
Histogram calculated using DETX and DETY for each event in the final _common_clean file
| Quadrant A | 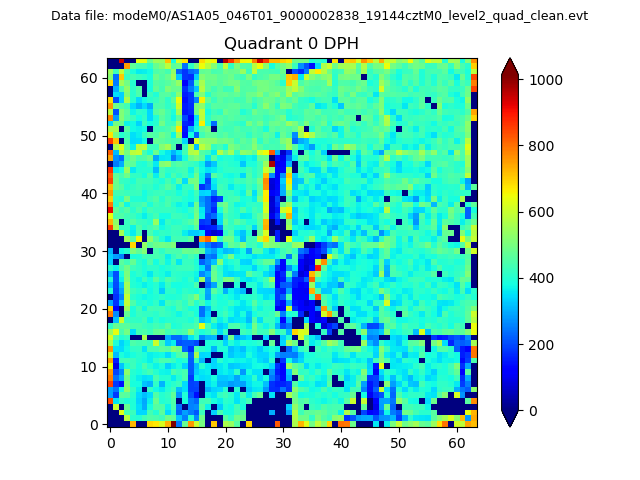 |
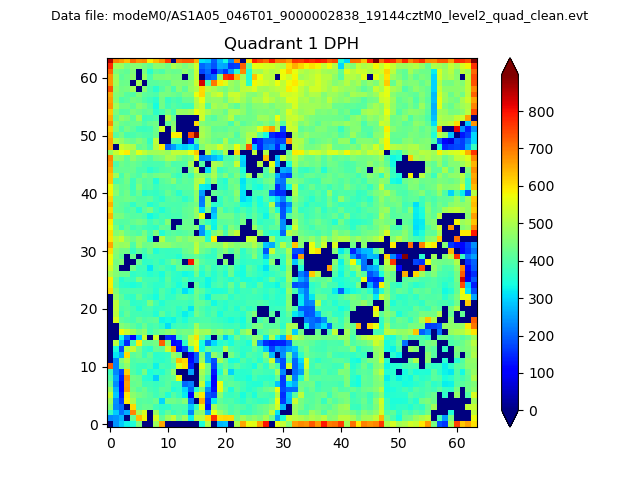 |
Quadrant B |
|---|---|---|---|
| Quadrant D | 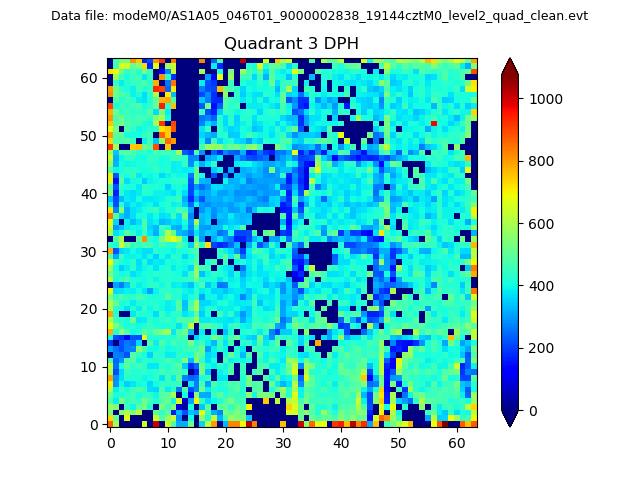 |
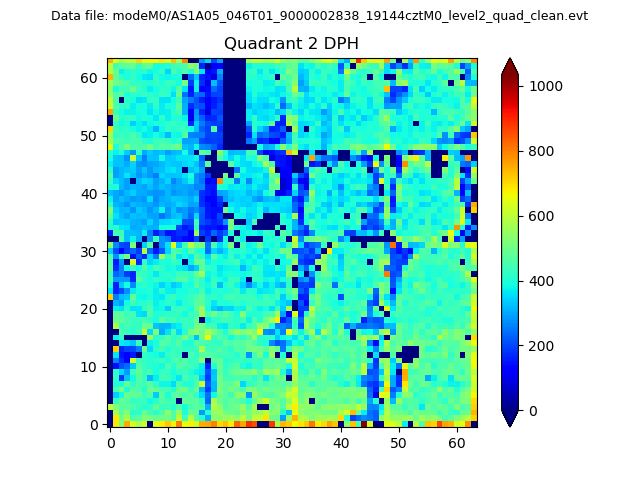 |
Quadrant C |
| Plot type | Count rate plots | Images |
|---|---|---|
| Comparison with Poisson distribution Blue bars denote a histogram of data divided into 1 sec bins. Red curve is a Poisson curve with rate = median count rate of data. |
 |
 |
| Quadrant-wise count rates Data is divided into 100 sec bins |
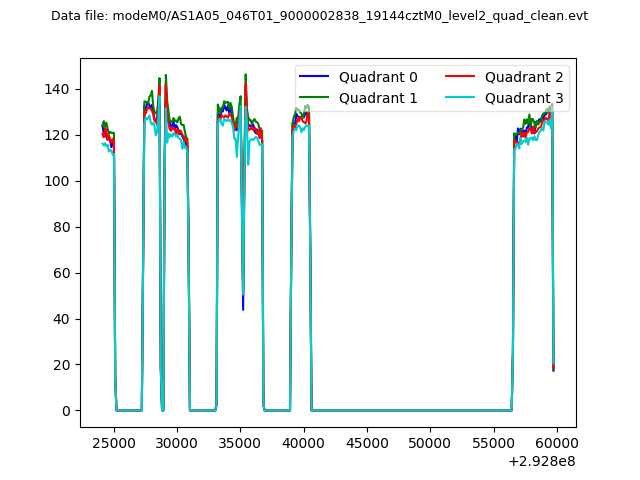 |
|
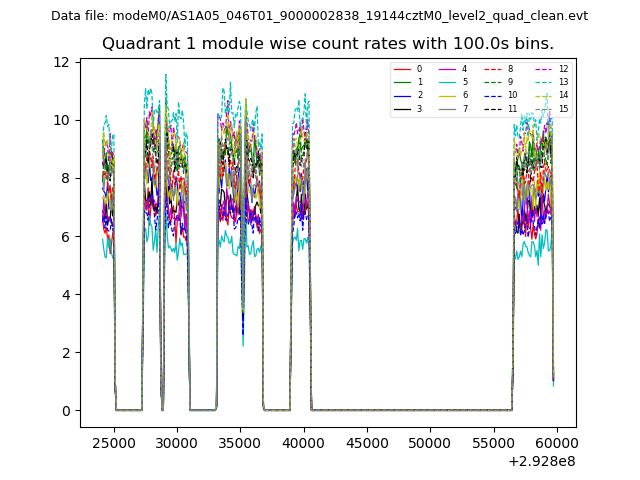
| Module-wise count rates for Quadrant A Data is divided into 100 sec bins |
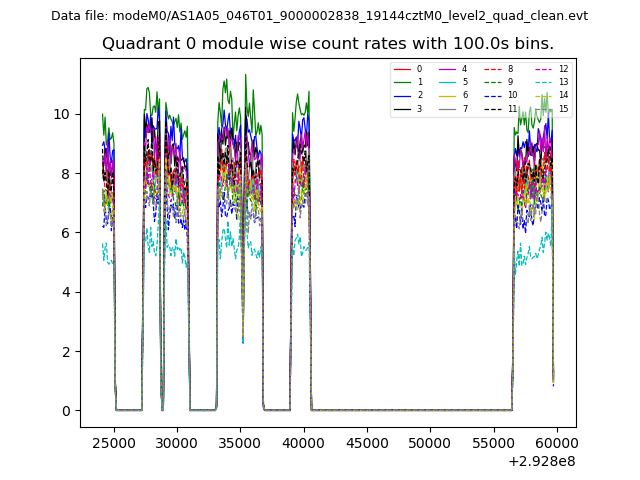 |
 |
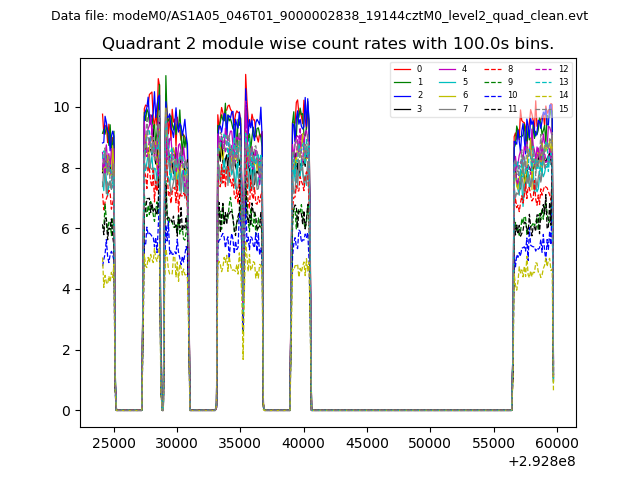
| Module-wise count rates for Quadrant B Data is divided into 100 sec bins |
 |
 |
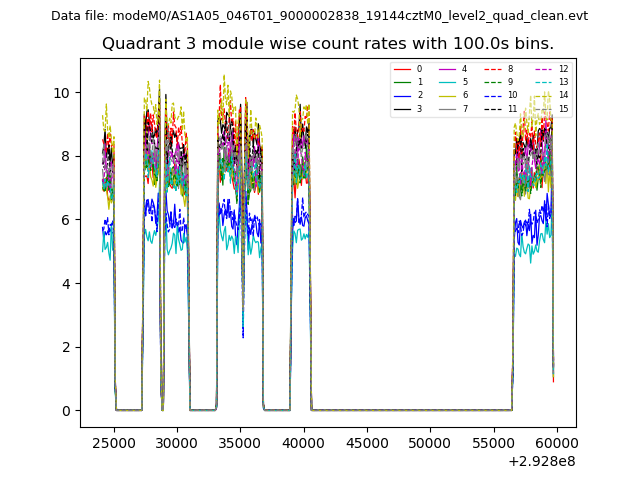
| Module-wise count rates for Quadrant C Data is divided into 100 sec bins |
 |
 |
| Module-wise count rates for Quadrant D Data is divided into 100 sec bins |
 |
 |
| Parameter | Plot |
|---|---|
| CZT HV Monitor | 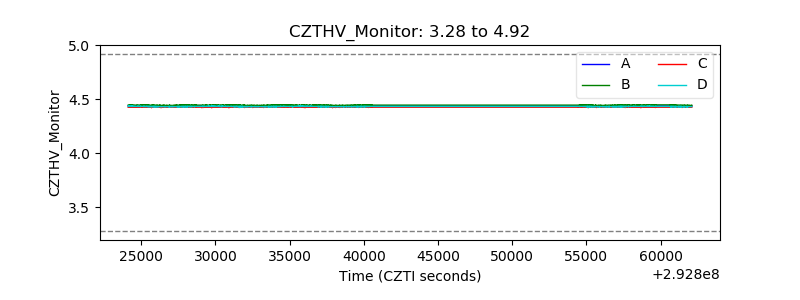 |
| D_VDD | 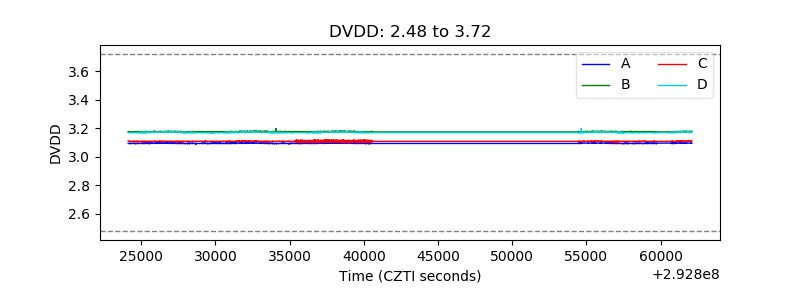 |
| Temperature 1 | 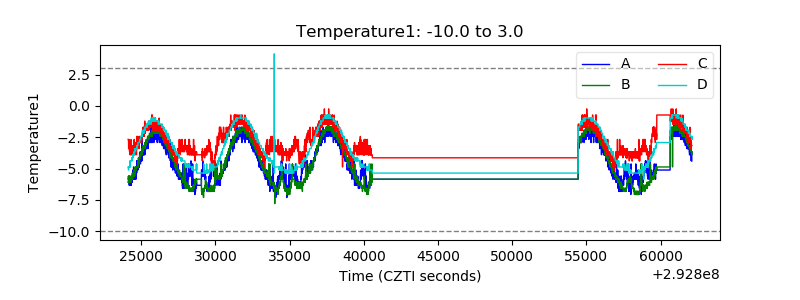 |
| Veto HV Monitor | 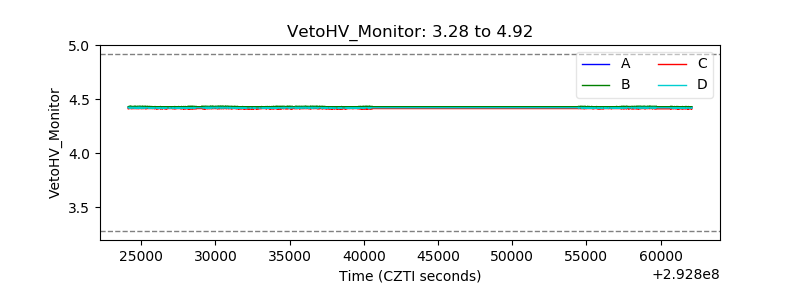 |
| Veto LLD | 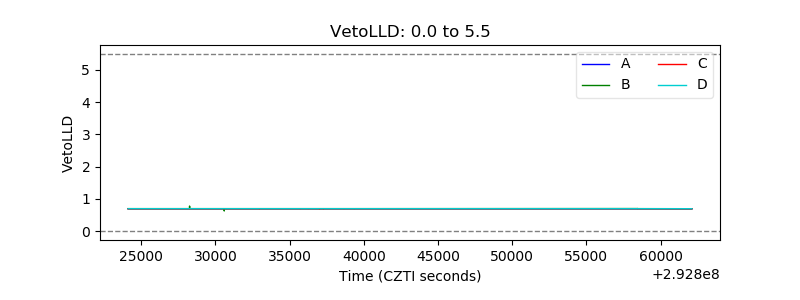 |
| Alpha Counter | 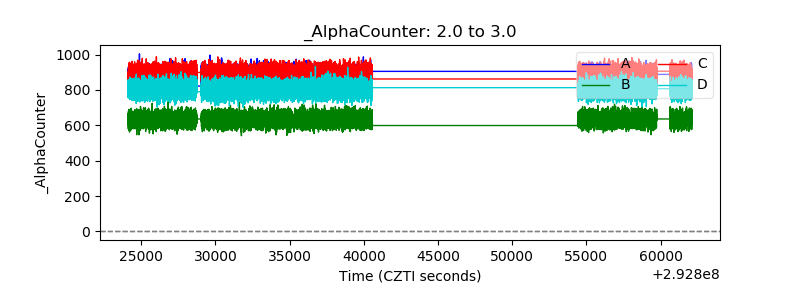 |
| _CPM_Rate | 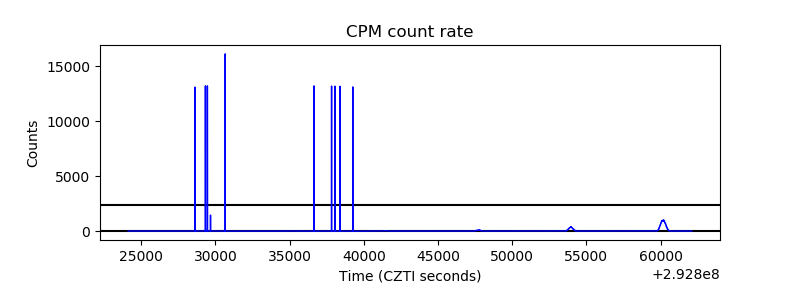 |
| CZT Counter |  |
| +2.5 Volts monitor |  |
| +5 Volts monitor | 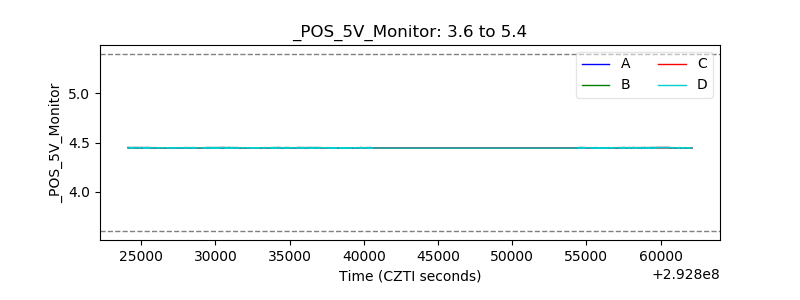 |
| _ROLL_ROT | 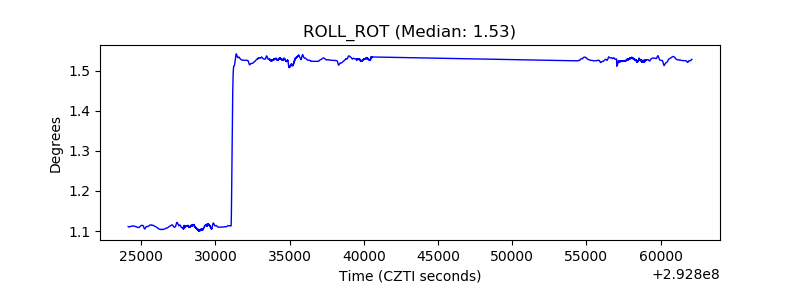 |
| _Roll_DEC | 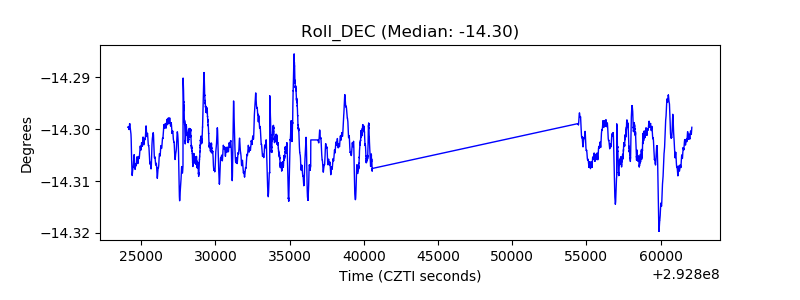 |
| _Roll_RA | 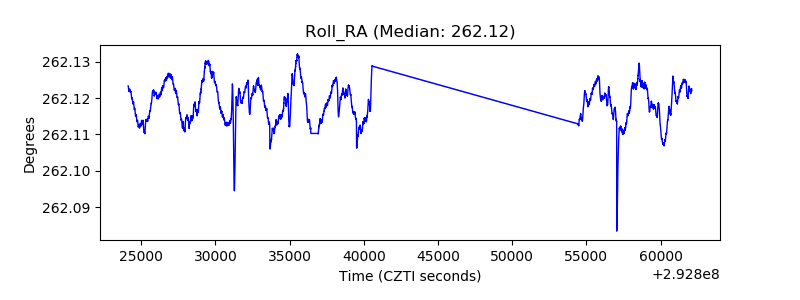 |
| Veto Counter | 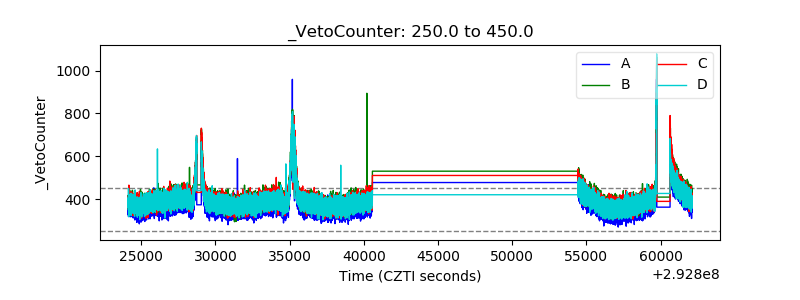 |