| Param | Original file | Final file |
|---|---|---|
| Filename | modeM0/AS1A05_046T01_9000002838_19145cztM0_level2.evt | modeM0/AS1A05_046T01_9000002838_19145cztM0_level2_quad_clean.evt |
| Size (bytes) | 2,555,539,200 | 407,914,560 |
| Size | 2.4 GB | 389.0 MB |
| Events in quadrant A | 16,163,392 | 2,510,081 |
| Events in quadrant B | 20,253,135 | 2,565,279 |
| Events in quadrant C | 17,736,819 | 2,488,523 |
| Events in quadrant D | 20,912,322 | 2,420,085 |
| Mode M0 | |||
|---|---|---|---|
| Quadrant | BADHDUFLAG | Total packets | Discarded packets |
| A | 0 | 70971 | 7 |
| B | 0 | 82487 | 7 |
| C | 0 | 74642 | 7 |
| D | 0 | 85451 | 7 |
| Mode SS | |||
|---|---|---|---|
| Quadrant | BADHDUFLAG | Total packets | Discarded packets |
| A | 0 | 702 | 0 |
| B | 0 | 702 | 0 |
| C | 0 | 702 | 0 |
| D | 0 | 702 | 0 |
| Mode M9 | |||
|---|---|---|---|
| Quadrant | BADHDUFLAG | Total packets | Discarded packets |
| A | 0 | 35 | 0 |
| B | 0 | 35 | 0 |
| C | 0 | 35 | 0 |
| D | 0 | 35 | 0 |
| Quadrant | Total seconds | Saturated seconds | Saturation percentage |
|---|---|---|---|
| A | 34495 | 641 | 1.858240% |
| B | 34495 | 1525 | 4.420931% |
| C | 34495 | 797 | 2.310480% |
| D | 34495 | 2131 | 6.177707% |
Noise dominated data is calculated using 1-second bins in cleaned event files. If a bin has >2000 counts, and if more than 50% of those come from <1% of pixels, then it is considered to be noise-dominated and hence unusable.
| Quadrant | # 1 sec bins | Bins with >0 counts | Bins with >2000 counts | High rate bins dominated by noise | Noise dominated (total time) | Noise dominated (detector-on time) | Marked lightcurve |
|---|---|---|---|---|---|---|---|
| A | 38125 | 34495 | 0 | 0 | 0.00% | 0.00% | 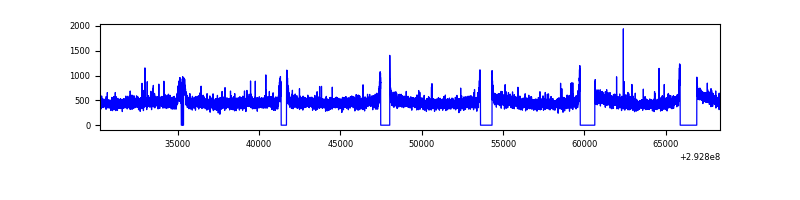 |
| B | 38125 | 34498 | 493 | 493 | 1.29% | 1.43% | 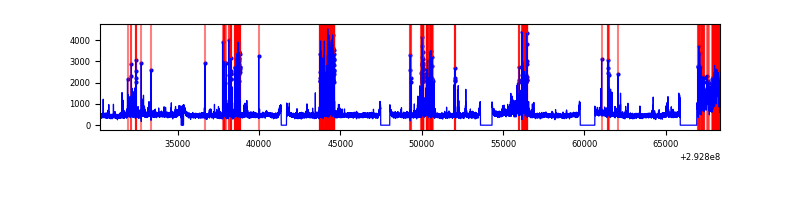 |
| C | 38125 | 34500 | 24 | 24 | 0.06% | 0.07% | 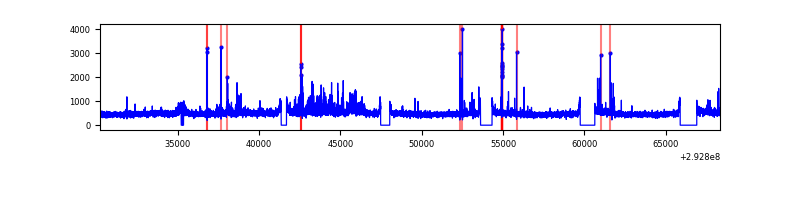 |
| D | 38125 | 34499 | 1429 | 1429 | 3.75% | 4.14% | 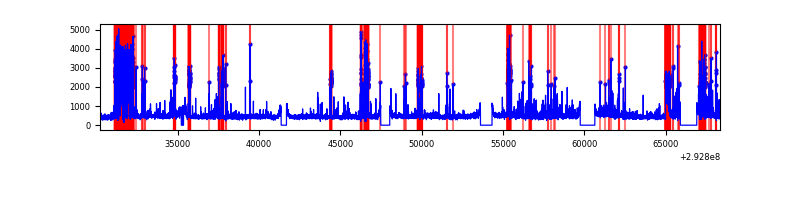 |
Top three noisy pixels from each quadrant. If the there are fewer than three noisy pixels in the level2.evt file, extra rows are filled as -1
| Pixel properties | Quadrant properties | ||||||
|---|---|---|---|---|---|---|---|
| Quadrant | DetID | PixID | Counts | Sigma | Mean | Median | Sigma |
| A | 13 | 254 | 37200 | 39.13 | 4187 | 4088 | 846.2 |
| A | 0 | 226 | 36430 | 38.22 | 4187 | 4088 | 846.2 |
| A | 3 | 137 | 33176 | 34.38 | 4187 | 4088 | 846.2 |
| B | 6 | 36 | 1481311 | 1864.45 | 4155 | 4045 | 792.3 |
| B | 3 | 64 | 1432089 | 1802.33 | 4155 | 4045 | 792.3 |
| B | 7 | 220 | 737771 | 926.03 | 4155 | 4045 | 792.3 |
| C | 3 | 233 | 1193334 | 1248.52 | 4050 | 4071 | 952.5 |
| C | 14 | 238 | 622369 | 649.11 | 4050 | 4071 | 952.5 |
| C | 0 | 207 | 128719 | 130.86 | 4050 | 4071 | 952.5 |
| D | 1 | 52 | 5542950 | 5674.39 | 4019 | 3897 | 976.2 |
| D | 2 | 234 | 149117 | 148.77 | 4019 | 3897 | 976.2 |
| D | 7 | 238 | 48428 | 45.62 | 4019 | 3897 | 976.2 |
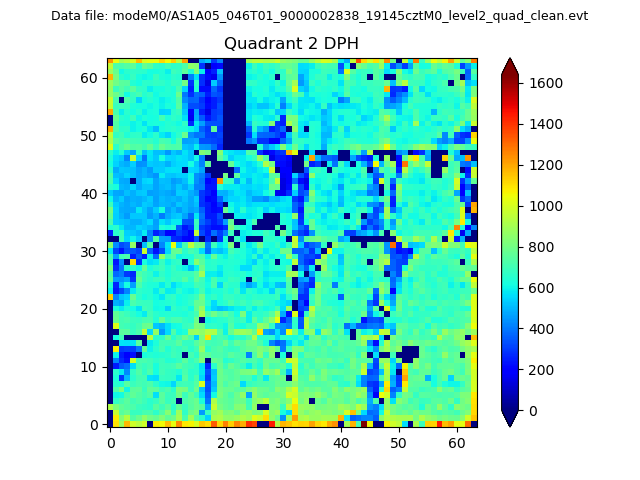
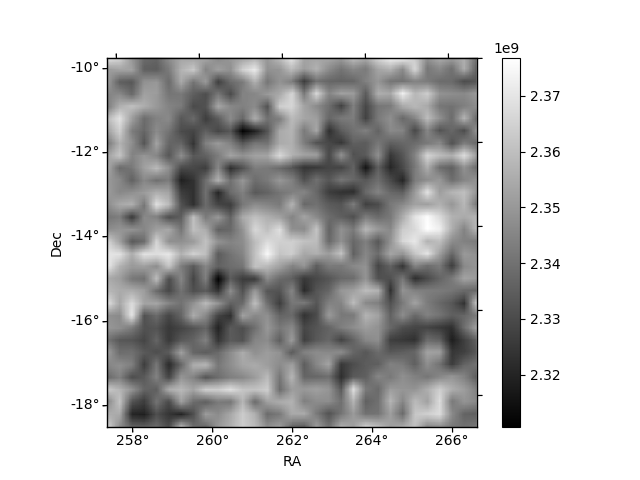
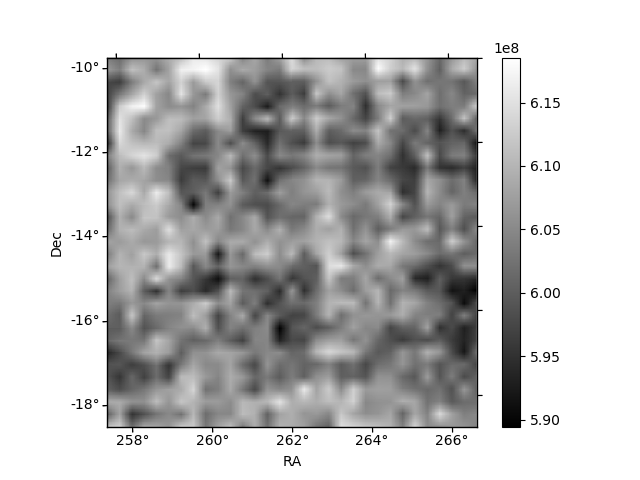
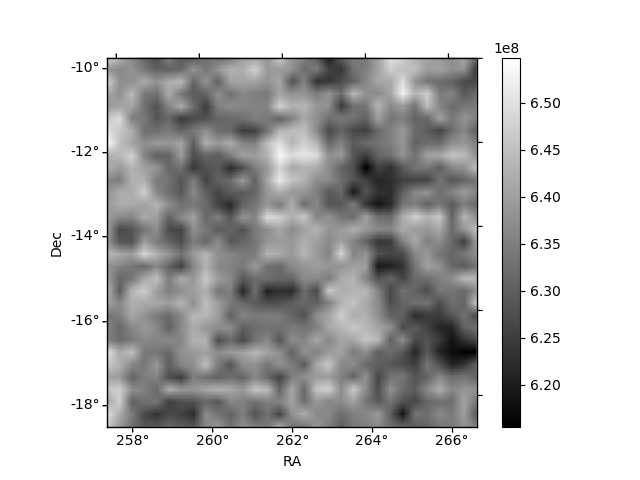
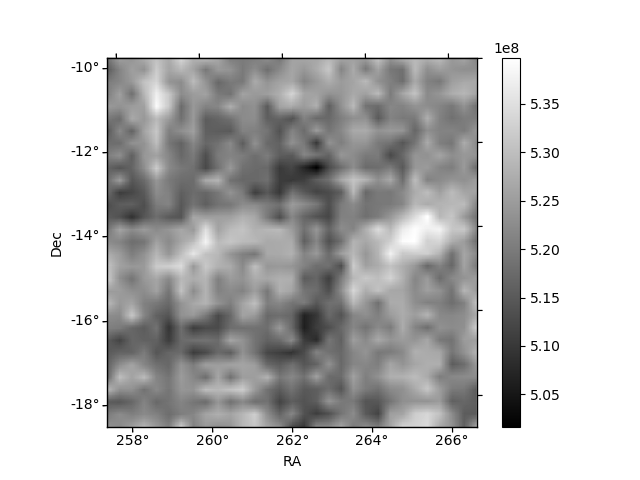
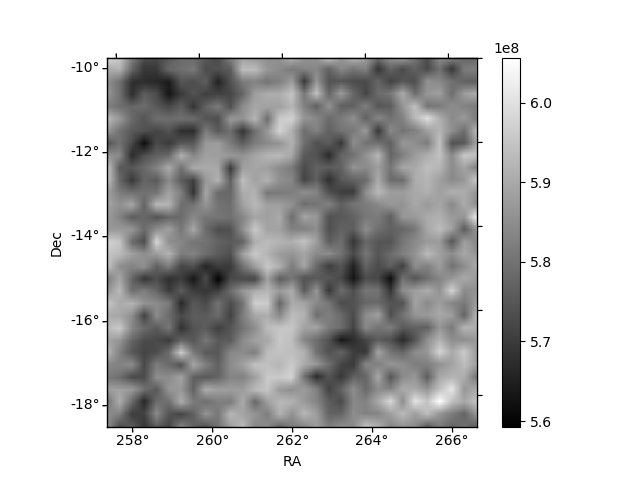
Histogram calculated using DETX and DETY for each event in the final _common_clean file
| Quadrant A | 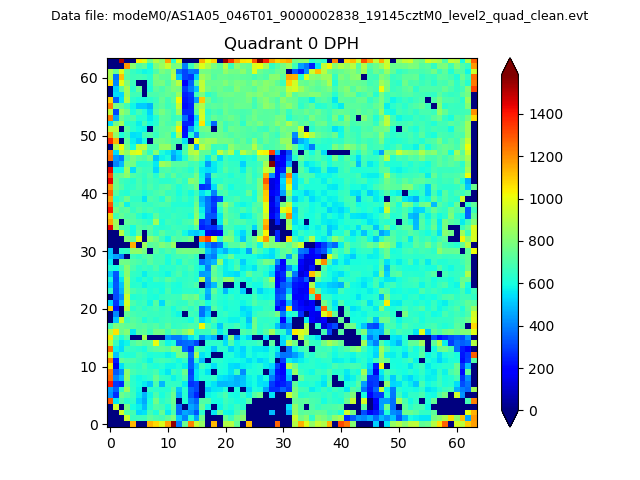 |
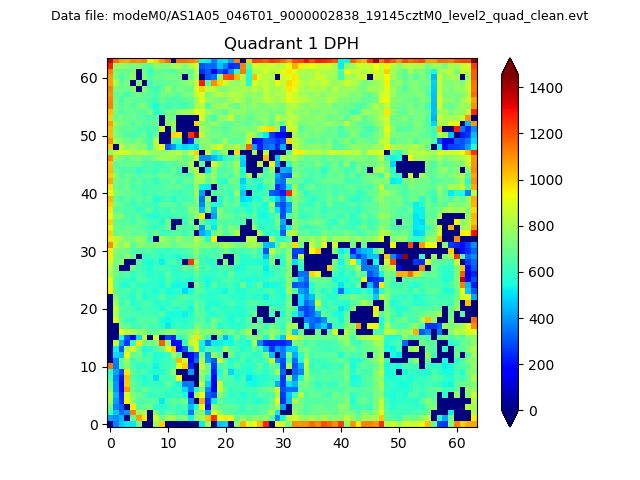 |
Quadrant B |
|---|---|---|---|
| Quadrant D | 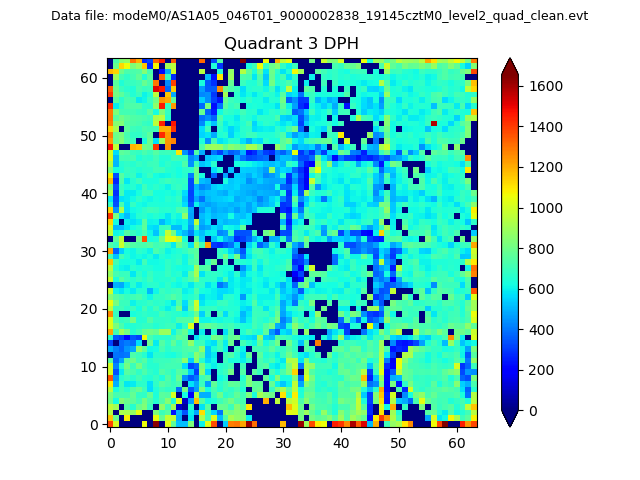 |
 |
Quadrant C |
| Plot type | Count rate plots | Images |
|---|---|---|
| Comparison with Poisson distribution Blue bars denote a histogram of data divided into 1 sec bins. Red curve is a Poisson curve with rate = median count rate of data. |
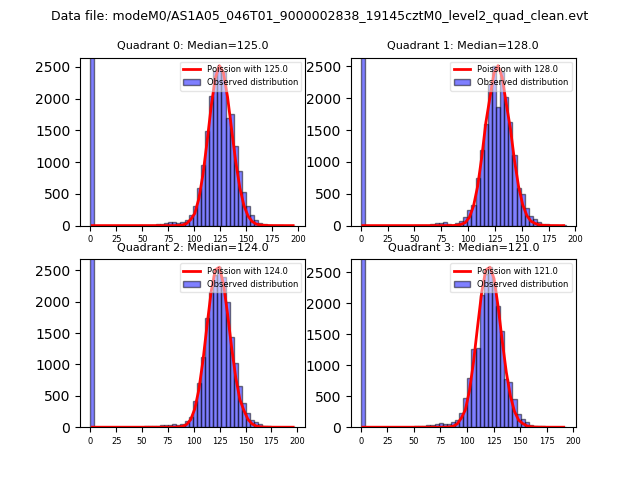 |
 |
| Quadrant-wise count rates Data is divided into 100 sec bins |
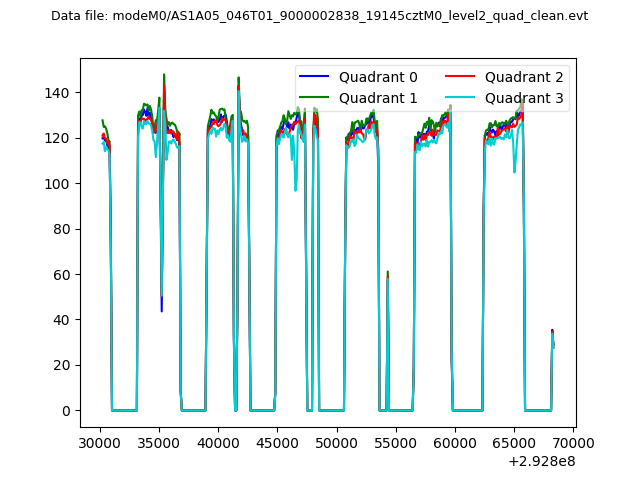 |
|
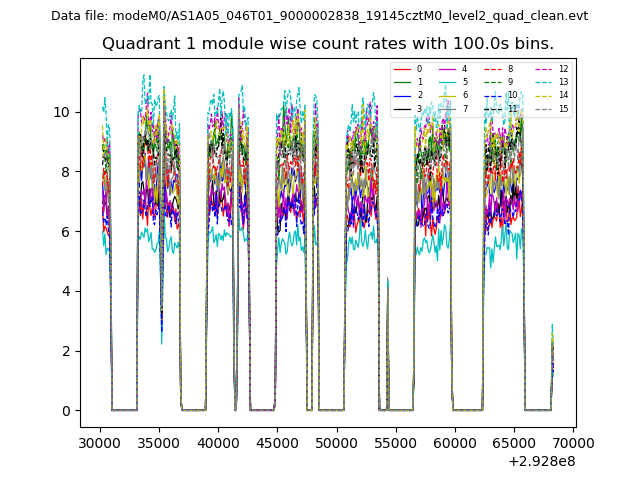
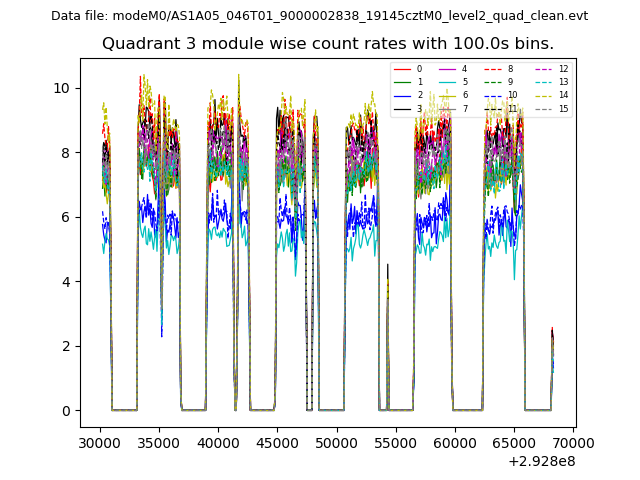
| Module-wise count rates for Quadrant A Data is divided into 100 sec bins |
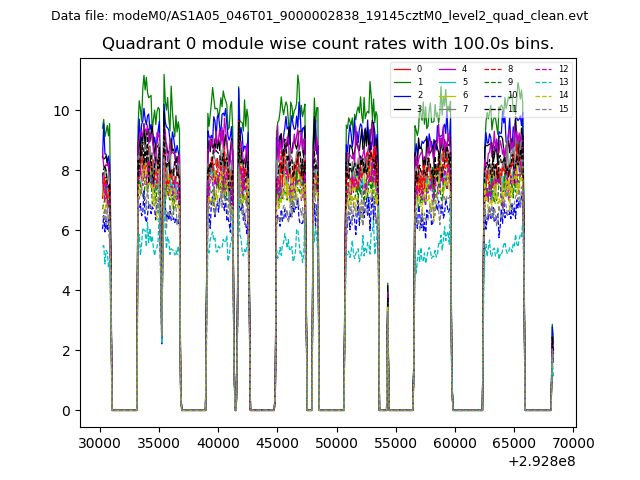 |
 |
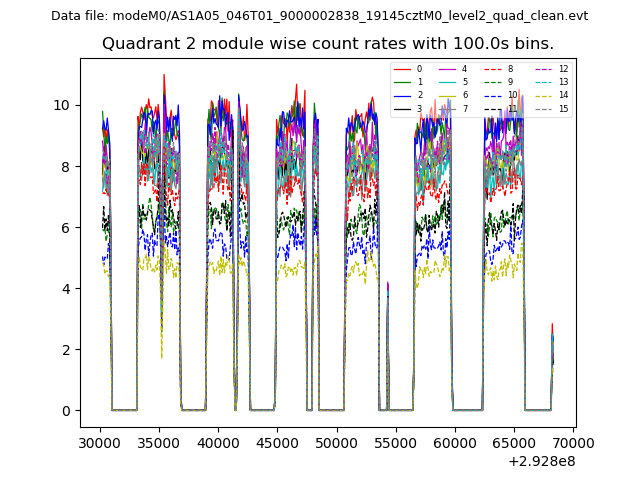
| Module-wise count rates for Quadrant B Data is divided into 100 sec bins |
 |
 |
| Module-wise count rates for Quadrant C Data is divided into 100 sec bins |
 |
 |
| Module-wise count rates for Quadrant D Data is divided into 100 sec bins |
 |
 |
| Parameter | Plot |
|---|---|
| CZT HV Monitor | 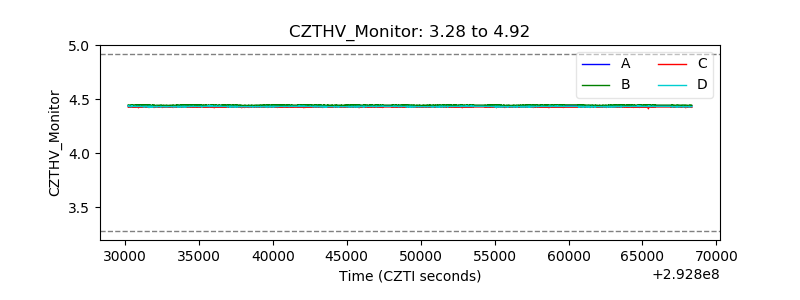 |
| D_VDD | 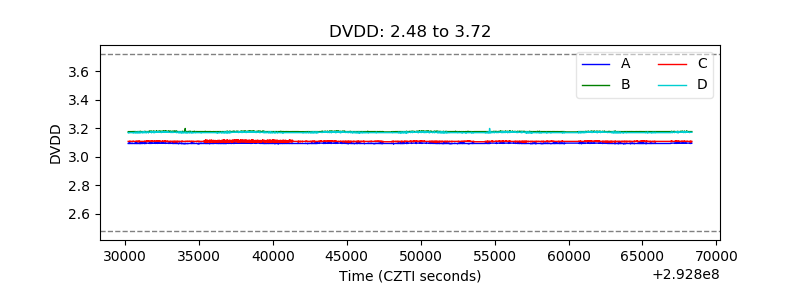 |
| Temperature 1 | 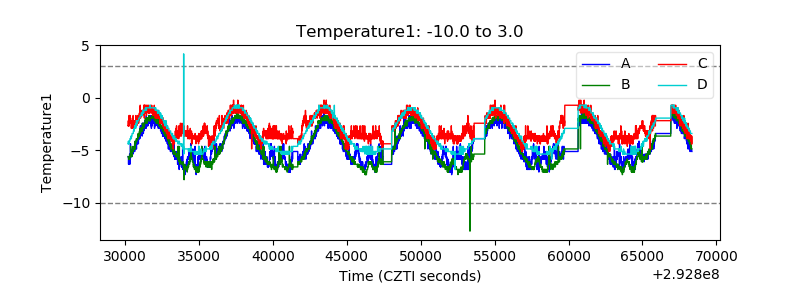 |
| Veto HV Monitor | 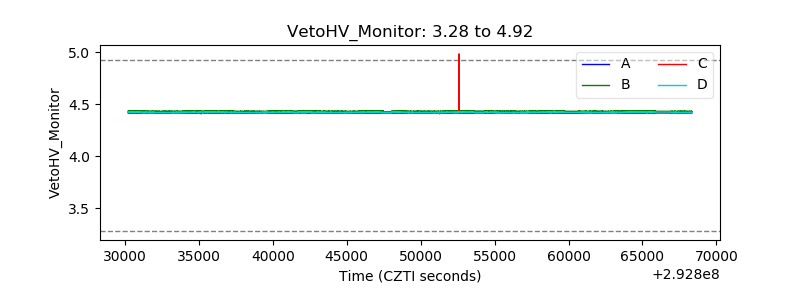 |
| Veto LLD | 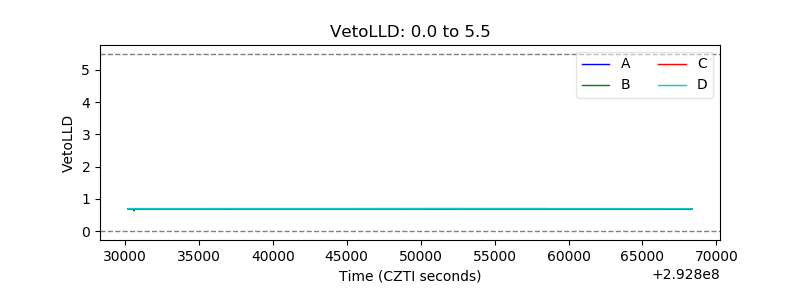 |
| Alpha Counter | 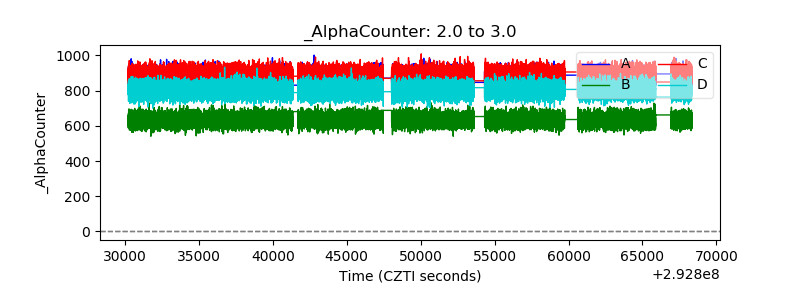 |
| _CPM_Rate | 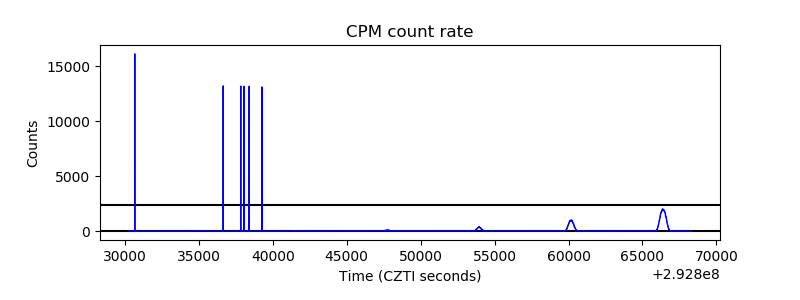 |
| CZT Counter | 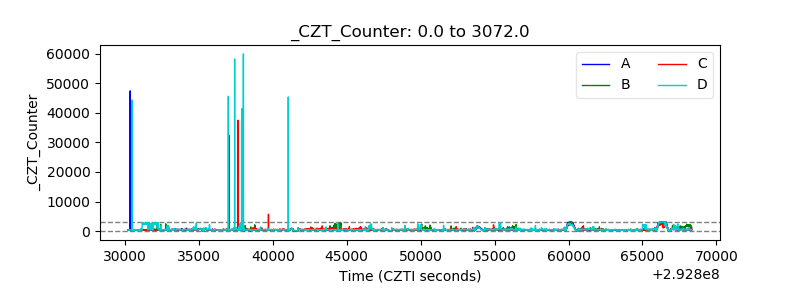 |
| +2.5 Volts monitor |  |
| +5 Volts monitor |  |
| _ROLL_ROT | 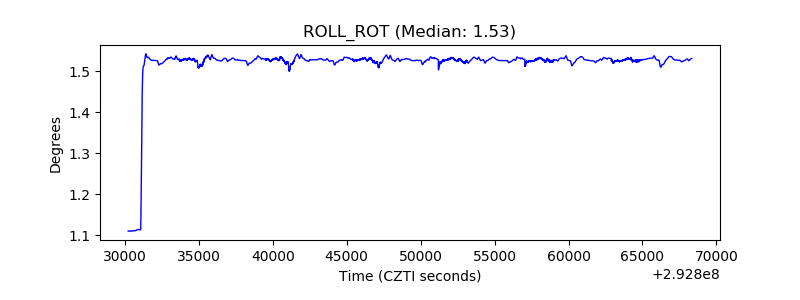 |
| _Roll_DEC | 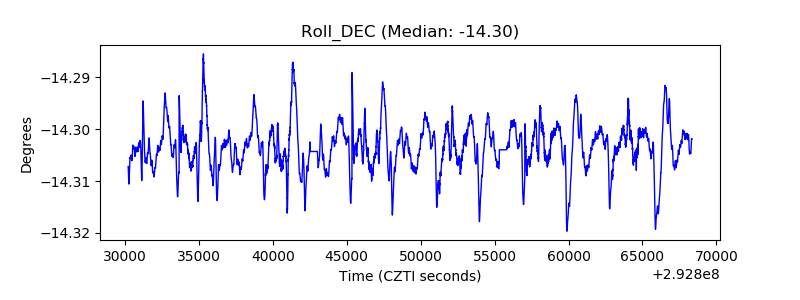 |
| _Roll_RA | 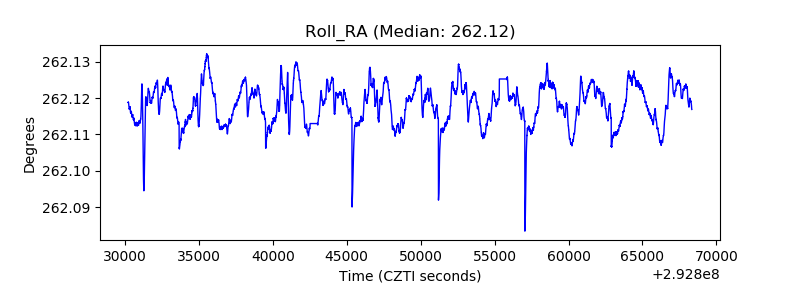 |
| Veto Counter | 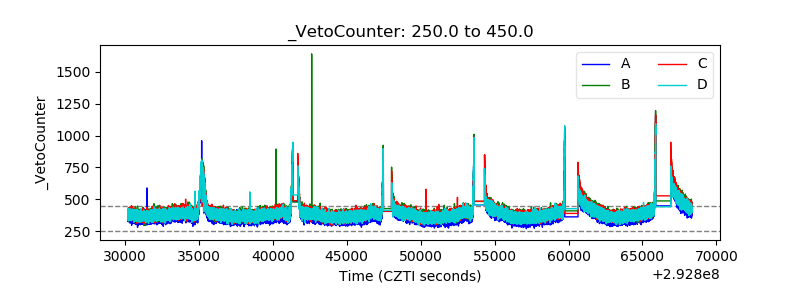 |