| Param | Original file | Final file |
|---|---|---|
| Filename | modeM0/AS1A05_046T01_9000002838_19147cztM0_level2.evt | modeM0/AS1A05_046T01_9000002838_19147cztM0_level2_quad_clean.evt |
| Size (bytes) | 534,248,640 | 83,387,520 |
| Size | 509.5 MB | 79.5 MB |
| Events in quadrant A | 3,261,619 | 523,982 |
| Events in quadrant B | 5,465,740 | 528,240 |
| Events in quadrant C | 3,373,045 | 518,528 |
| Events in quadrant D | 3,642,596 | 505,224 |
| Mode M0 | |||
|---|---|---|---|
| Quadrant | BADHDUFLAG | Total packets | Discarded packets |
| A | 0 | 13913 | 2 |
| B | 0 | 20599 | 2 |
| C | 0 | 14137 | 2 |
| D | 0 | 15142 | 2 |
| Mode SS | |||
|---|---|---|---|
| Quadrant | BADHDUFLAG | Total packets | Discarded packets |
| A | 0 | 134 | 0 |
| B | 0 | 134 | 0 |
| C | 0 | 134 | 0 |
| D | 0 | 134 | 0 |
| Mode M9 | |||
|---|---|---|---|
| Quadrant | BADHDUFLAG | Total packets | Discarded packets |
| A | 0 | 22 | 0 |
| B | 0 | 22 | 0 |
| C | 0 | 22 | 0 |
| D | 0 | 22 | 0 |
| Quadrant | Total seconds | Saturated seconds | Saturation percentage |
|---|---|---|---|
| A | 6435 | 96 | 1.491841% |
| B | 6435 | 491 | 7.630148% |
| C | 6435 | 129 | 2.004662% |
| D | 6435 | 192 | 2.983683% |
Noise dominated data is calculated using 1-second bins in cleaned event files. If a bin has >2000 counts, and if more than 50% of those come from <1% of pixels, then it is considered to be noise-dominated and hence unusable.
| Quadrant | # 1 sec bins | Bins with >0 counts | Bins with >2000 counts | High rate bins dominated by noise | Noise dominated (total time) | Noise dominated (detector-on time) | Marked lightcurve |
|---|---|---|---|---|---|---|---|
| A | 8640 | 6436 | 0 | 0 | 0.00% | 0.00% | 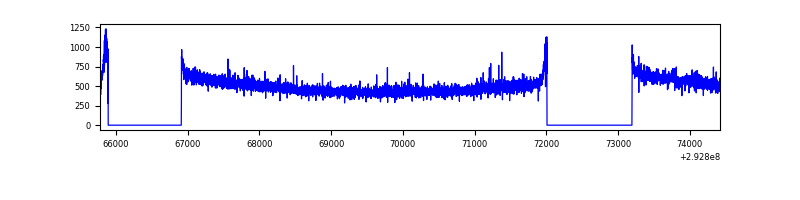 |
| B | 8640 | 6436 | 170 | 170 | 1.97% | 2.64% | 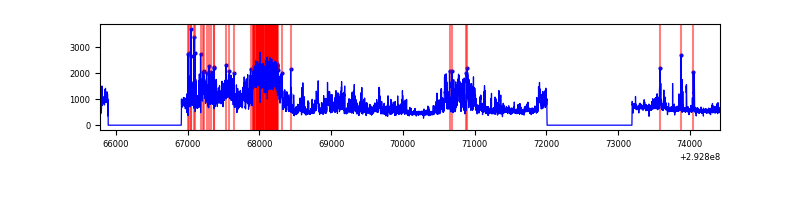 |
| C | 8640 | 6436 | 0 | 0 | 0.00% | 0.00% | 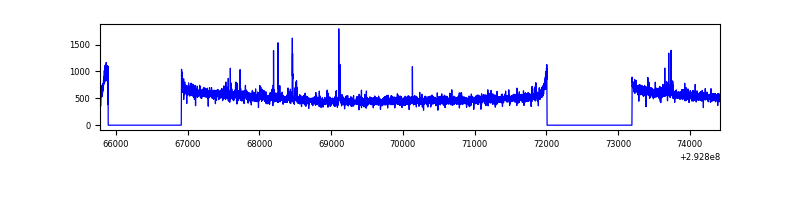 |
| D | 8640 | 6436 | 84 | 84 | 0.97% | 1.31% | 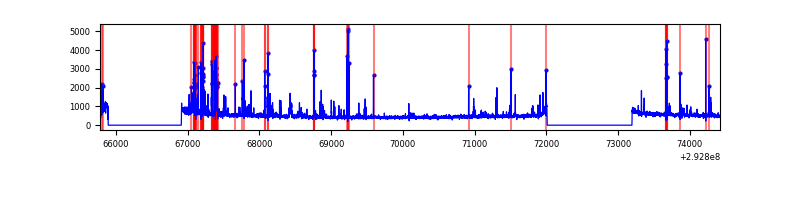 |
Top three noisy pixels from each quadrant. If the there are fewer than three noisy pixels in the level2.evt file, extra rows are filled as -1
| Pixel properties | Quadrant properties | ||||||
|---|---|---|---|---|---|---|---|
| Quadrant | DetID | PixID | Counts | Sigma | Mean | Median | Sigma |
| A | 11 | 29 | 7942 | 42.04 | 841 | 824 | 169.3 |
| A | 8 | 144 | 7663 | 40.39 | 841 | 824 | 169.3 |
| A | 0 | 226 | 7436 | 39.05 | 841 | 824 | 169.3 |
| B | 3 | 64 | 1926465 | 12217.13 | 832 | 813 | 157.6 |
| B | 7 | 220 | 145859 | 920.23 | 832 | 813 | 157.6 |
| B | 4 | 216 | 50871 | 317.59 | 832 | 813 | 157.6 |
| C | 14 | 238 | 129277 | 680.6 | 811 | 817 | 188.7 |
| C | 3 | 233 | 68768 | 360.01 | 811 | 817 | 188.7 |
| C | 0 | 207 | 13576 | 67.6 | 811 | 817 | 188.7 |
| D | 1 | 52 | 570156 | 2891.23 | 811 | 790 | 196.9 |
| D | 2 | 234 | 28319 | 139.79 | 811 | 790 | 196.9 |
| D | 14 | 226 | 7988 | 36.55 | 811 | 790 | 196.9 |
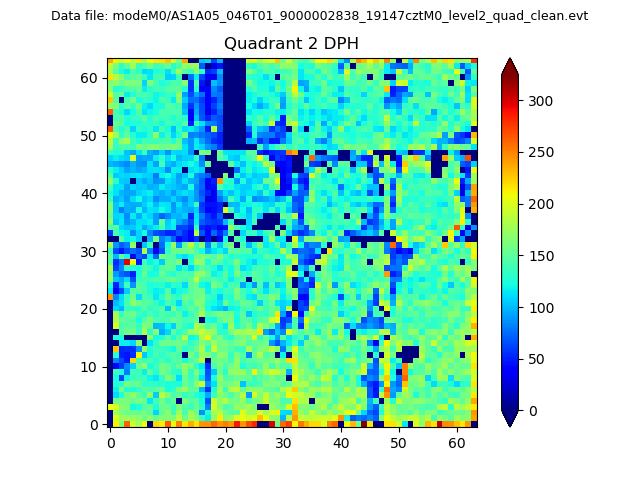
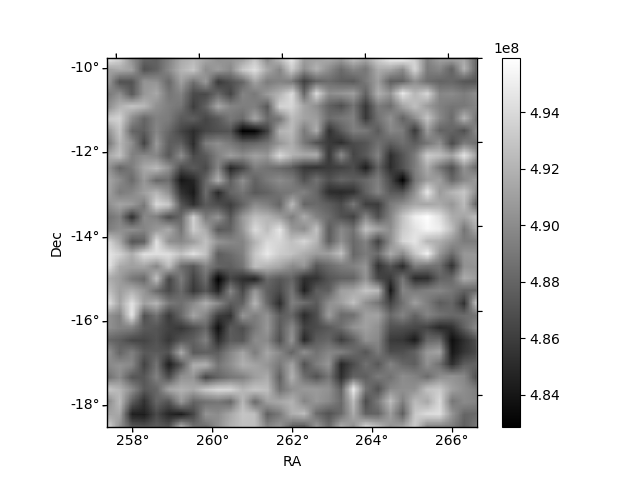
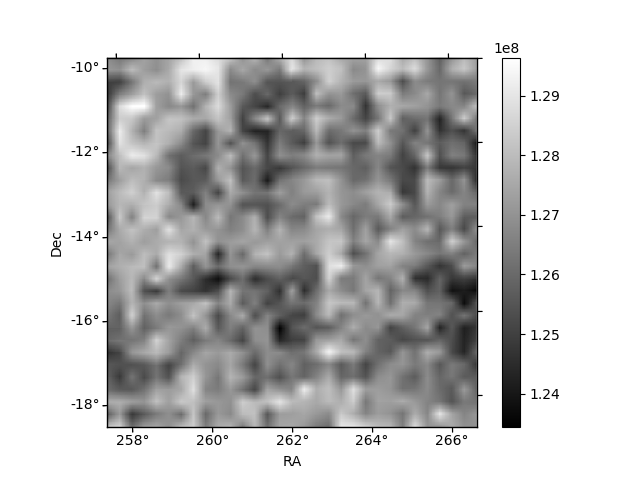
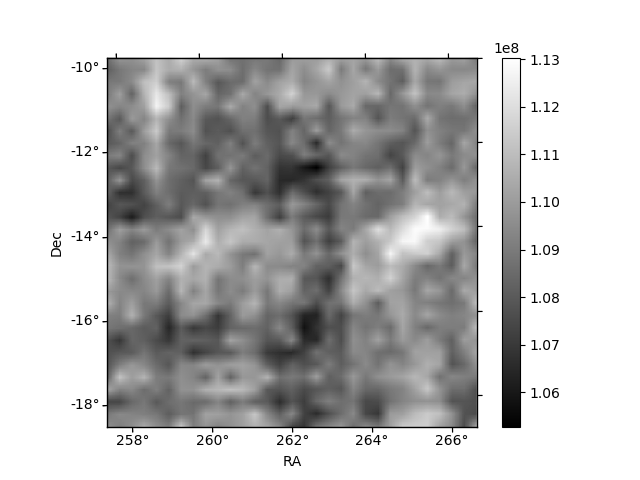
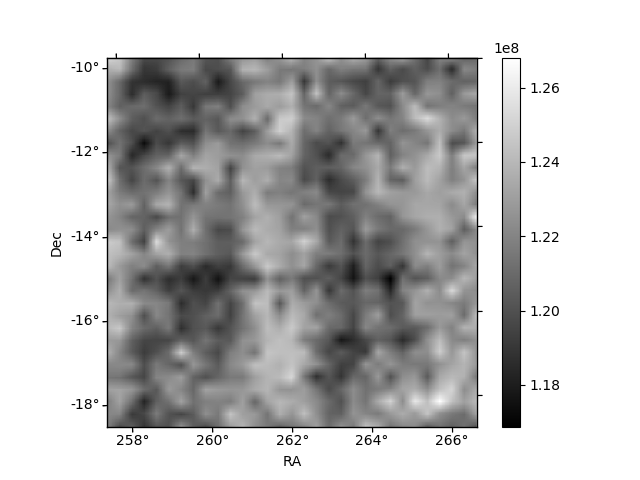
Histogram calculated using DETX and DETY for each event in the final _common_clean file
| Quadrant A | 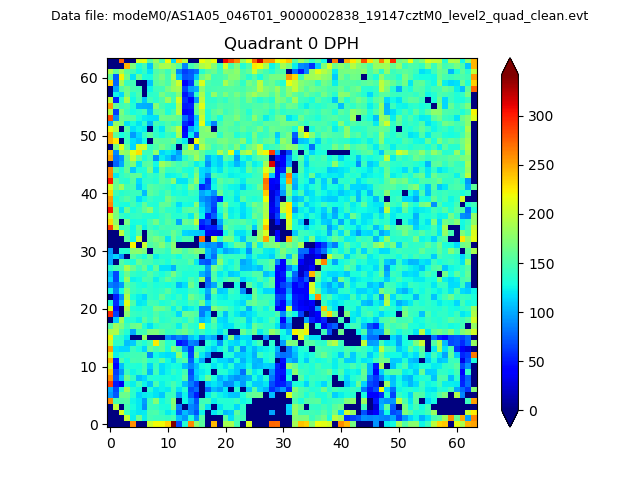 |
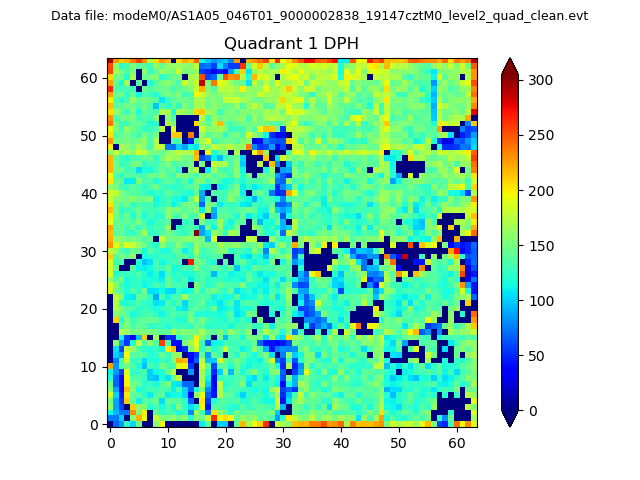 |
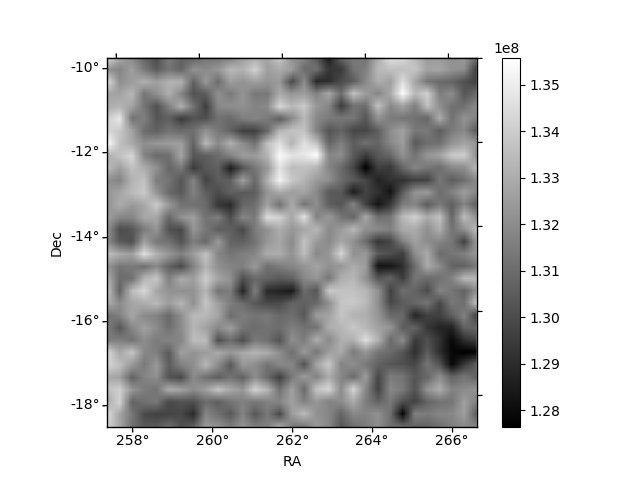
Quadrant B |
|---|---|---|---|
| Quadrant D | 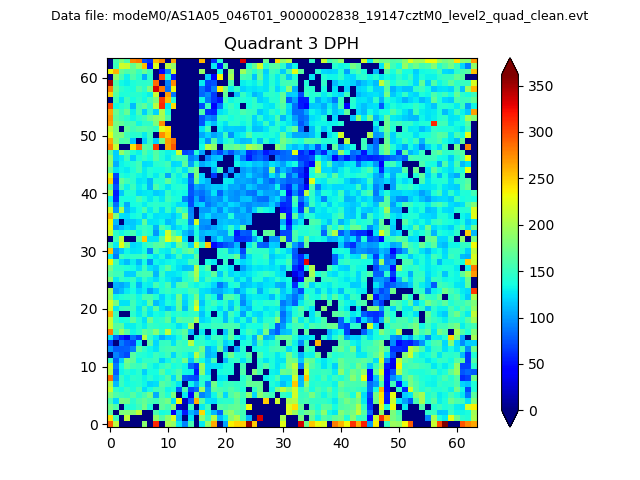 |
 |
Quadrant C |
| Plot type | Count rate plots | Images |
|---|---|---|
| Comparison with Poisson distribution Blue bars denote a histogram of data divided into 1 sec bins. Red curve is a Poisson curve with rate = median count rate of data. |
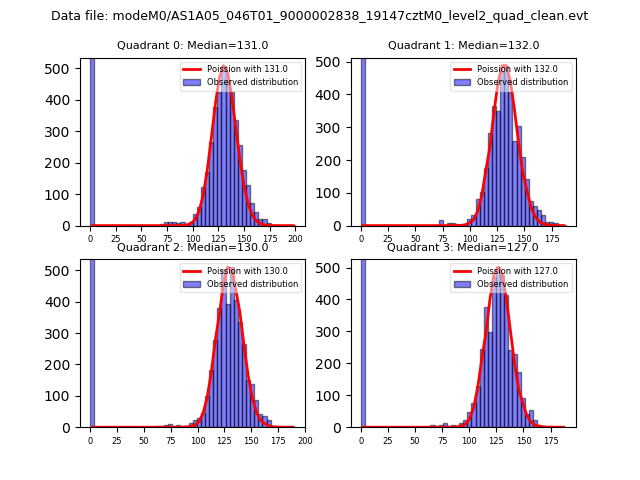 |
 |
| Quadrant-wise count rates Data is divided into 100 sec bins |
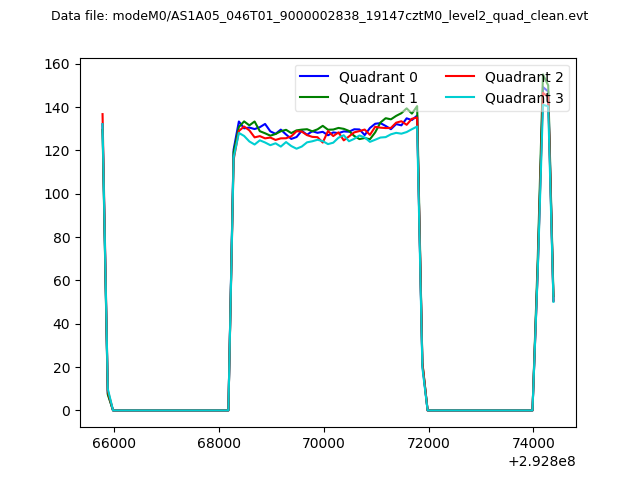 |
|
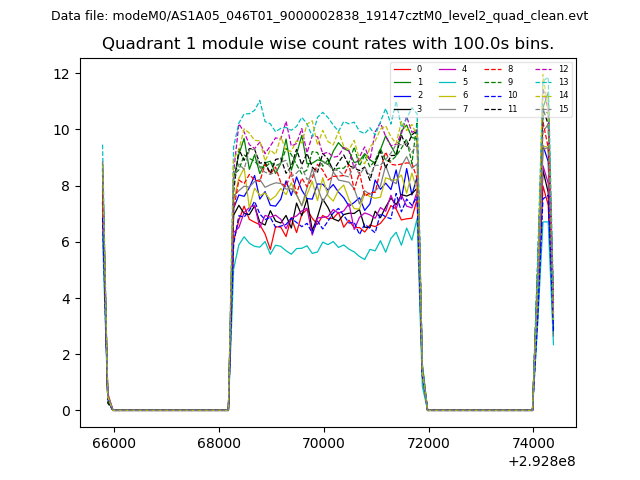
| Module-wise count rates for Quadrant A Data is divided into 100 sec bins |
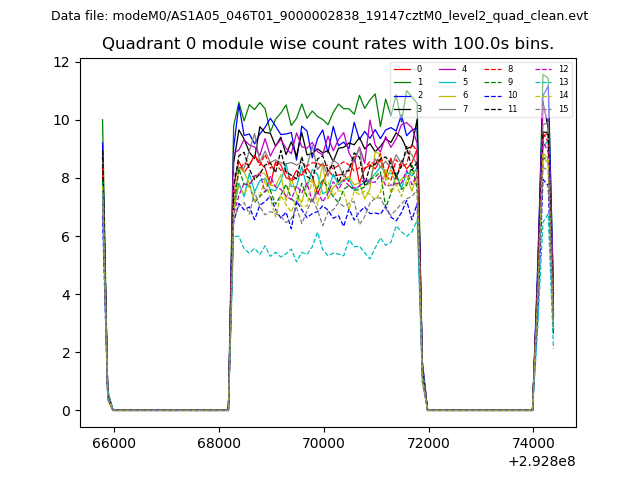 |
 |
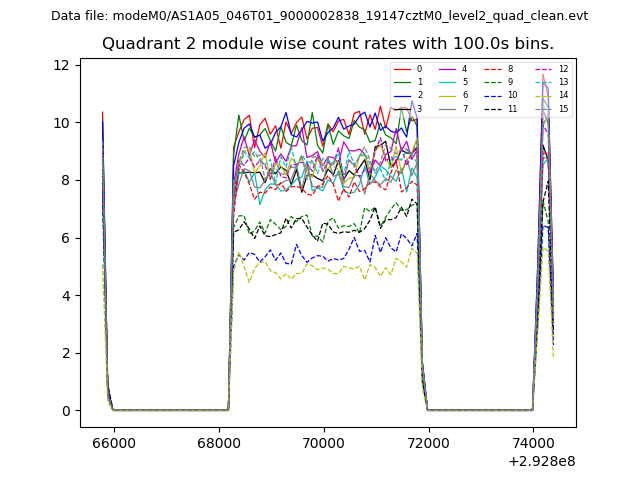
| Module-wise count rates for Quadrant B Data is divided into 100 sec bins |
 |
 |
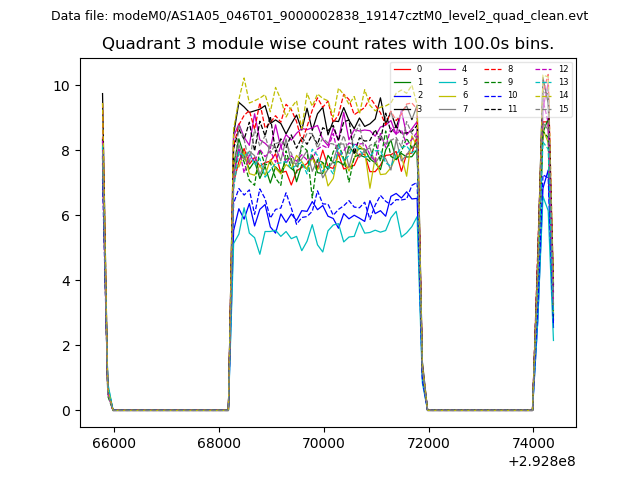
| Module-wise count rates for Quadrant C Data is divided into 100 sec bins |
 |
 |
| Module-wise count rates for Quadrant D Data is divided into 100 sec bins |
 |
 |
| Parameter | Plot |
|---|---|
| CZT HV Monitor | 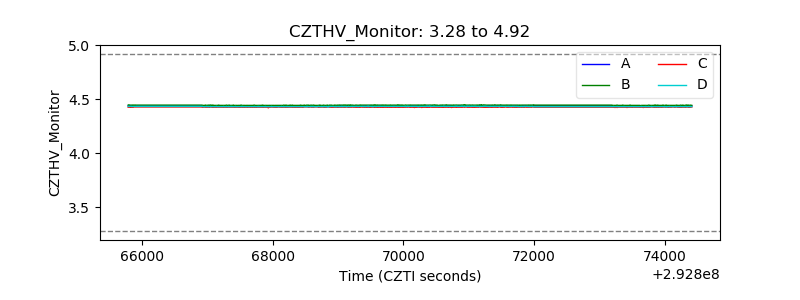 |
| D_VDD | 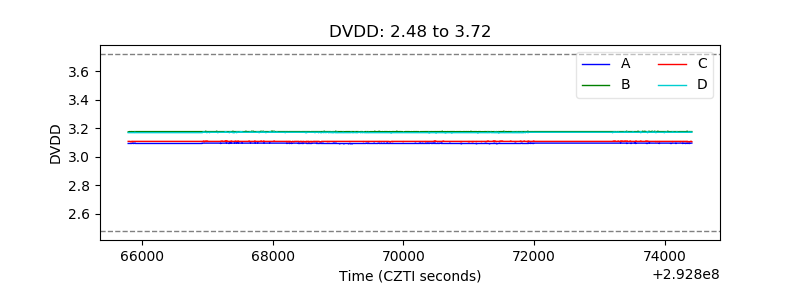 |
| Temperature 1 | 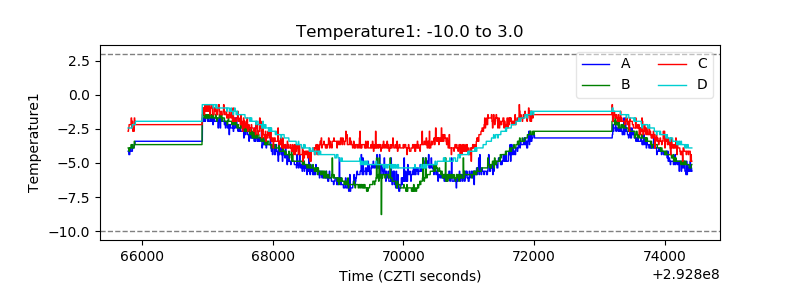 |
| Veto HV Monitor | 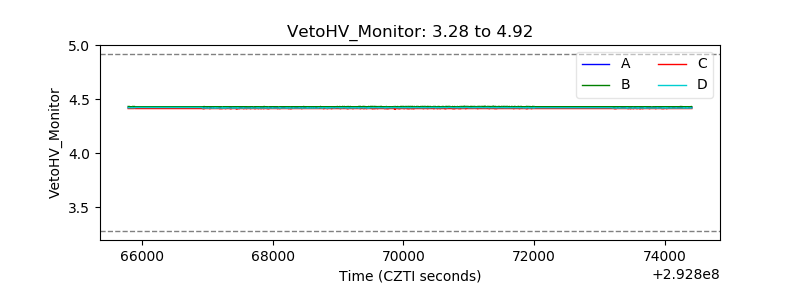 |
| Veto LLD | 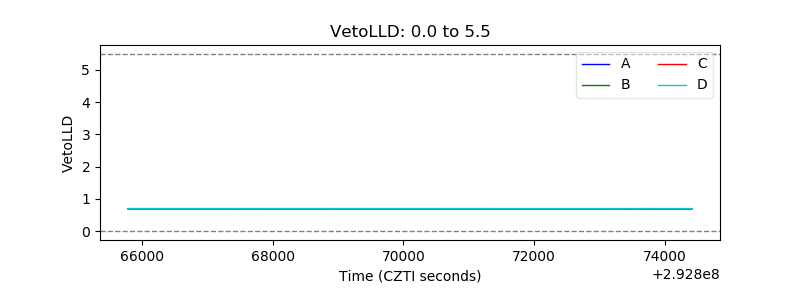 |
| Alpha Counter | 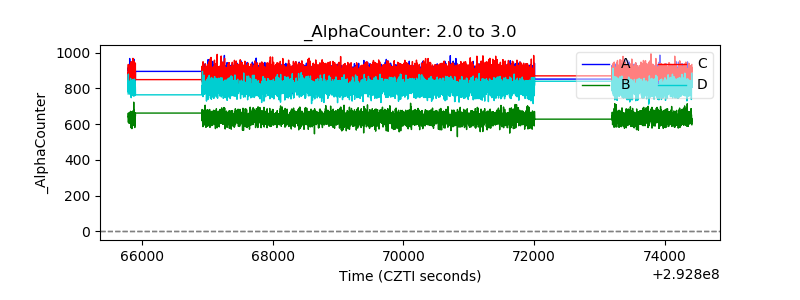 |
| _CPM_Rate | 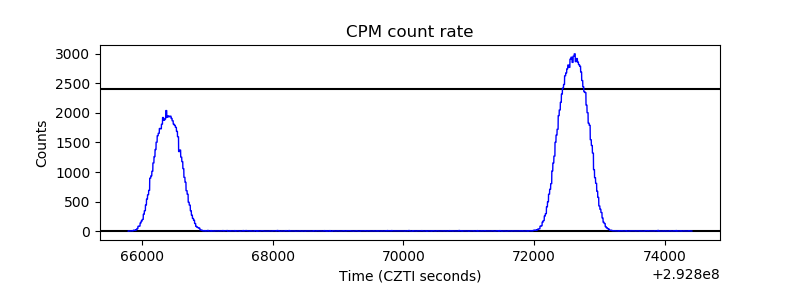 |
| CZT Counter | 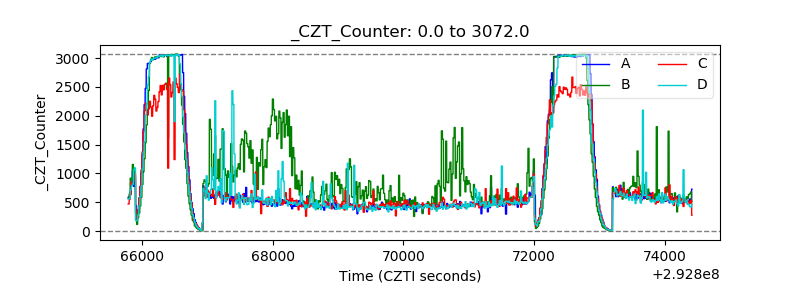 |
| +2.5 Volts monitor | 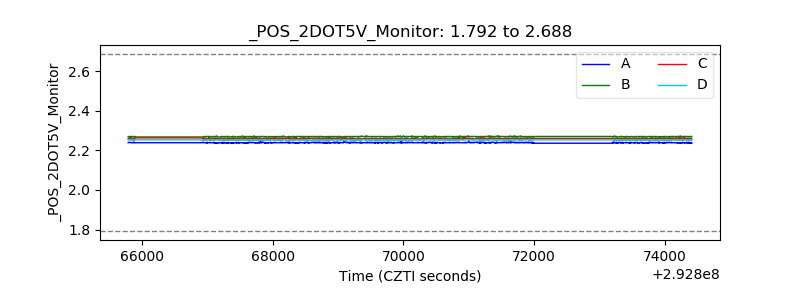 |
| +5 Volts monitor |  |
| _ROLL_ROT | 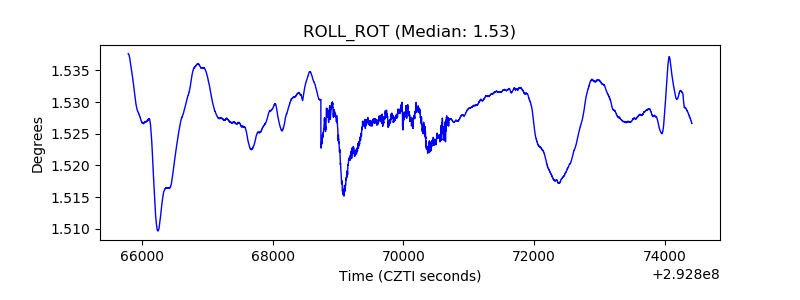 |
| _Roll_DEC |  |
| _Roll_RA | 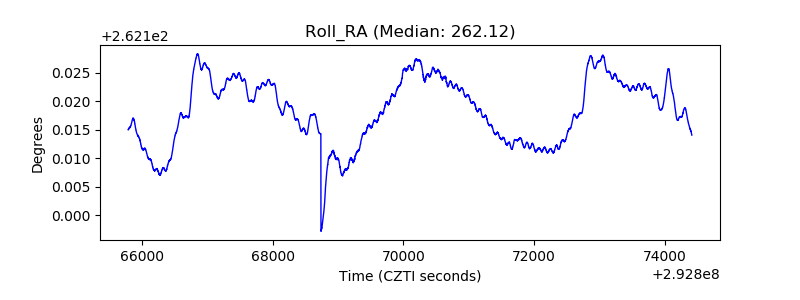 |
| Veto Counter | 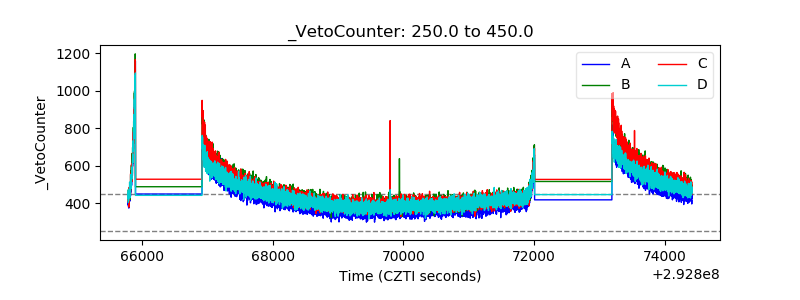 |