| Param | Original file | Final file |
|---|---|---|
| Filename | modeM0/AS1A05_046T01_9000002838_19150cztM0_level2.evt | modeM0/AS1A05_046T01_9000002838_19150cztM0_level2_quad_clean.evt |
| Size (bytes) | 461,839,680 | 108,636,480 |
| Size | 440.4 MB | 103.6 MB |
| Events in quadrant A | 3,672,611 | 712,355 |
| Events in quadrant B | 3,321,403 | 742,264 |
| Events in quadrant C | 3,402,400 | 713,860 |
| Events in quadrant D | 3,165,749 | 685,488 |
| Mode M0 | |||
|---|---|---|---|
| Quadrant | BADHDUFLAG | Total packets | Discarded packets |
| A | 0 | 14843 | 2 |
| B | 0 | 13748 | 2 |
| C | 0 | 13870 | 3 |
| D | 0 | 13393 | 2 |
| Mode SS | |||
|---|---|---|---|
| Quadrant | BADHDUFLAG | Total packets | Discarded packets |
| A | 0 | 128 | 0 |
| B | 0 | 128 | 0 |
| C | 0 | 128 | 0 |
| D | 0 | 128 | 0 |
| Mode M9 | |||
|---|---|---|---|
| Quadrant | BADHDUFLAG | Total packets | Discarded packets |
| A | 0 | 14 | 0 |
| B | 0 | 15 | 0 |
| C | 0 | 15 | 0 |
| D | 0 | 15 | 0 |
| Quadrant | Total seconds | Saturated seconds | Saturation percentage |
|---|---|---|---|
| A | 6247 | 307 | 4.914359% |
| B | 6247 | 93 | 1.488715% |
| C | 6246 | 92 | 1.472943% |
| D | 6246 | 18 | 0.288184% |
Noise dominated data is calculated using 1-second bins in cleaned event files. If a bin has >2000 counts, and if more than 50% of those come from <1% of pixels, then it is considered to be noise-dominated and hence unusable.
| Quadrant | # 1 sec bins | Bins with >0 counts | Bins with >2000 counts | High rate bins dominated by noise | Noise dominated (total time) | Noise dominated (detector-on time) | Marked lightcurve |
|---|---|---|---|---|---|---|---|
| A | 7572 | 6248 | 199 | 199 | 2.63% | 3.19% | 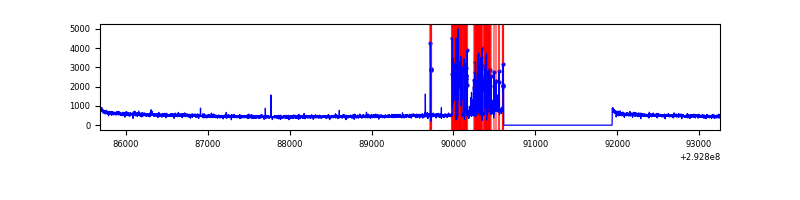 |
| B | 7572 | 6248 | 5 | 5 | 0.07% | 0.08% | 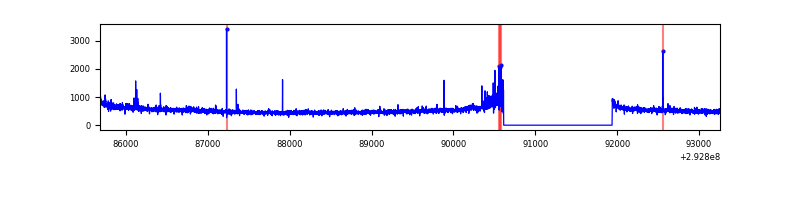 |
| C | 7571 | 6247 | 5 | 5 | 0.07% | 0.08% | 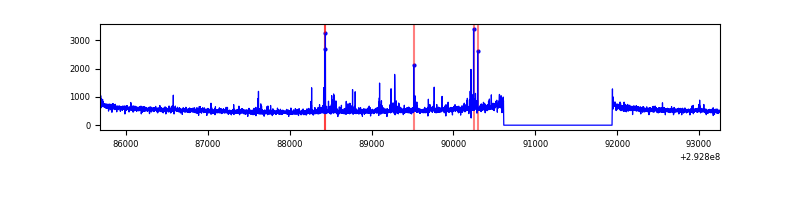 |
| D | 7571 | 6247 | 7 | 7 | 0.09% | 0.11% | 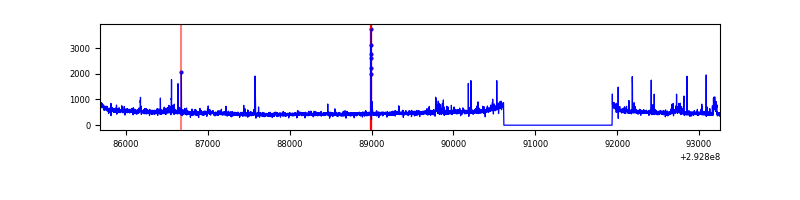 |
Top three noisy pixels from each quadrant. If the there are fewer than three noisy pixels in the level2.evt file, extra rows are filled as -1
| Pixel properties | Quadrant properties | ||||||
|---|---|---|---|---|---|---|---|
| Quadrant | DetID | PixID | Counts | Sigma | Mean | Median | Sigma |
| A | 13 | 170 | 616276 | 3886.24 | 790 | 773 | 158.4 |
| A | 15 | 174 | 8412 | 48.23 | 790 | 773 | 158.4 |
| A | 0 | 226 | 6735 | 37.64 | 790 | 773 | 158.4 |
| B | 7 | 220 | 50423 | 318.59 | 821 | 799 | 155.8 |
| B | 3 | 112 | 22280 | 137.91 | 821 | 799 | 155.8 |
| B | 12 | 111 | 17478 | 107.08 | 821 | 799 | 155.8 |
| C | 3 | 233 | 163391 | 882.05 | 794 | 803 | 184.3 |
| C | 14 | 238 | 125042 | 674.0 | 794 | 803 | 184.3 |
| C | 0 | 207 | 20759 | 108.26 | 794 | 803 | 184.3 |
| D | 1 | 52 | 168934 | 873.81 | 792 | 772 | 192.4 |
| D | 2 | 234 | 25805 | 130.08 | 792 | 772 | 192.4 |
| D | 10 | 199 | 12081 | 58.76 | 792 | 772 | 192.4 |
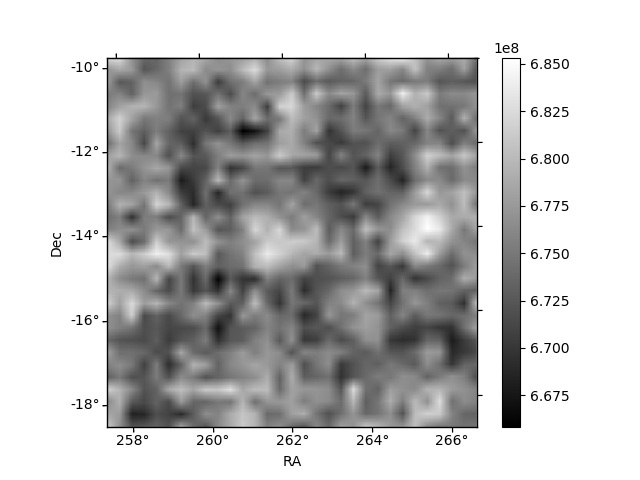
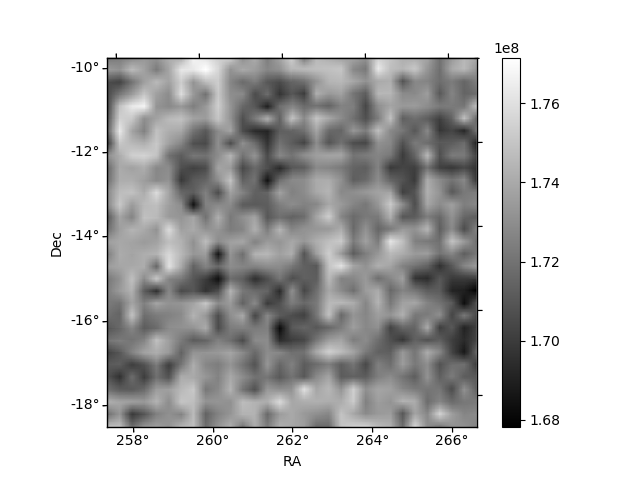
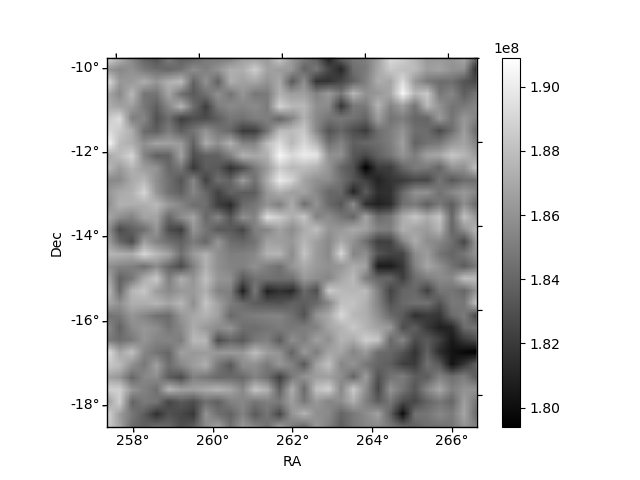
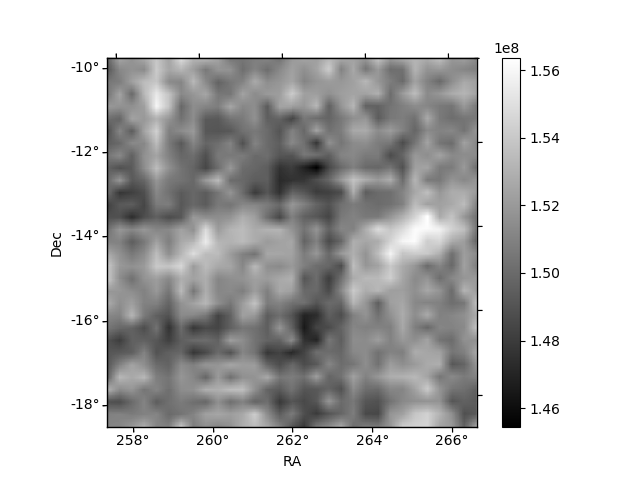
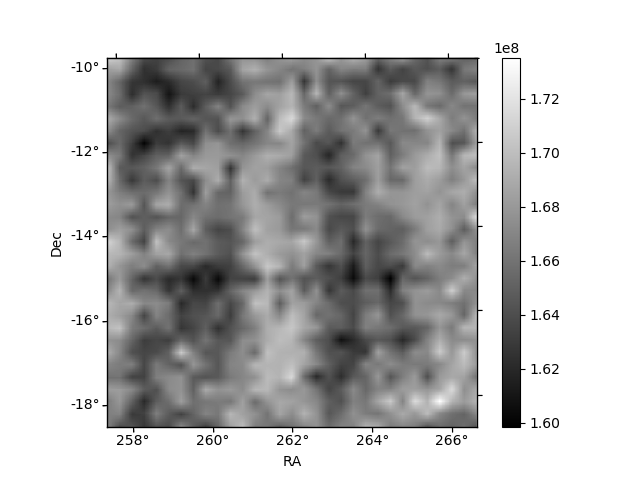
Histogram calculated using DETX and DETY for each event in the final _common_clean file
| Quadrant A | 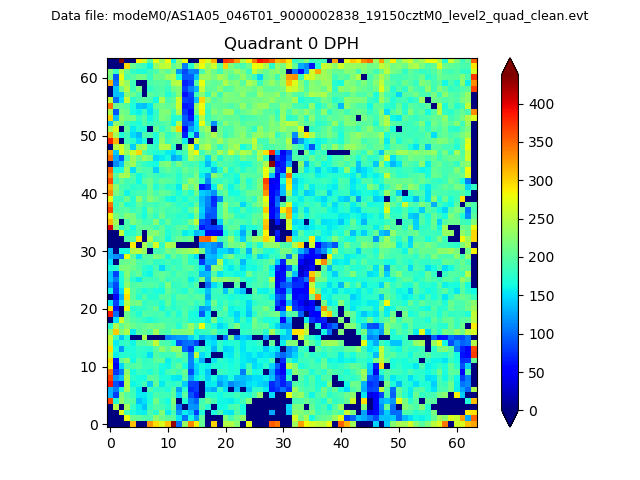 |
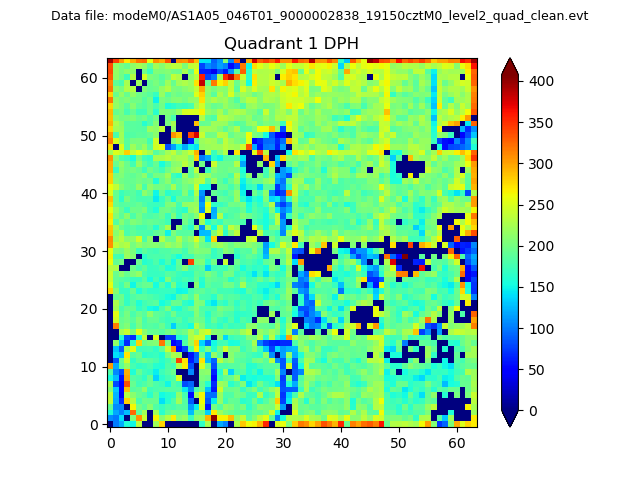 |
Quadrant B |
|---|---|---|---|
| Quadrant D | 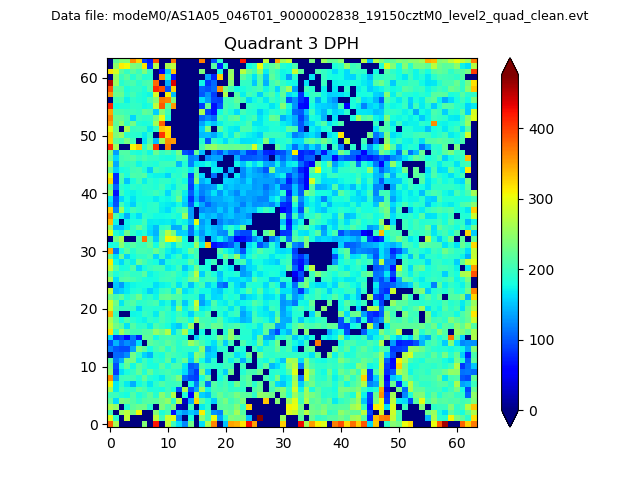 |
 |
Quadrant C |
| Plot type | Count rate plots | Images |
|---|---|---|
| Comparison with Poisson distribution Blue bars denote a histogram of data divided into 1 sec bins. Red curve is a Poisson curve with rate = median count rate of data. |
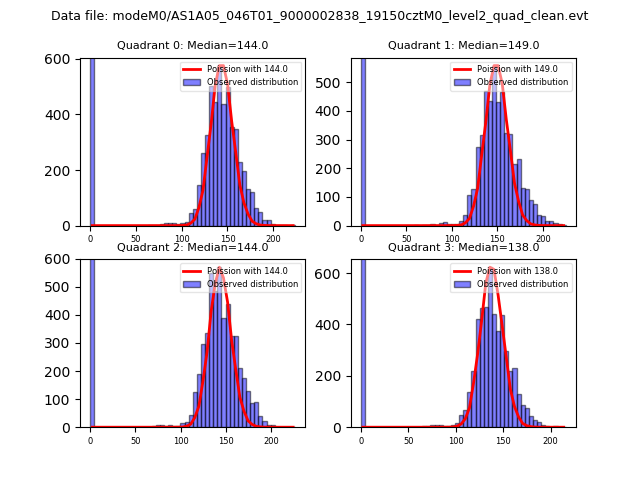 |
 |
| Quadrant-wise count rates Data is divided into 100 sec bins |
 |
|
| Module-wise count rates for Quadrant A Data is divided into 100 sec bins |
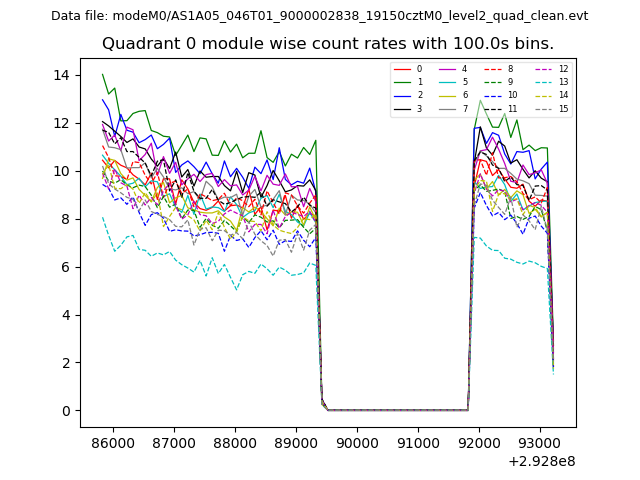 |
 |
| Module-wise count rates for Quadrant B Data is divided into 100 sec bins |
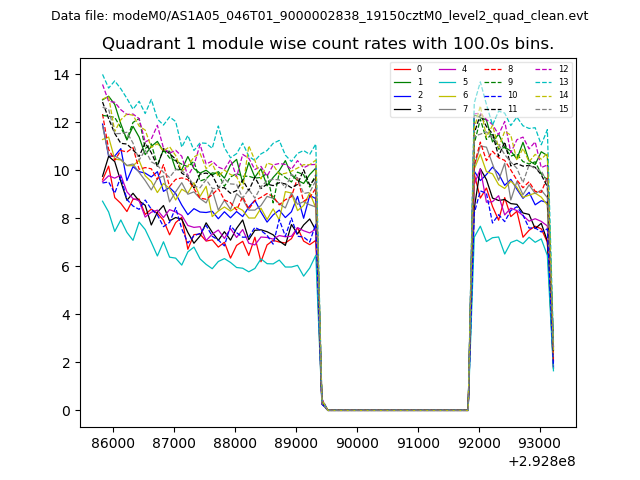 |
 |
| Module-wise count rates for Quadrant C Data is divided into 100 sec bins |
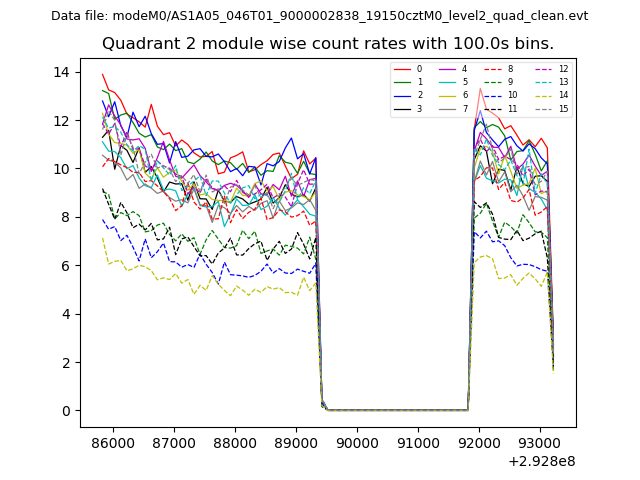 |
 |
| Module-wise count rates for Quadrant D Data is divided into 100 sec bins |
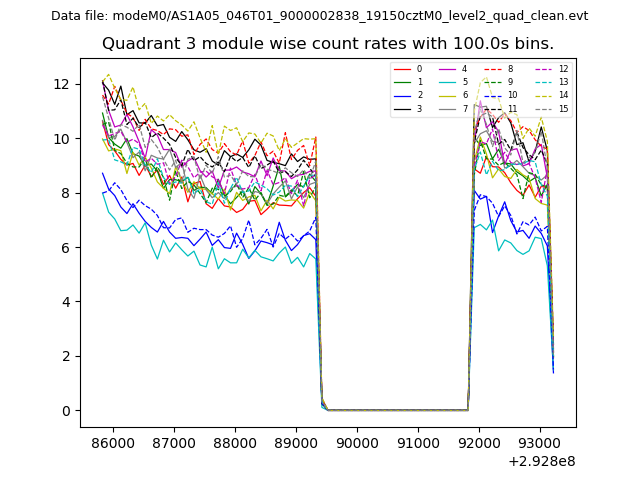 |
 |
| Parameter | Plot |
|---|---|
| CZT HV Monitor | 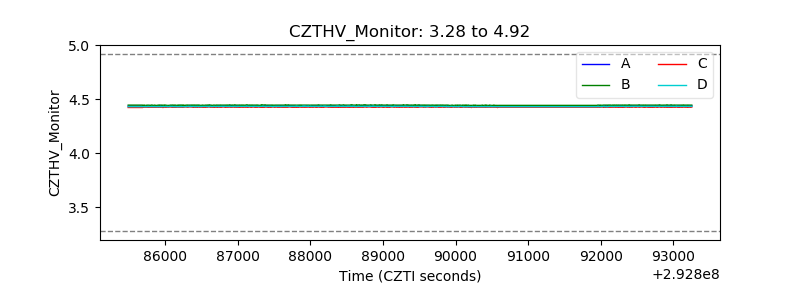 |
| D_VDD | 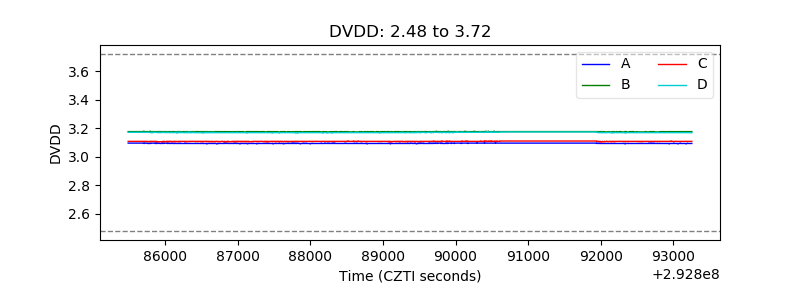 |
| Temperature 1 | 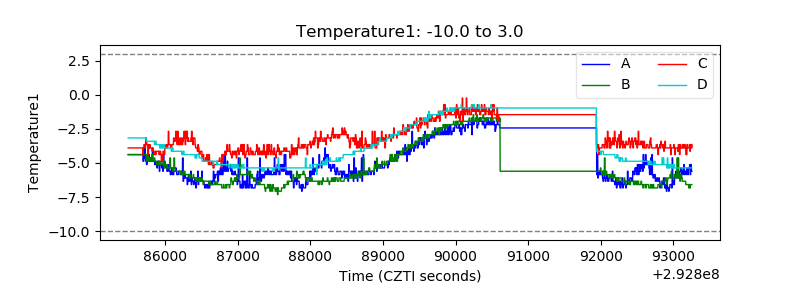 |
| Veto HV Monitor | 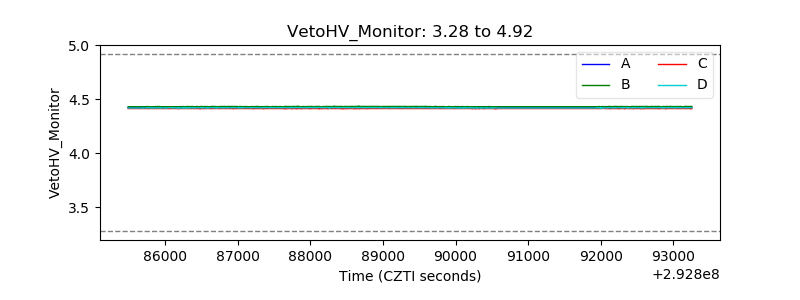 |
| Veto LLD | 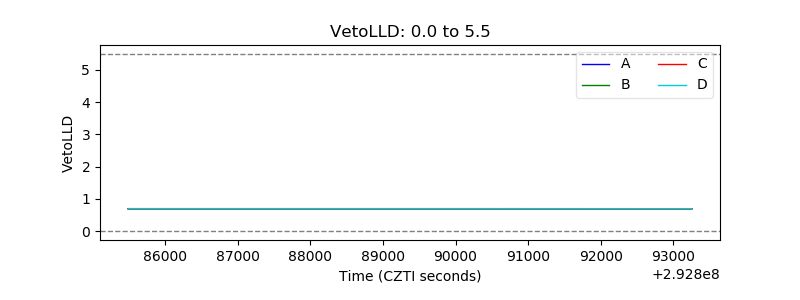 |
| Alpha Counter |  |
| _CPM_Rate | 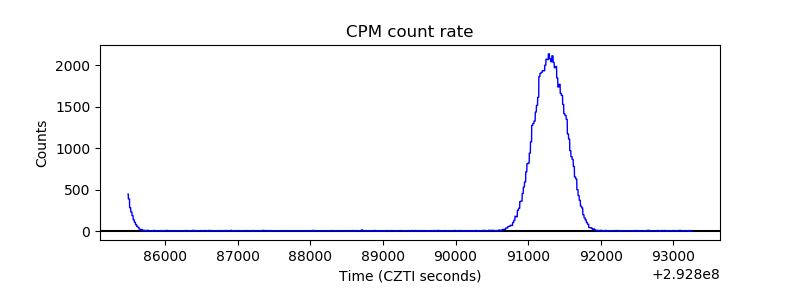 |
| CZT Counter |  |
| +2.5 Volts monitor |  |
| +5 Volts monitor |  |
| _ROLL_ROT |  |
| _Roll_DEC | 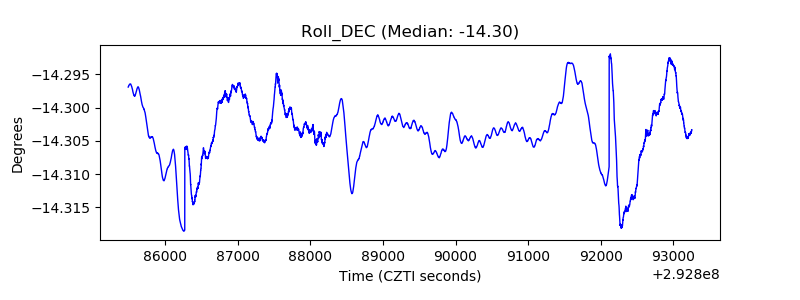 |
| _Roll_RA | 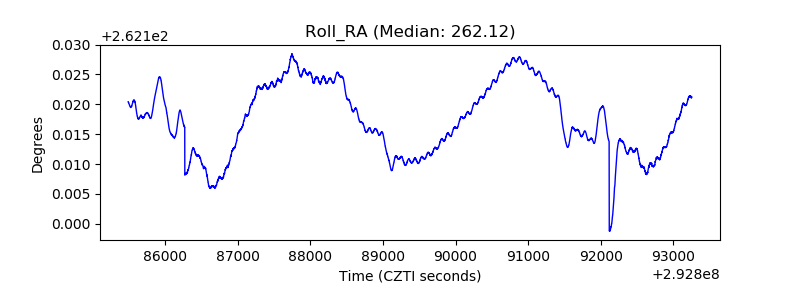 |
| Veto Counter | 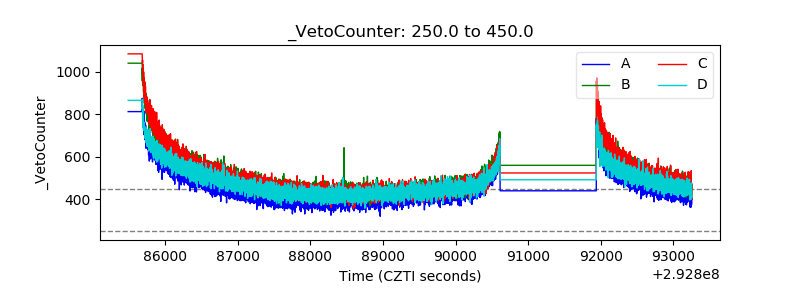 |