| Param | Original file | Final file |
|---|---|---|
| Filename | modeM0/AS1A05_046T01_9000002838_19151cztM0_level2.evt | modeM0/AS1A05_046T01_9000002838_19151cztM0_level2_quad_clean.evt |
| Size (bytes) | 457,024,320 | 99,665,280 |
| Size | 435.9 MB | 95.0 MB |
| Events in quadrant A | 3,282,054 | 640,488 |
| Events in quadrant B | 3,445,315 | 665,636 |
| Events in quadrant C | 3,525,982 | 642,893 |
| Events in quadrant D | 3,148,894 | 618,866 |
| Mode M0 | |||
|---|---|---|---|
| Quadrant | BADHDUFLAG | Total packets | Discarded packets |
| A | 0 | 13900 | 2 |
| B | 0 | 14342 | 3 |
| C | 0 | 14363 | 2 |
| D | 0 | 13652 | 2 |
| Mode SS | |||
|---|---|---|---|
| Quadrant | BADHDUFLAG | Total packets | Discarded packets |
| A | 0 | 134 | 0 |
| B | 0 | 134 | 0 |
| C | 0 | 134 | 0 |
| D | 0 | 134 | 0 |
| Mode M9 | |||
|---|---|---|---|
| Quadrant | BADHDUFLAG | Total packets | Discarded packets |
| A | 0 | 25 | 0 |
| B | 0 | 25 | 0 |
| C | 0 | 25 | 0 |
| D | 0 | 25 | 0 |
| Quadrant | Total seconds | Saturated seconds | Saturation percentage |
|---|---|---|---|
| A | 6456 | 92 | 1.425031% |
| B | 6455 | 157 | 2.432223% |
| C | 6455 | 107 | 1.657630% |
| D | 6456 | 17 | 0.263321% |
Noise dominated data is calculated using 1-second bins in cleaned event files. If a bin has >2000 counts, and if more than 50% of those come from <1% of pixels, then it is considered to be noise-dominated and hence unusable.
| Quadrant | # 1 sec bins | Bins with >0 counts | Bins with >2000 counts | High rate bins dominated by noise | Noise dominated (total time) | Noise dominated (detector-on time) | Marked lightcurve |
|---|---|---|---|---|---|---|---|
| A | 9001 | 6458 | 21 | 21 | 0.23% | 0.33% | 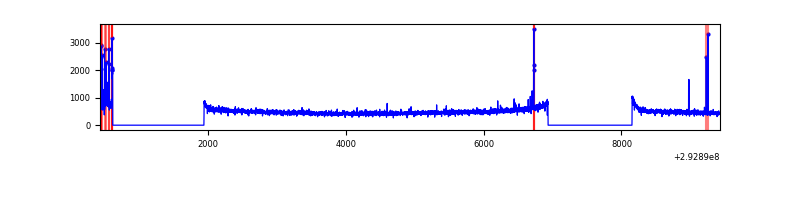 |
| B | 9000 | 6457 | 19 | 19 | 0.21% | 0.29% | 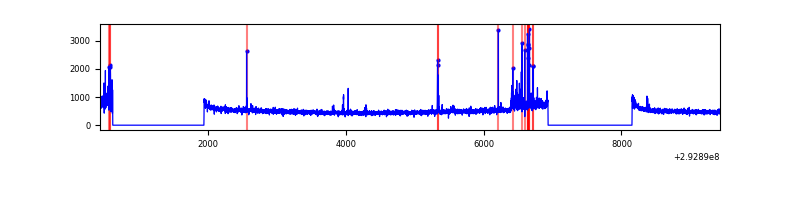 |
| C | 9000 | 6457 | 5 | 5 | 0.06% | 0.08% | 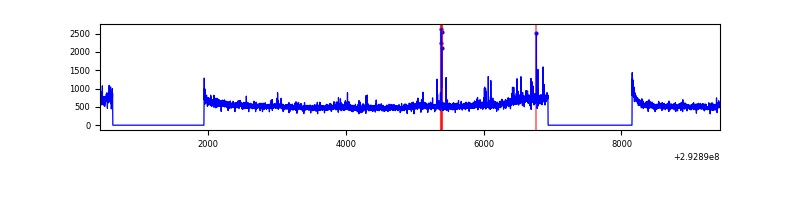 |
| D | 9001 | 6458 | 2 | 2 | 0.02% | 0.03% | 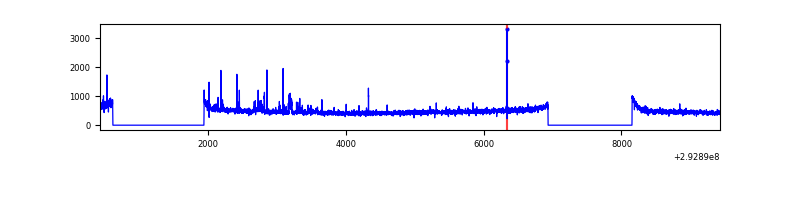 |
Top three noisy pixels from each quadrant. If the there are fewer than three noisy pixels in the level2.evt file, extra rows are filled as -1
| Pixel properties | Quadrant properties | ||||||
|---|---|---|---|---|---|---|---|
| Quadrant | DetID | PixID | Counts | Sigma | Mean | Median | Sigma |
| A | 13 | 170 | 76200 | 456.09 | 819 | 802 | 165.3 |
| A | 15 | 174 | 35072 | 207.3 | 819 | 802 | 165.3 |
| A | 11 | 29 | 12125 | 68.49 | 819 | 802 | 165.3 |
| B | 7 | 220 | 134154 | 845.1 | 829 | 810 | 157.8 |
| B | 3 | 112 | 39371 | 244.39 | 829 | 810 | 157.8 |
| B | 12 | 111 | 18222 | 110.35 | 829 | 810 | 157.8 |
| C | 3 | 233 | 245374 | 1300.84 | 805 | 816 | 188.0 |
| C | 14 | 238 | 125201 | 661.62 | 805 | 816 | 188.0 |
| C | 0 | 207 | 12028 | 59.64 | 805 | 816 | 188.0 |
| D | 1 | 52 | 84865 | 425.87 | 808 | 786 | 197.4 |
| D | 2 | 234 | 25688 | 126.13 | 808 | 786 | 197.4 |
| D | 11 | 176 | 10845 | 50.95 | 808 | 786 | 197.4 |
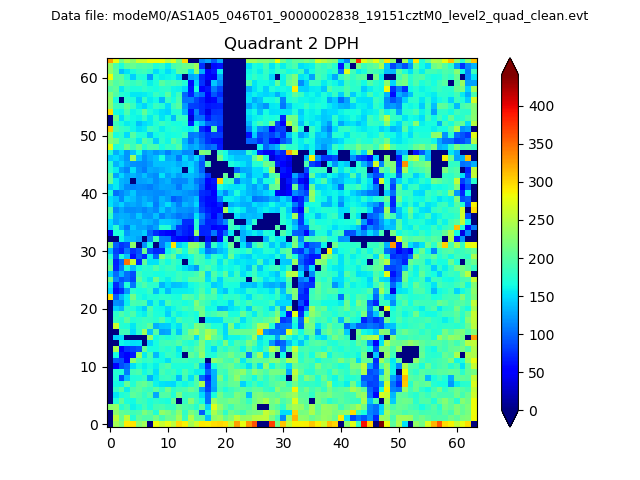
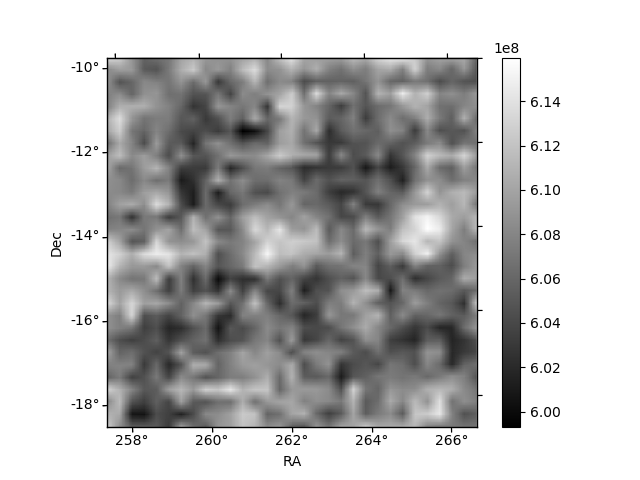
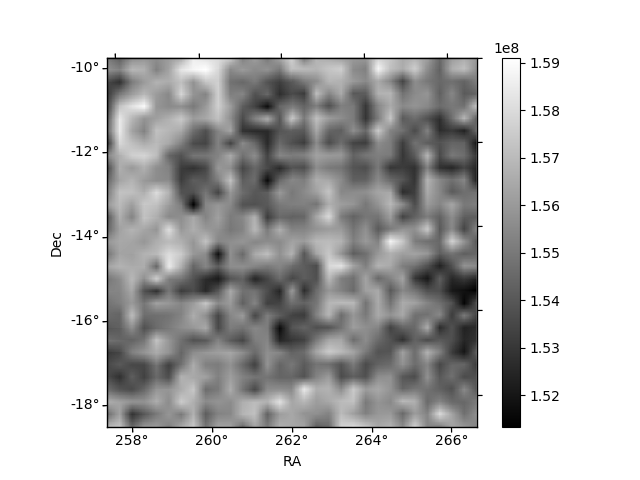
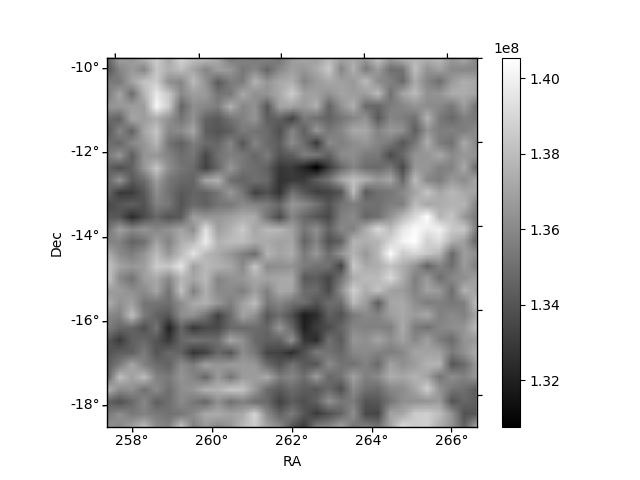
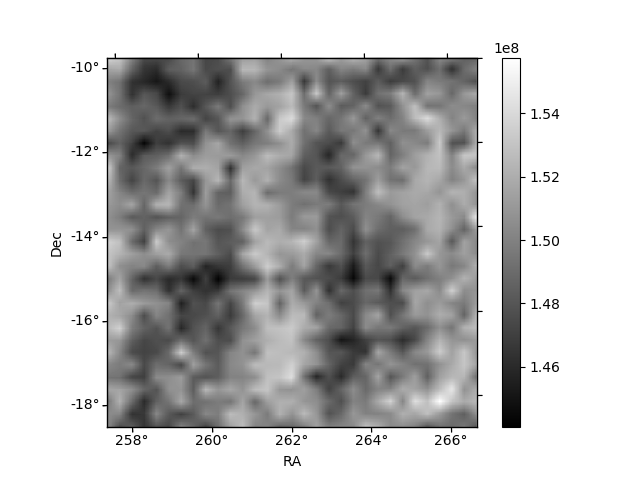
Histogram calculated using DETX and DETY for each event in the final _common_clean file
| Quadrant A | 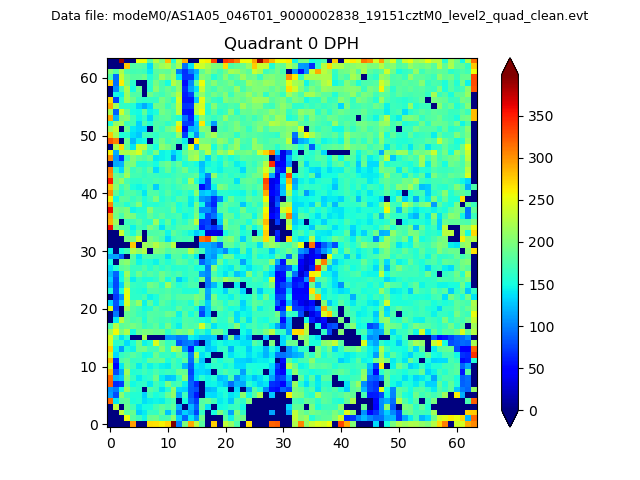 |
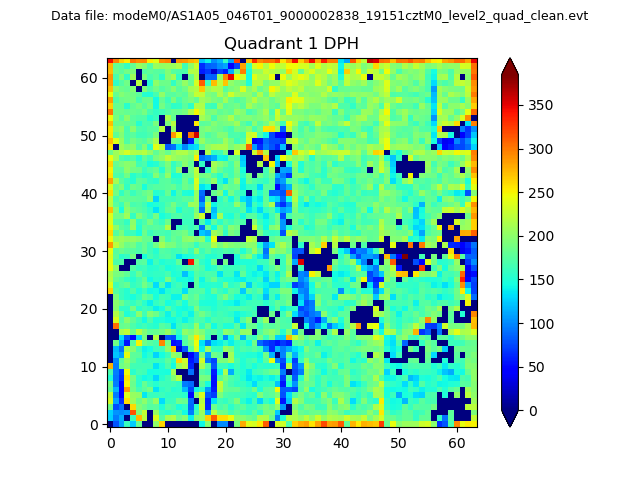 |
Quadrant B |
|---|---|---|---|
| Quadrant D | 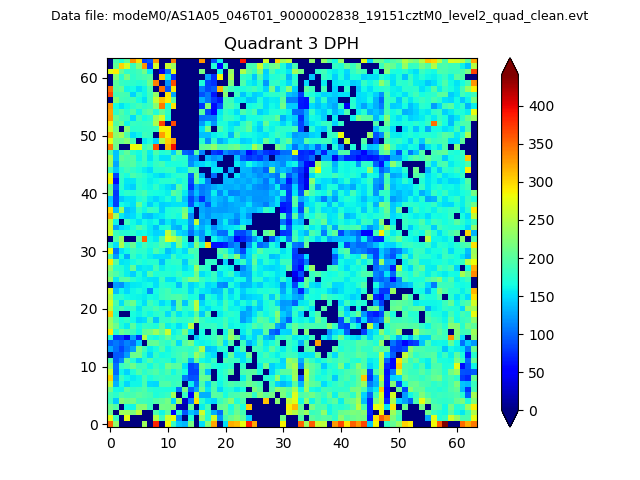 |
 |
Quadrant C |
| Plot type | Count rate plots | Images |
|---|---|---|
| Comparison with Poisson distribution Blue bars denote a histogram of data divided into 1 sec bins. Red curve is a Poisson curve with rate = median count rate of data. |
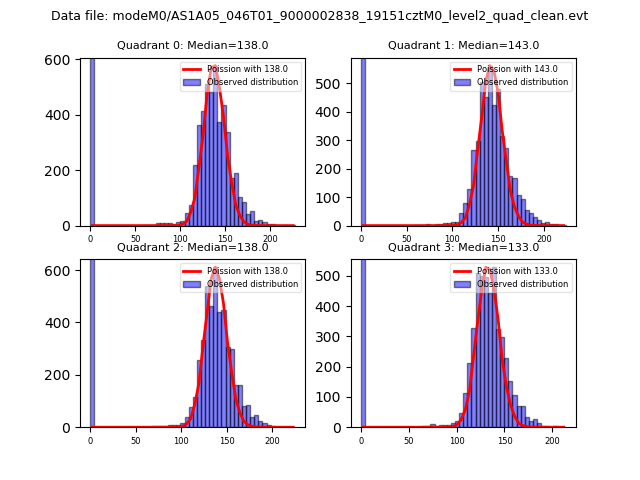 |
 |
| Quadrant-wise count rates Data is divided into 100 sec bins |
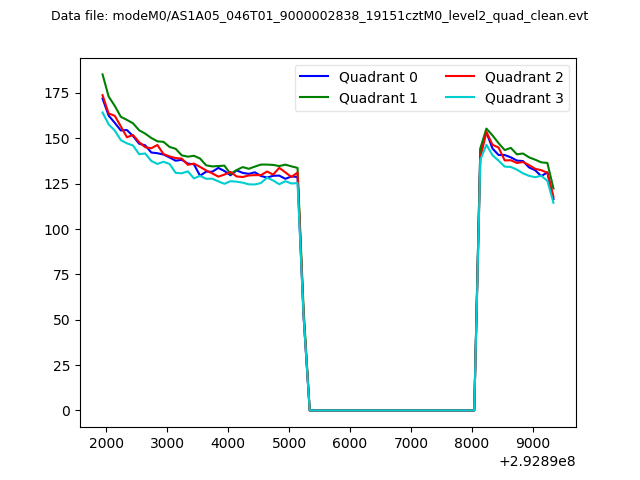 |
|
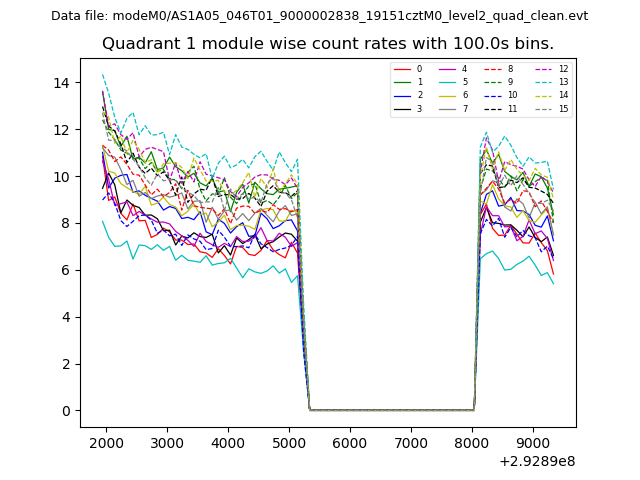
| Module-wise count rates for Quadrant A Data is divided into 100 sec bins |
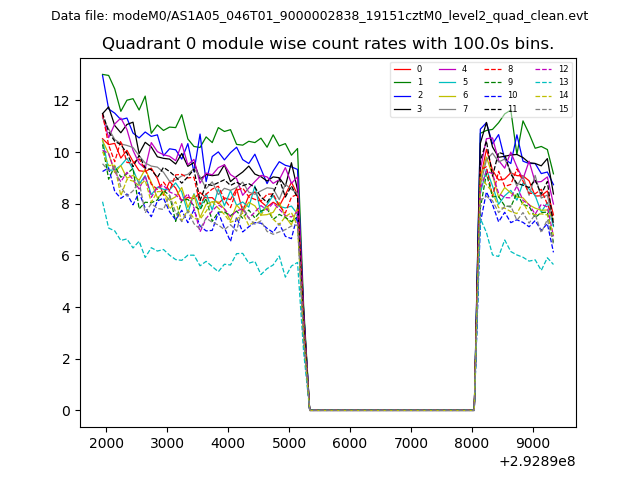 |
 |
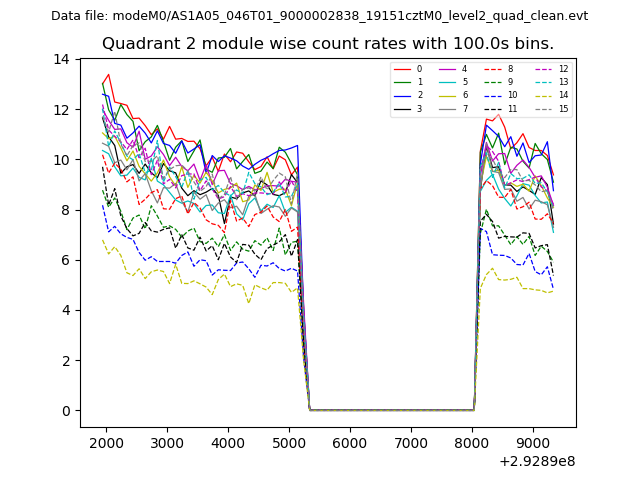
| Module-wise count rates for Quadrant B Data is divided into 100 sec bins |
 |
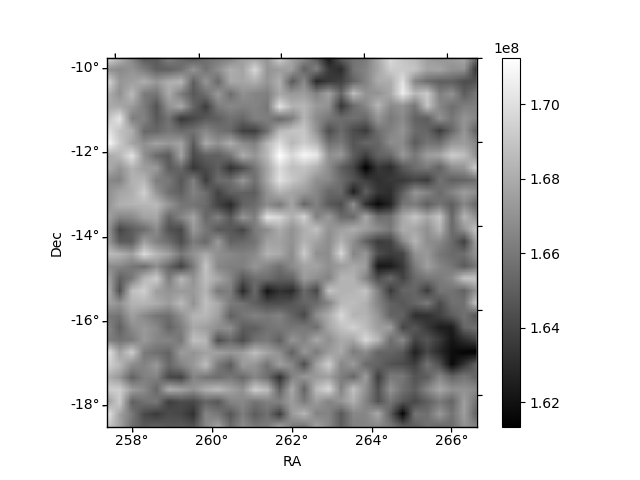 |
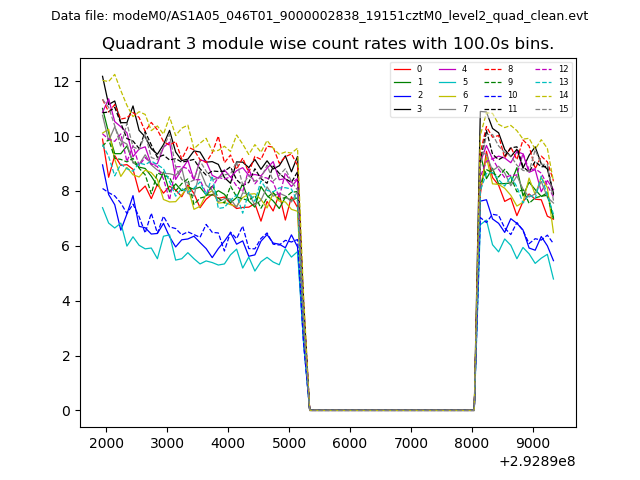
| Module-wise count rates for Quadrant C Data is divided into 100 sec bins |
 |
 |
| Module-wise count rates for Quadrant D Data is divided into 100 sec bins |
 |
 |
| Parameter | Plot |
|---|---|
| CZT HV Monitor | 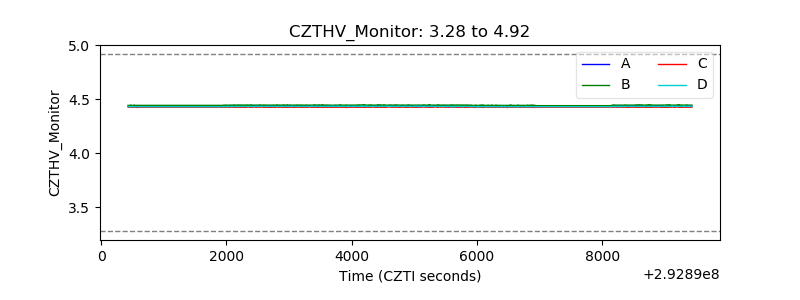 |
| D_VDD | 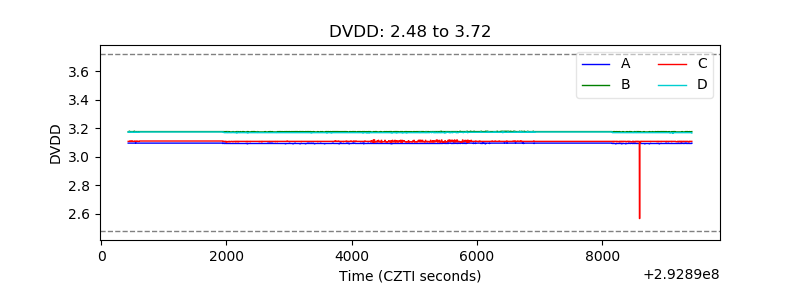 |
| Temperature 1 | 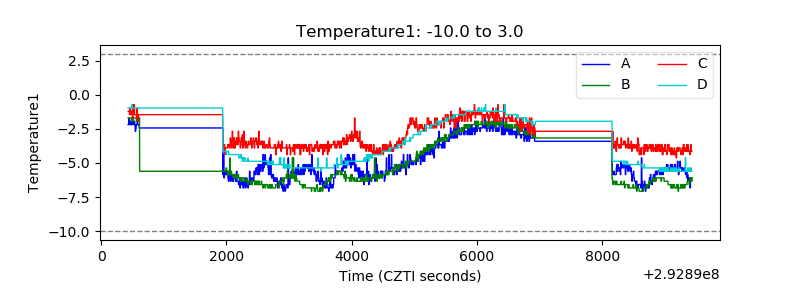 |
| Veto HV Monitor | 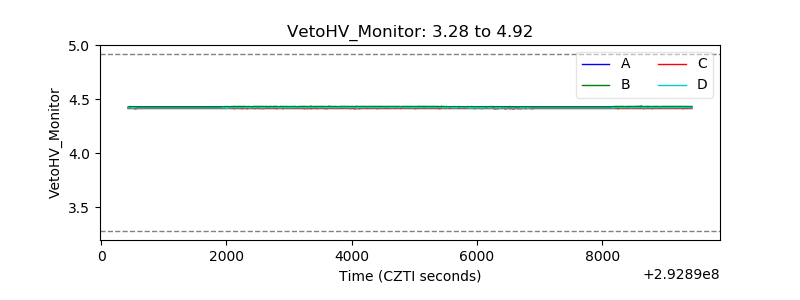 |
| Veto LLD | 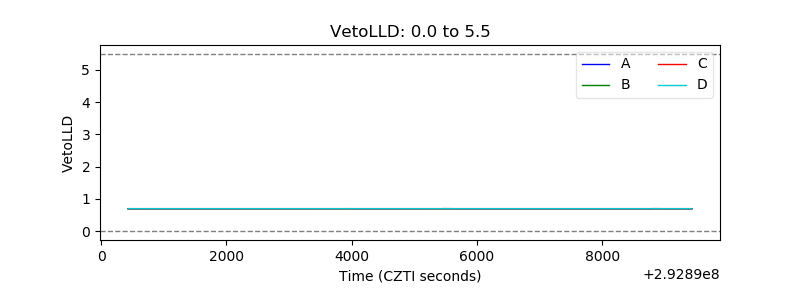 |
| Alpha Counter | 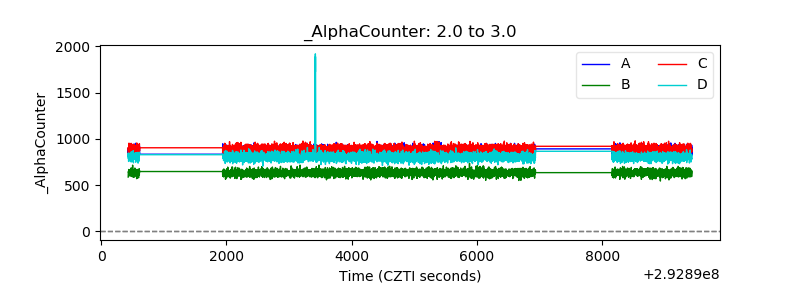 |
| _CPM_Rate | 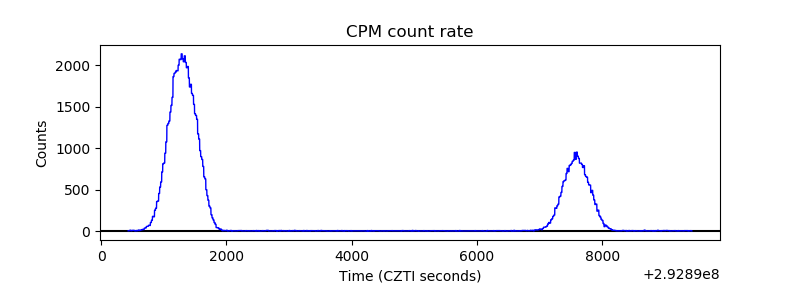 |
| CZT Counter |  |
| +2.5 Volts monitor |  |
| +5 Volts monitor | 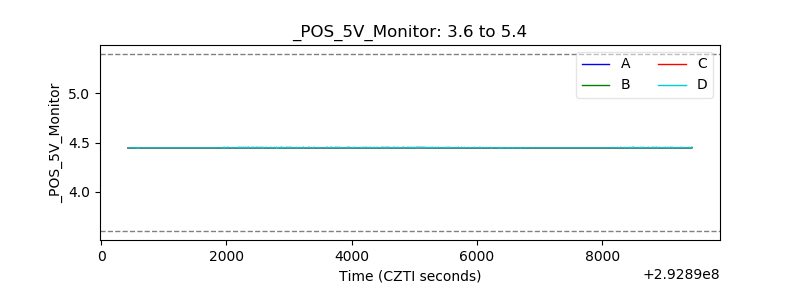 |
| _ROLL_ROT | 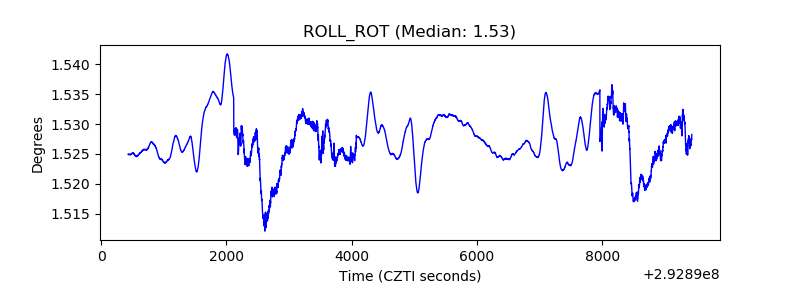 |
| _Roll_DEC | 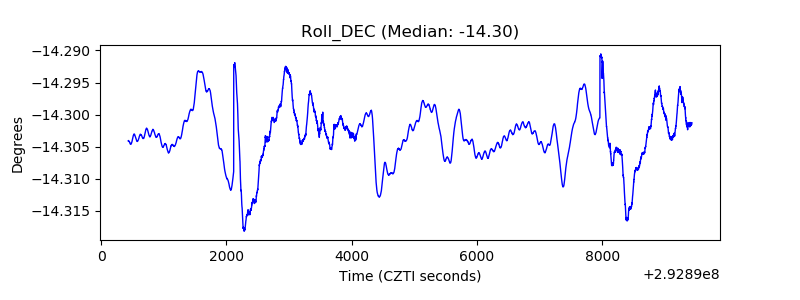 |
| _Roll_RA | 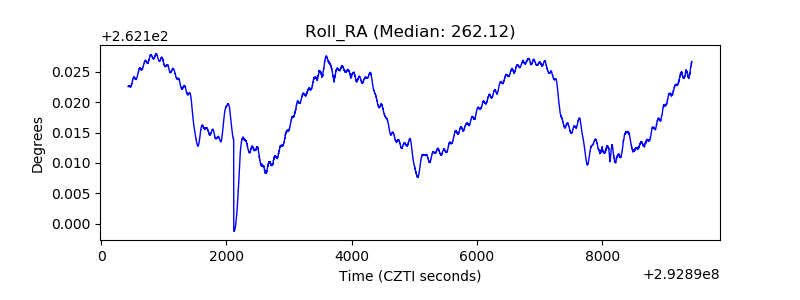 |
| Veto Counter | 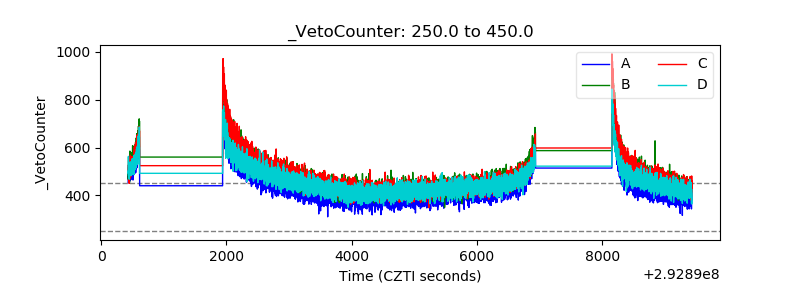 |