| Param | Original file | Final file |
|---|---|---|
| Filename | modeM0/AS1A05_046T01_9000002838_19154cztM0_level2.evt | modeM0/AS1A05_046T01_9000002838_19154cztM0_level2_quad_clean.evt |
| Size (bytes) | 257,224,320 | 33,056,640 |
| Size | 245.3 MB | 31.5 MB |
| Events in quadrant A | 1,685,215 | 186,540 |
| Events in quadrant B | 1,780,529 | 194,723 |
| Events in quadrant C | 2,324,211 | 177,477 |
| Events in quadrant D | 1,751,384 | 184,670 |
| Mode M0 | |||
|---|---|---|---|
| Quadrant | BADHDUFLAG | Total packets | Discarded packets |
| A | 0 | 10462 | 3075 |
| B | 0 | 10729 | 3154 |
| C | 0 | 13981 | 4548 |
| D | 0 | 10788 | 3105 |
| Mode SS | |||
|---|---|---|---|
| Quadrant | BADHDUFLAG | Total packets | Discarded packets |
| A | 0 | 104 | 28 |
| B | 0 | 104 | 26 |
| C | 0 | 104 | 32 |
| D | 0 | 104 | 36 |
| Mode M9 | |||
|---|---|---|---|
| Quadrant | BADHDUFLAG | Total packets | Discarded packets |
| A | 0 | 2 | 2 |
| B | 0 | 2 | 1 |
| C | 0 | 2 | 1 |
| D | 0 | 2 | 0 |
| Quadrant | Total seconds | Saturated seconds | Saturation percentage |
|---|---|---|---|
| A | 3664 | 19 | 0.518559% |
| B | 3648 | 28 | 0.767544% |
| C | 3528 | 66 | 1.870748% |
| D | 3652 | 18 | 0.492881% |
Noise dominated data is calculated using 1-second bins in cleaned event files. If a bin has >2000 counts, and if more than 50% of those come from <1% of pixels, then it is considered to be noise-dominated and hence unusable.
| Quadrant | # 1 sec bins | Bins with >0 counts | Bins with >2000 counts | High rate bins dominated by noise | Noise dominated (total time) | Noise dominated (detector-on time) | Marked lightcurve |
|---|---|---|---|---|---|---|---|
| A | 4909 | 4010 | 0 | 0 | 0.00% | 0.00% | 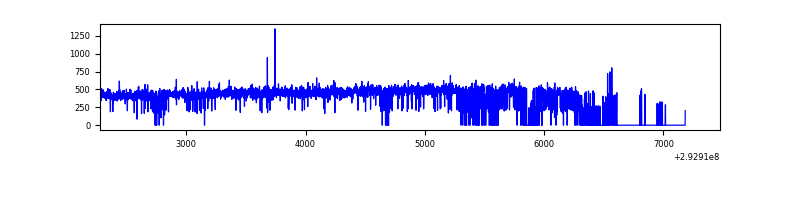 |
| B | 5148 | 4053 | 2 | 2 | 0.04% | 0.05% | 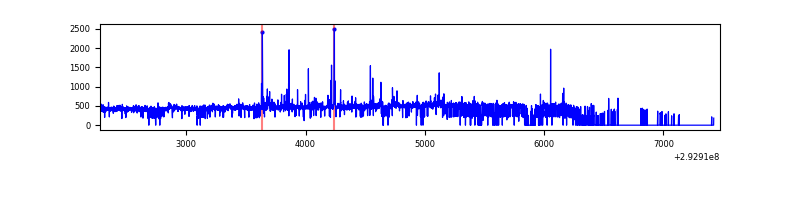 |
| C | 4848 | 3938 | 1 | 1 | 0.02% | 0.03% | 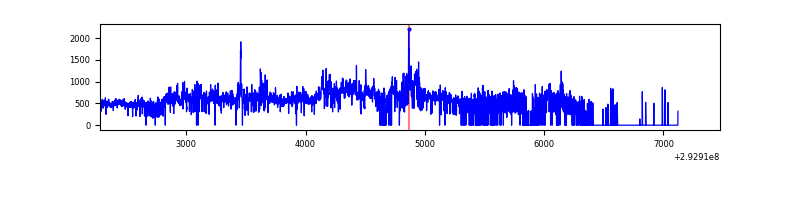 |
| D | 5199 | 4034 | 1 | 1 | 0.02% | 0.02% | 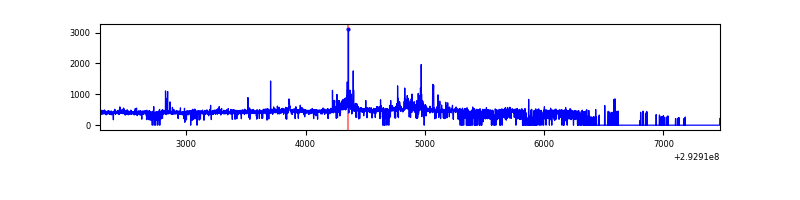 |
Top three noisy pixels from each quadrant. If the there are fewer than three noisy pixels in the level2.evt file, extra rows are filled as -1
| Pixel properties | Quadrant properties | ||||||
|---|---|---|---|---|---|---|---|
| Quadrant | DetID | PixID | Counts | Sigma | Mean | Median | Sigma |
| A | 11 | 29 | 9545 | 101.18 | 434 | 424 | 90.1 |
| A | 13 | 254 | 4680 | 47.21 | 434 | 424 | 90.1 |
| A | 0 | 226 | 3861 | 38.13 | 434 | 424 | 90.1 |
| B | 7 | 220 | 24023 | 278.74 | 431 | 421 | 84.7 |
| B | 3 | 112 | 21870 | 253.31 | 431 | 421 | 84.7 |
| B | 6 | 36 | 14964 | 171.75 | 431 | 421 | 84.7 |
| C | 3 | 233 | 696320 | 7272.2 | 401 | 402 | 95.7 |
| C | 14 | 238 | 62180 | 645.57 | 401 | 402 | 95.7 |
| C | 13 | 61 | 2917 | 26.28 | 401 | 402 | 95.7 |
| D | 1 | 52 | 153142 | 1469.41 | 423 | 411 | 103.9 |
| D | 2 | 234 | 14472 | 135.28 | 423 | 411 | 103.9 |
| D | 14 | 226 | 4188 | 36.34 | 423 | 411 | 103.9 |
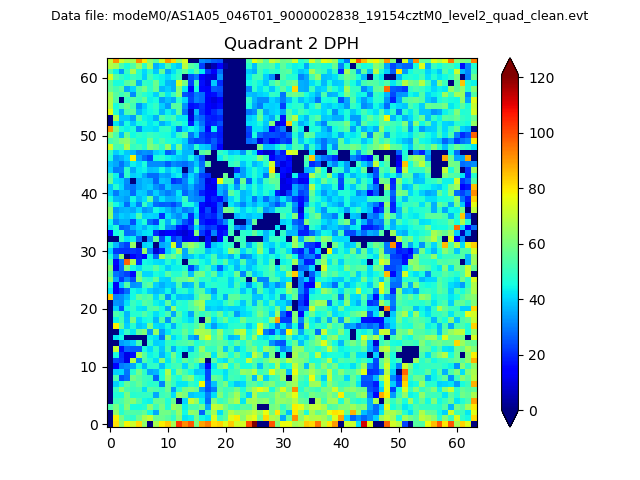
Histogram calculated using DETX and DETY for each event in the final _common_clean file
| Quadrant A | 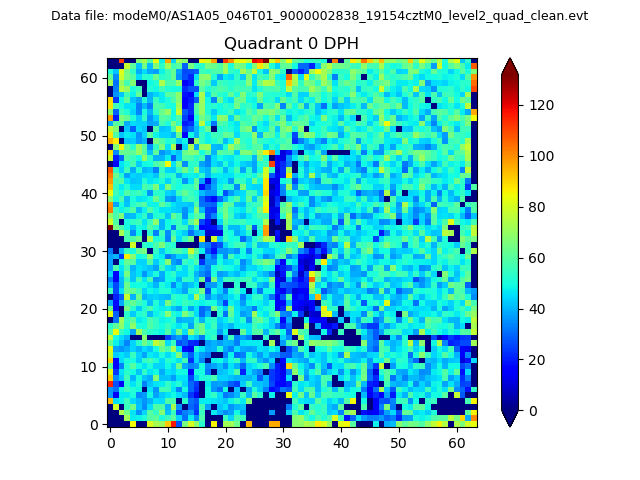 |
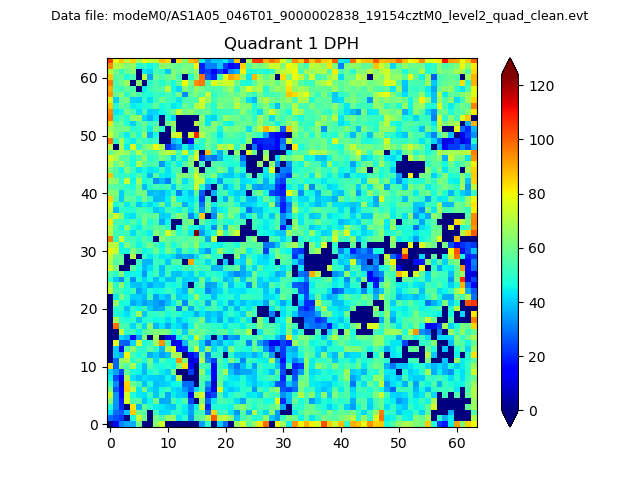 |
Quadrant B |
|---|---|---|---|
| Quadrant D | 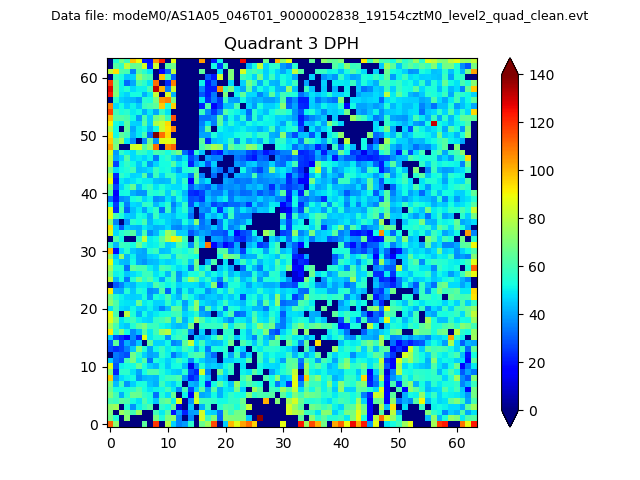 |
 |
Quadrant C |
| Plot type | Count rate plots | Images |
|---|---|---|
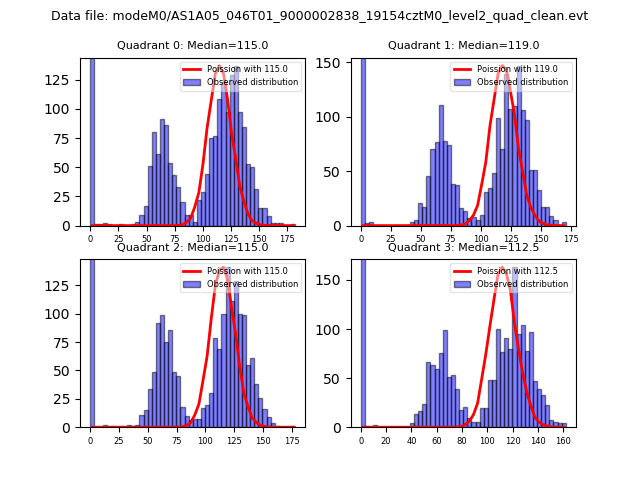
| Comparison with Poisson distribution Blue bars denote a histogram of data divided into 1 sec bins. Red curve is a Poisson curve with rate = median count rate of data. |
 |
 |
| Quadrant-wise count rates Data is divided into 100 sec bins |
 |
|
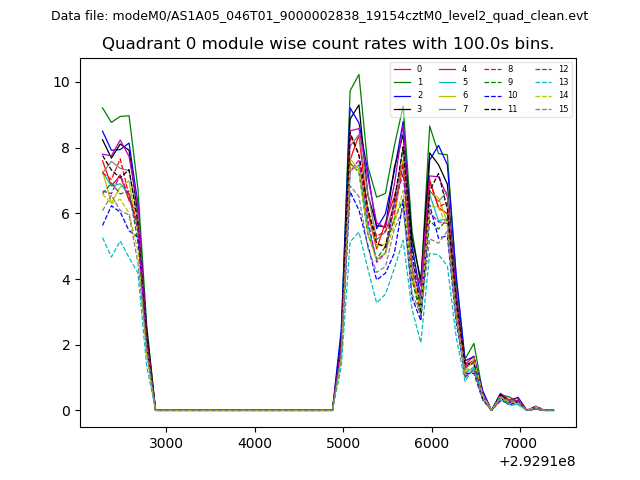
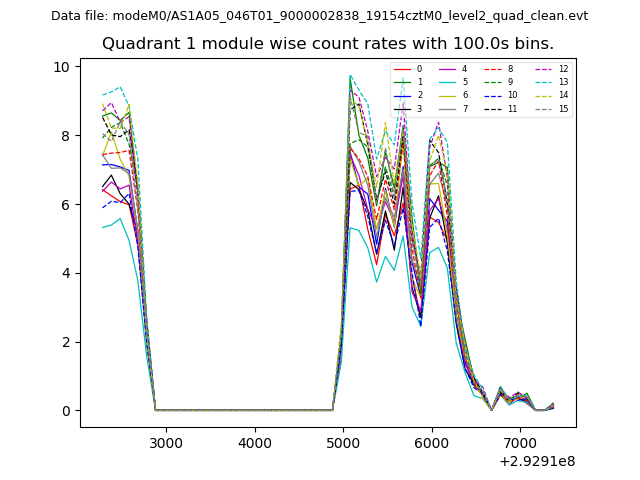
| Module-wise count rates for Quadrant A Data is divided into 100 sec bins |
 |
 |
| Module-wise count rates for Quadrant B Data is divided into 100 sec bins |
 |
 |
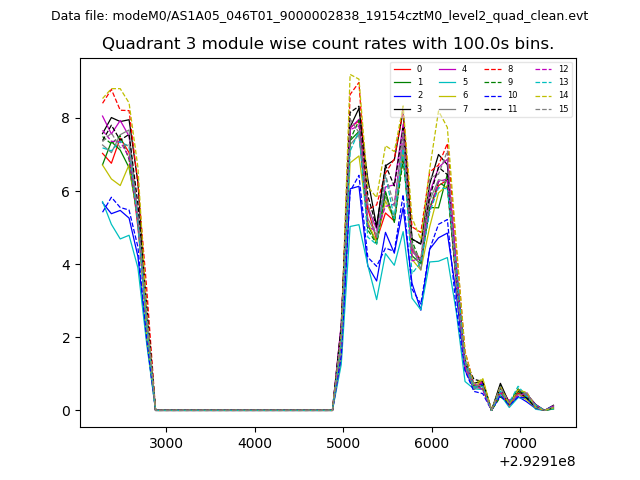
| Module-wise count rates for Quadrant C Data is divided into 100 sec bins |
 |
 |
| Module-wise count rates for Quadrant D Data is divided into 100 sec bins |
 |
 |
| Parameter | Plot |
|---|---|
| CZT HV Monitor | 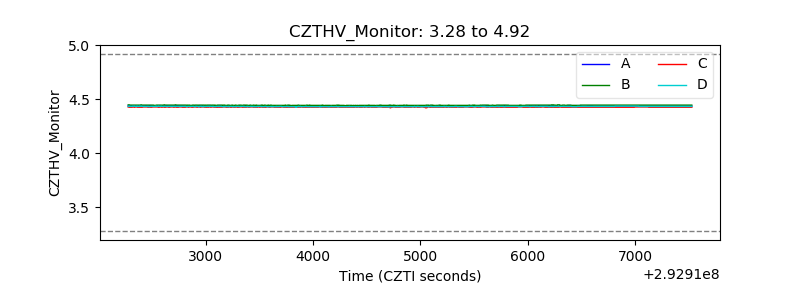 |
| D_VDD | 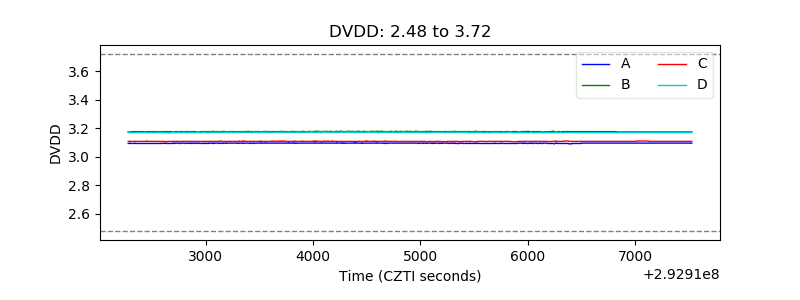 |
| Temperature 1 | 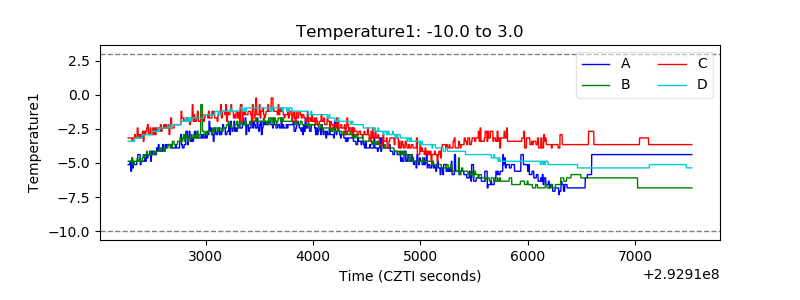 |
| Veto HV Monitor | 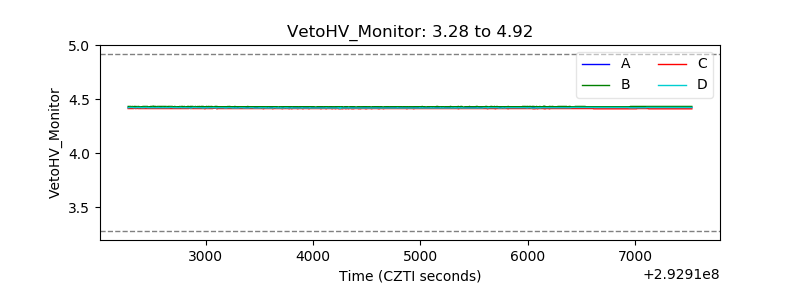 |
| Veto LLD | 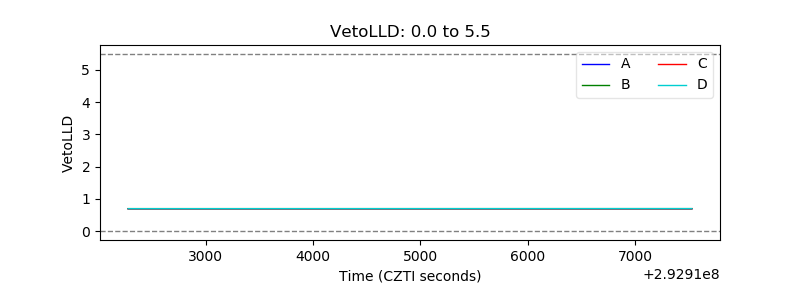 |
| Alpha Counter | 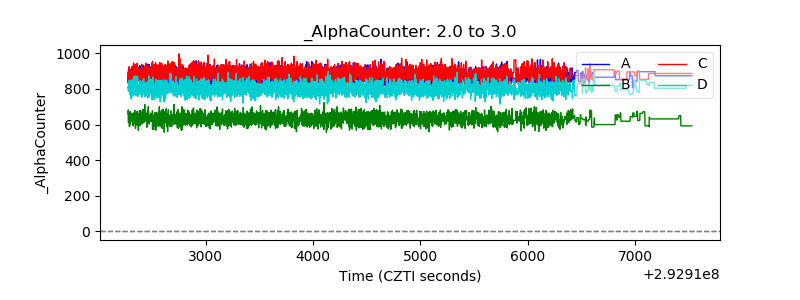 |
| _CPM_Rate | 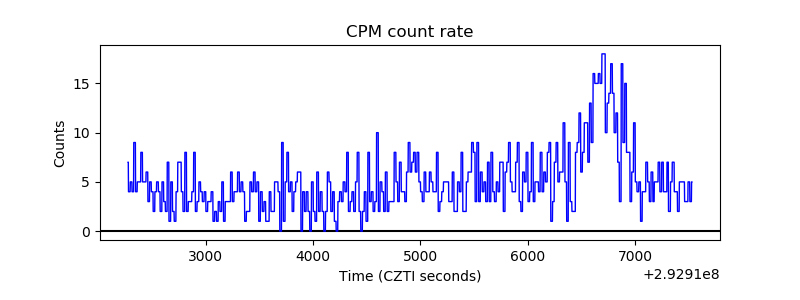 |
| CZT Counter | 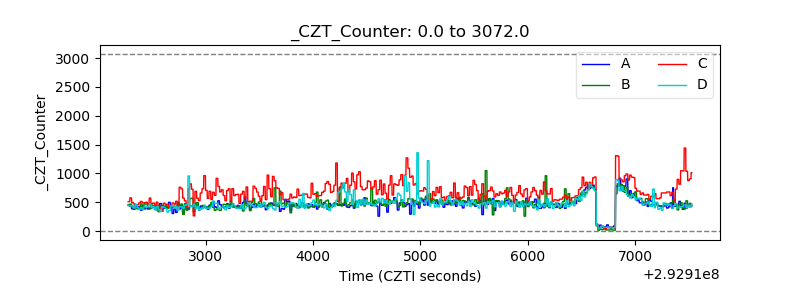 |
| +2.5 Volts monitor | 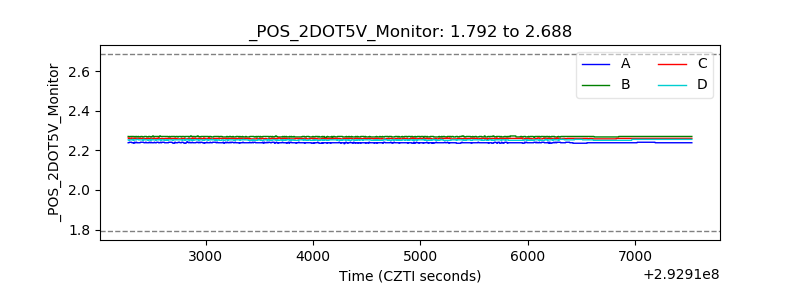 |
| +5 Volts monitor | 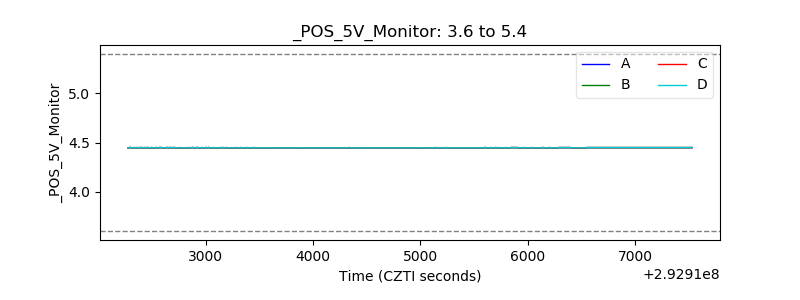 |
| _ROLL_ROT | 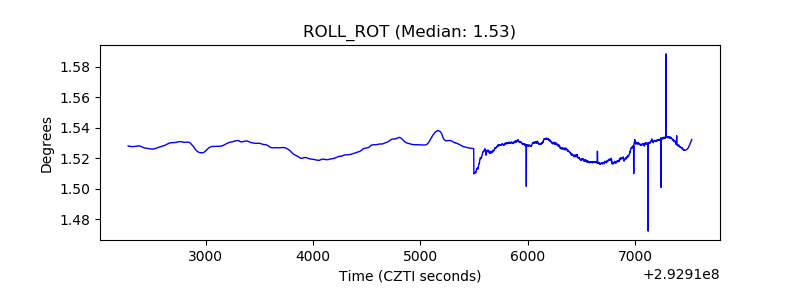 |
| _Roll_DEC | 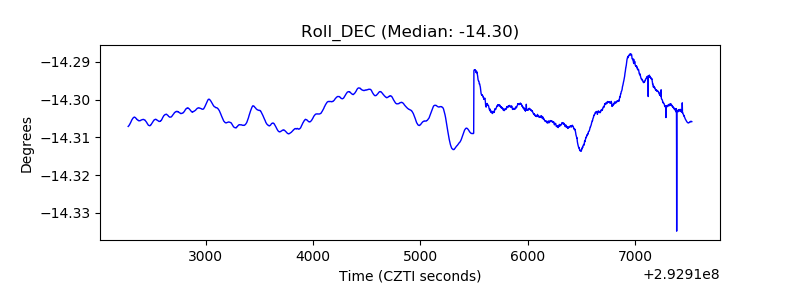 |
| _Roll_RA | 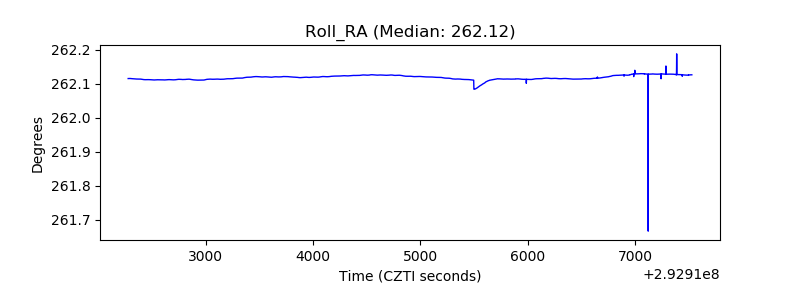 |
| Veto Counter | 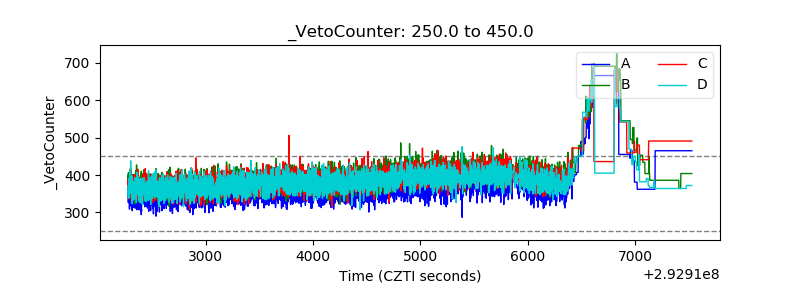 |