| Param | Original file | Final file |
|---|---|---|
| Filename | modeM0/AS1A05_046T01_9000002838_19158cztM0_level2.evt | modeM0/AS1A05_046T01_9000002838_19158cztM0_level2_quad_clean.evt |
| Size (bytes) | 1,358,611,200 | 205,104,960 |
| Size | 1.3 GB | 195.6 MB |
| Events in quadrant A | 9,082,112 | 1,235,814 |
| Events in quadrant B | 9,298,106 | 1,273,946 |
| Events in quadrant C | 13,054,699 | 1,228,051 |
| Events in quadrant D | 8,478,505 | 1,216,315 |
| Mode M0 | |||
|---|---|---|---|
| Quadrant | BADHDUFLAG | Total packets | Discarded packets |
| A | 0 | 38996 | 3 |
| B | 0 | 39189 | 3 |
| C | 0 | 51897 | 3 |
| D | 0 | 37983 | 3 |
| Mode SS | |||
|---|---|---|---|
| Quadrant | BADHDUFLAG | Total packets | Discarded packets |
| A | 0 | 370 | 0 |
| B | 0 | 370 | 0 |
| C | 0 | 370 | 0 |
| D | 0 | 370 | 0 |
| Mode M9 | |||
|---|---|---|---|
| Quadrant | BADHDUFLAG | Total packets | Discarded packets |
| A | 0 | 20 | 0 |
| B | 0 | 20 | 0 |
| C | 0 | 20 | 0 |
| D | 0 | 20 | 0 |
| Quadrant | Total seconds | Saturated seconds | Saturation percentage |
|---|---|---|---|
| A | 18249 | 417 | 2.285057% |
| B | 18249 | 293 | 1.605567% |
| C | 18249 | 503 | 2.756315% |
| D | 18249 | 181 | 0.991835% |
Noise dominated data is calculated using 1-second bins in cleaned event files. If a bin has >2000 counts, and if more than 50% of those come from <1% of pixels, then it is considered to be noise-dominated and hence unusable.
| Quadrant | # 1 sec bins | Bins with >0 counts | Bins with >2000 counts | High rate bins dominated by noise | Noise dominated (total time) | Noise dominated (detector-on time) | Marked lightcurve |
|---|---|---|---|---|---|---|---|
| A | 20219 | 18250 | 199 | 199 | 0.98% | 1.09% | 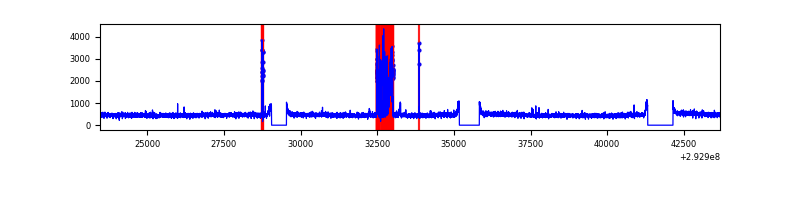 |
| B | 20219 | 18251 | 72 | 72 | 0.36% | 0.39% | 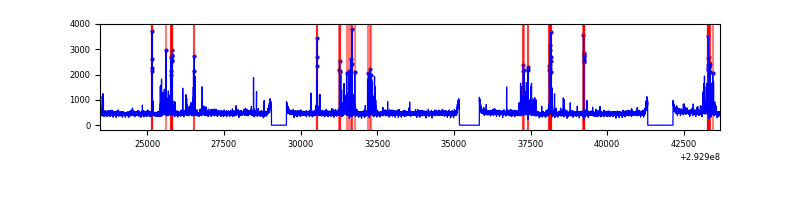 |
| C | 20219 | 18250 | 33 | 33 | 0.16% | 0.18% | 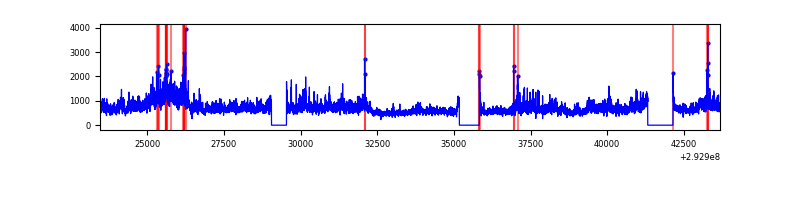 |
| D | 20219 | 18251 | 31 | 31 | 0.15% | 0.17% | 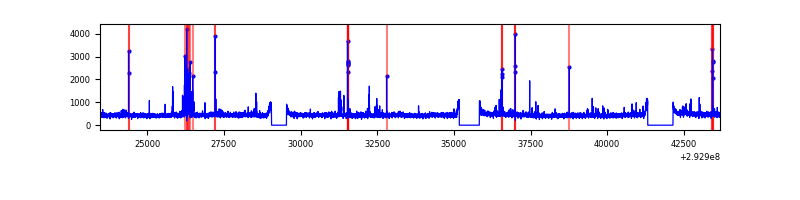 |
Top three noisy pixels from each quadrant. If the there are fewer than three noisy pixels in the level2.evt file, extra rows are filled as -1
| Pixel properties | Quadrant properties | ||||||
|---|---|---|---|---|---|---|---|
| Quadrant | DetID | PixID | Counts | Sigma | Mean | Median | Sigma |
| A | 15 | 174 | 666235 | 1501.07 | 2180 | 2133 | 442.4 |
| A | 13 | 254 | 21264 | 43.24 | 2180 | 2133 | 442.4 |
| A | 0 | 226 | 18552 | 37.11 | 2180 | 2133 | 442.4 |
| B | 7 | 220 | 497841 | 1180.07 | 2182 | 2125 | 420.1 |
| B | 0 | 197 | 66889 | 154.17 | 2182 | 2125 | 420.1 |
| B | 12 | 111 | 51055 | 116.48 | 2182 | 2125 | 420.1 |
| C | 3 | 233 | 4479897 | 9065.55 | 2104 | 2116 | 493.9 |
| C | 14 | 238 | 322593 | 648.83 | 2104 | 2116 | 493.9 |
| C | 0 | 207 | 39300 | 75.28 | 2104 | 2116 | 493.9 |
| D | 11 | 176 | 197164 | 374.38 | 2147 | 2084 | 521.1 |
| D | 1 | 52 | 116608 | 219.78 | 2147 | 2084 | 521.1 |
| D | 2 | 234 | 80026 | 149.58 | 2147 | 2084 | 521.1 |
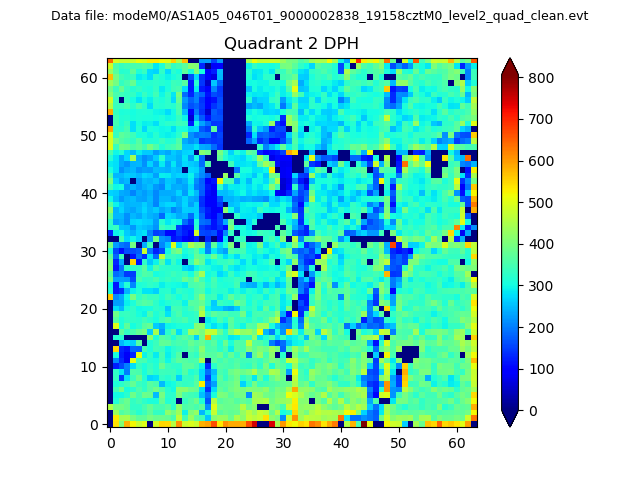
Histogram calculated using DETX and DETY for each event in the final _common_clean file
| Quadrant A | 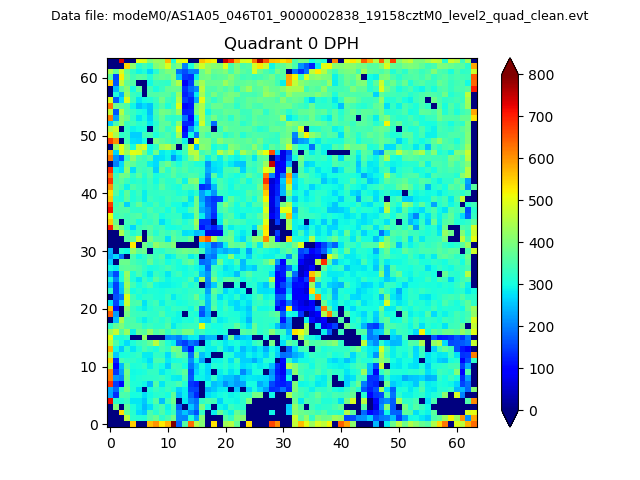 |
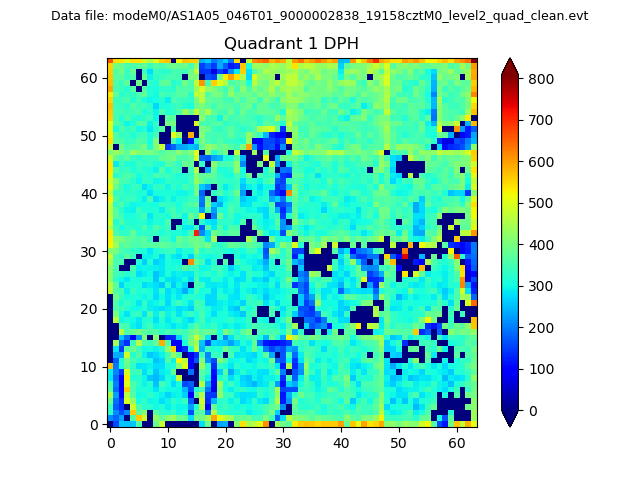 |
Quadrant B |
|---|---|---|---|
| Quadrant D | 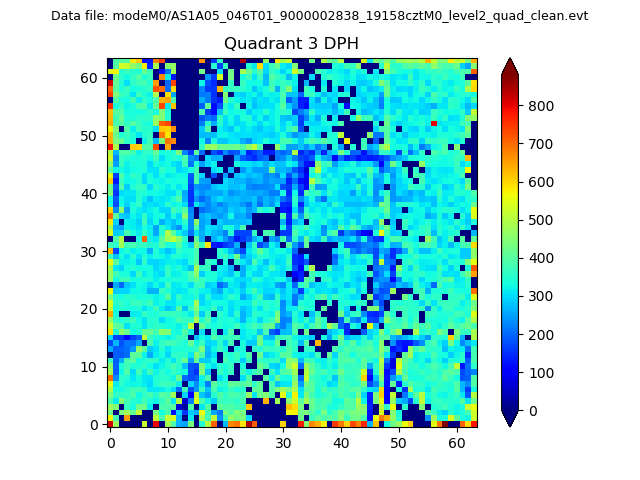 |
 |
Quadrant C |
| Plot type | Count rate plots | Images |
|---|---|---|
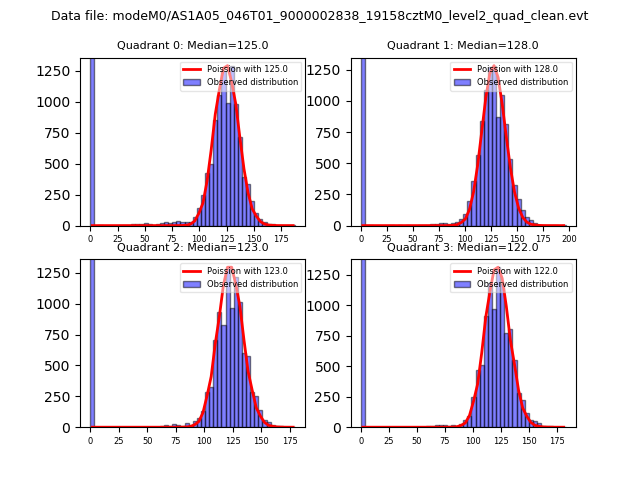
| Comparison with Poisson distribution Blue bars denote a histogram of data divided into 1 sec bins. Red curve is a Poisson curve with rate = median count rate of data. |
 |
 |
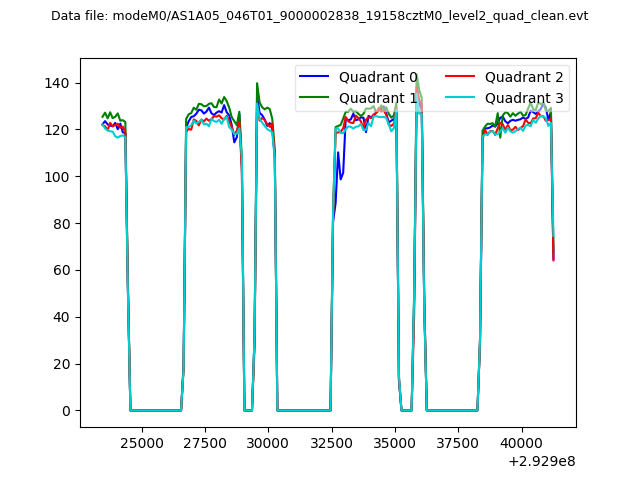
| Quadrant-wise count rates Data is divided into 100 sec bins |
 |
|
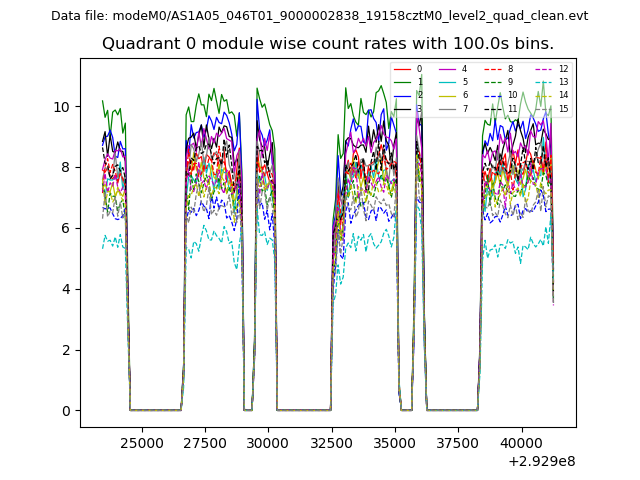
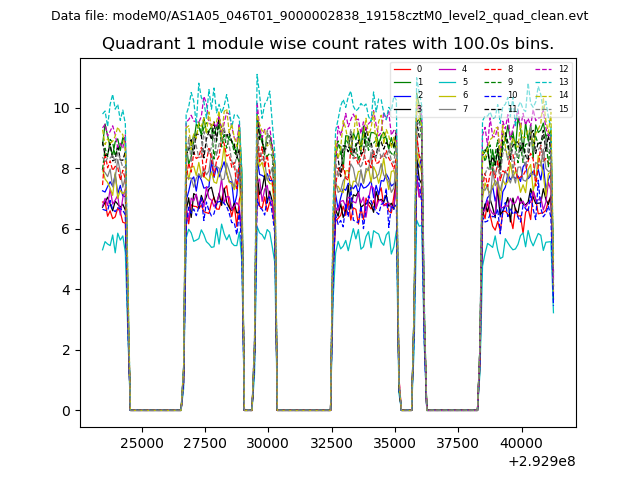
| Module-wise count rates for Quadrant A Data is divided into 100 sec bins |
 |
 |
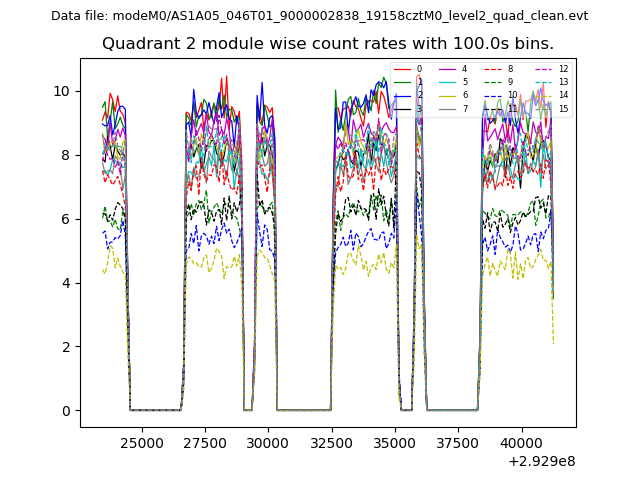
| Module-wise count rates for Quadrant B Data is divided into 100 sec bins |
 |
 |
| Module-wise count rates for Quadrant C Data is divided into 100 sec bins |
 |
 |
| Module-wise count rates for Quadrant D Data is divided into 100 sec bins |
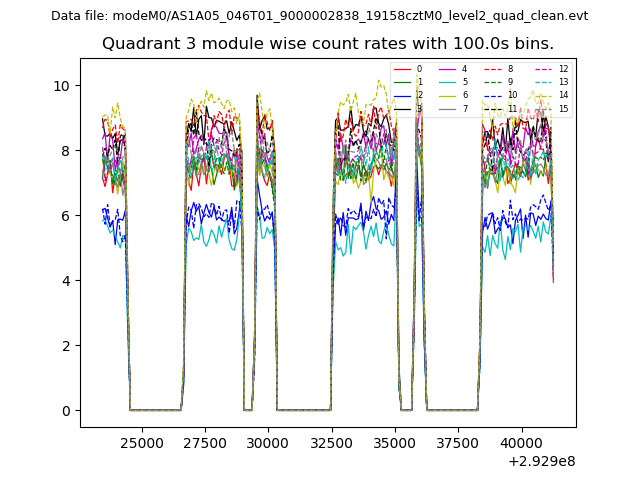 |
 |
| Parameter | Plot |
|---|---|
| CZT HV Monitor | 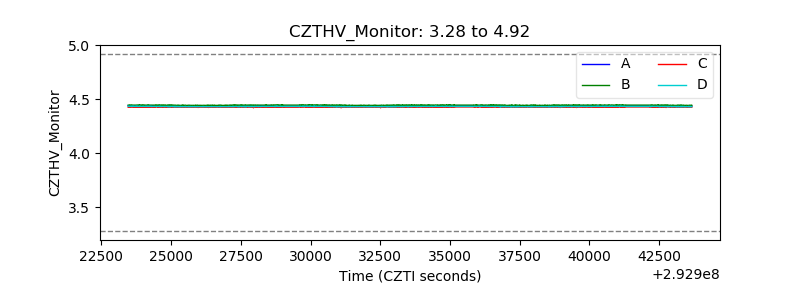 |
| D_VDD | 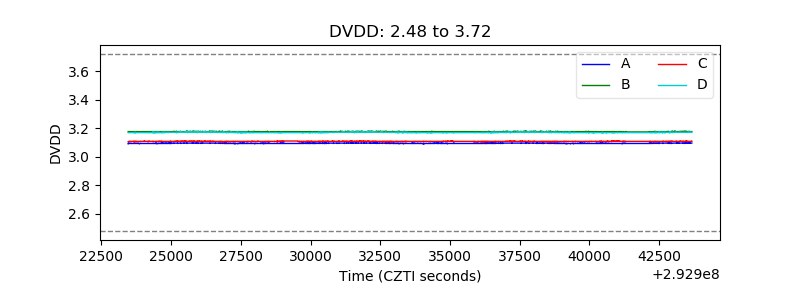 |
| Temperature 1 | 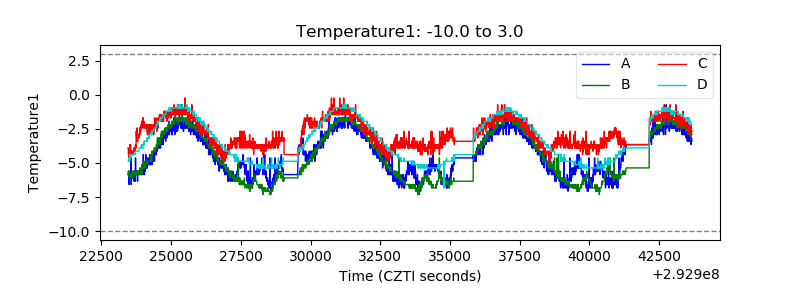 |
| Veto HV Monitor | 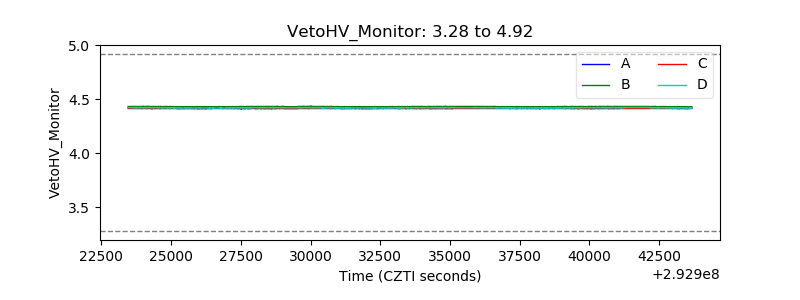 |
| Veto LLD | 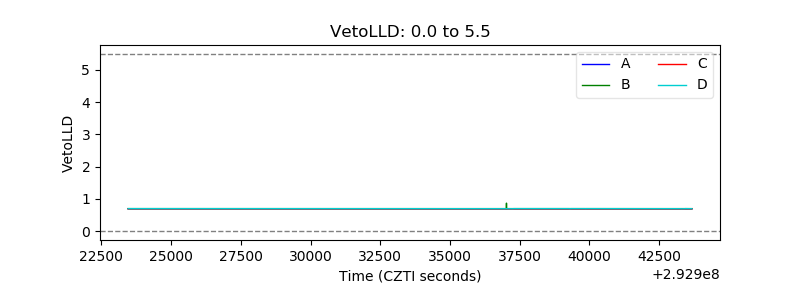 |
| Alpha Counter | 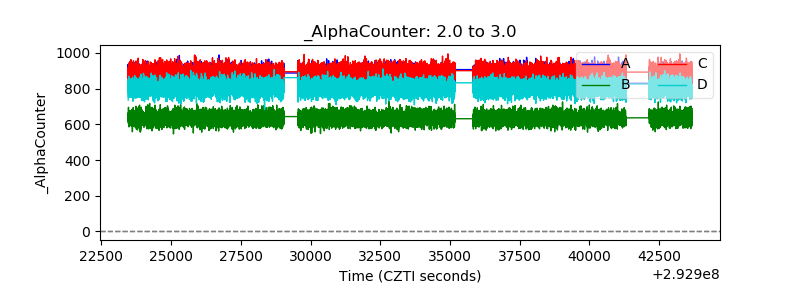 |
| _CPM_Rate | 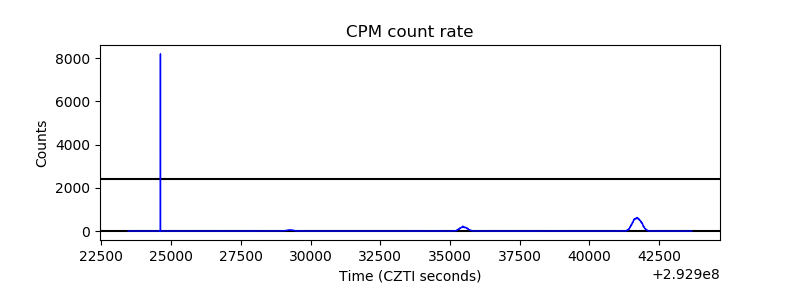 |
| CZT Counter | 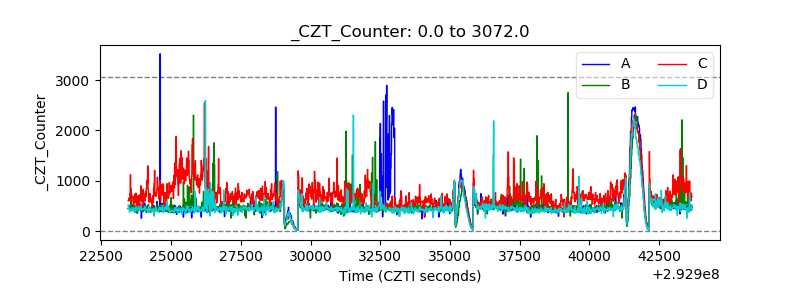 |
| +2.5 Volts monitor |  |
| +5 Volts monitor | 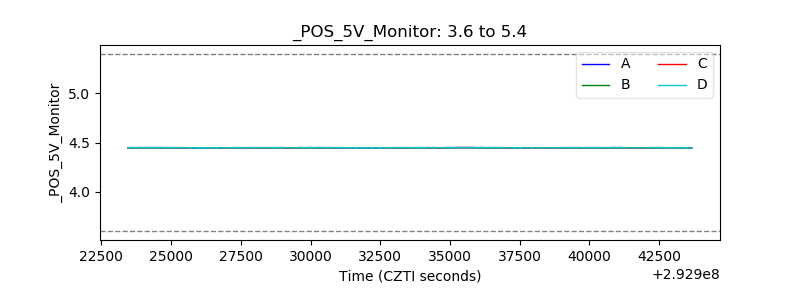 |
| _ROLL_ROT | 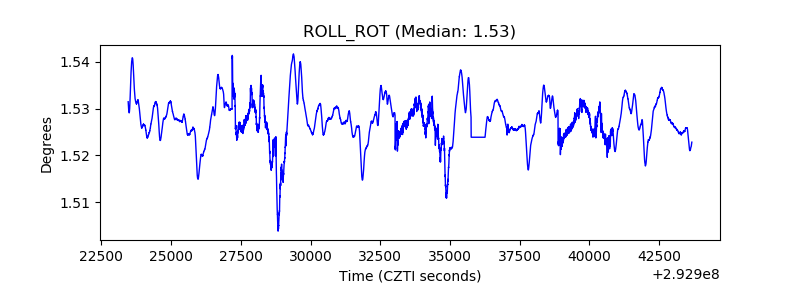 |
| _Roll_DEC | 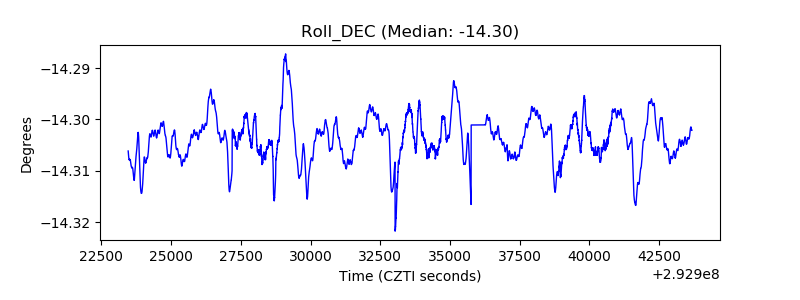 |
| _Roll_RA | 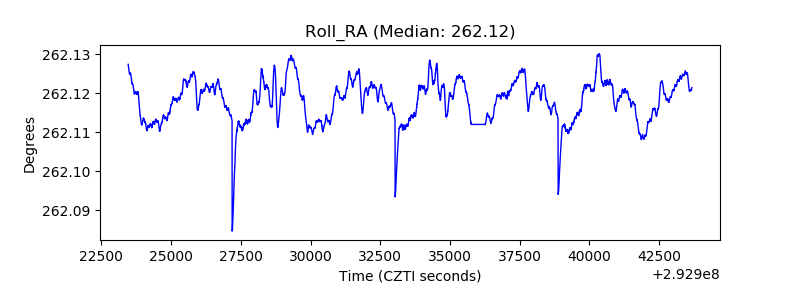 |
| Veto Counter | 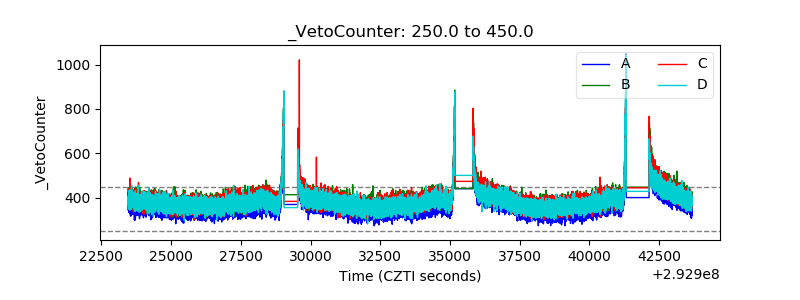 |