| Param | Original file | Final file |
|---|---|---|
| Filename | modeM0/AS1A05_046T01_9000002838_19159cztM0_level2.evt | modeM0/AS1A05_046T01_9000002838_19159cztM0_level2_quad_clean.evt |
| Size (bytes) | 2,143,327,680 | 331,050,240 |
| Size | 2.0 GB | 315.7 MB |
| Events in quadrant A | 13,967,757 | 2,016,910 |
| Events in quadrant B | 14,354,973 | 2,081,278 |
| Events in quadrant C | 21,353,589 | 1,997,527 |
| Events in quadrant D | 13,322,333 | 1,981,444 |
| Mode M0 | |||
|---|---|---|---|
| Quadrant | BADHDUFLAG | Total packets | Discarded packets |
| A | 0 | 60149 | 4 |
| B | 0 | 60759 | 4 |
| C | 0 | 83863 | 4 |
| D | 0 | 59264 | 4 |
| Mode SS | |||
|---|---|---|---|
| Quadrant | BADHDUFLAG | Total packets | Discarded packets |
| A | 0 | 576 | 0 |
| B | 0 | 576 | 0 |
| C | 0 | 576 | 0 |
| D | 0 | 576 | 0 |
| Mode M9 | |||
|---|---|---|---|
| Quadrant | BADHDUFLAG | Total packets | Discarded packets |
| A | 0 | 22 | 0 |
| B | 0 | 22 | 0 |
| C | 0 | 22 | 0 |
| D | 0 | 22 | 0 |
| Quadrant | Total seconds | Saturated seconds | Saturation percentage |
|---|---|---|---|
| A | 28350 | 691 | 2.437390% |
| B | 28350 | 514 | 1.813051% |
| C | 28352 | 1088 | 3.837472% |
| D | 28352 | 366 | 1.290914% |
Noise dominated data is calculated using 1-second bins in cleaned event files. If a bin has >2000 counts, and if more than 50% of those come from <1% of pixels, then it is considered to be noise-dominated and hence unusable.
| Quadrant | # 1 sec bins | Bins with >0 counts | Bins with >2000 counts | High rate bins dominated by noise | Noise dominated (total time) | Noise dominated (detector-on time) | Marked lightcurve |
|---|---|---|---|---|---|---|---|
| A | 37622 | 28354 | 230 | 230 | 0.61% | 0.81% | 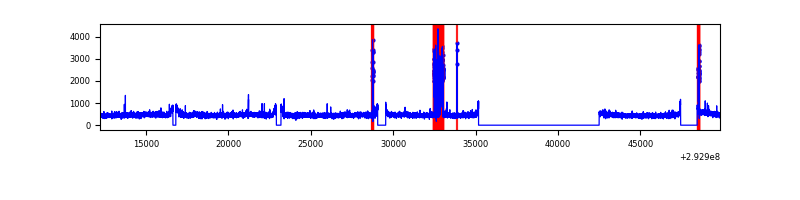 |
| B | 37622 | 28355 | 59 | 59 | 0.16% | 0.21% | 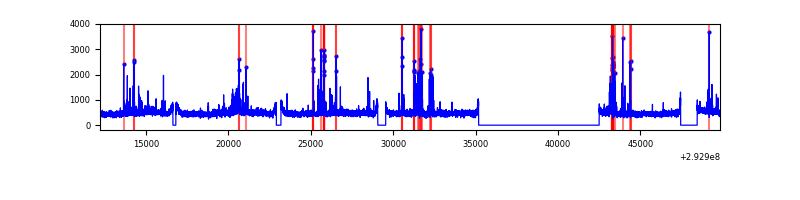 |
| C | 37623 | 28355 | 95 | 95 | 0.25% | 0.34% | 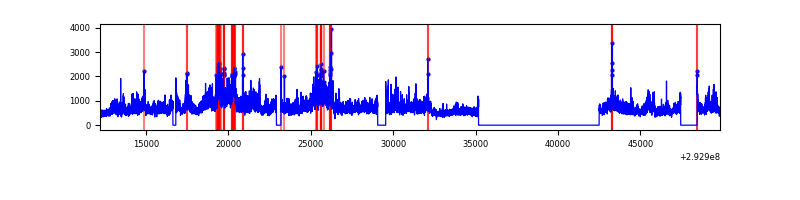 |
| D | 37623 | 28357 | 41 | 41 | 0.11% | 0.14% | 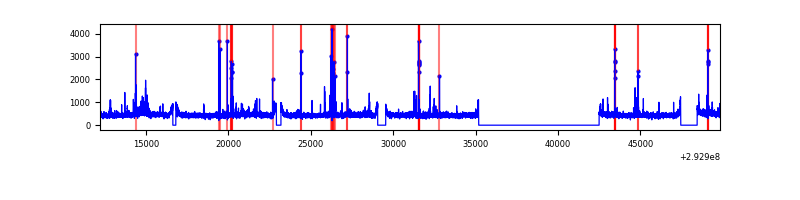 |
Top three noisy pixels from each quadrant. If the there are fewer than three noisy pixels in the level2.evt file, extra rows are filled as -1
| Pixel properties | Quadrant properties | ||||||
|---|---|---|---|---|---|---|---|
| Quadrant | DetID | PixID | Counts | Sigma | Mean | Median | Sigma |
| A | 15 | 174 | 776260 | 1120.98 | 3405 | 3324 | 689.5 |
| A | 13 | 254 | 35087 | 46.06 | 3405 | 3324 | 689.5 |
| A | 0 | 226 | 29462 | 37.91 | 3405 | 3324 | 689.5 |
| B | 7 | 220 | 450725 | 684.62 | 3416 | 3324 | 653.5 |
| B | 3 | 64 | 156237 | 233.99 | 3416 | 3324 | 653.5 |
| B | 6 | 36 | 109986 | 163.22 | 3416 | 3324 | 653.5 |
| C | 3 | 233 | 7966403 | 10284.96 | 3287 | 3302 | 774.2 |
| C | 14 | 238 | 502411 | 644.64 | 3287 | 3302 | 774.2 |
| C | 0 | 207 | 54287 | 65.85 | 3287 | 3302 | 774.2 |
| D | 1 | 52 | 336817 | 409.78 | 3357 | 3262 | 814.0 |
| D | 11 | 176 | 269788 | 327.43 | 3357 | 3262 | 814.0 |
| D | 2 | 234 | 120402 | 143.91 | 3357 | 3262 | 814.0 |
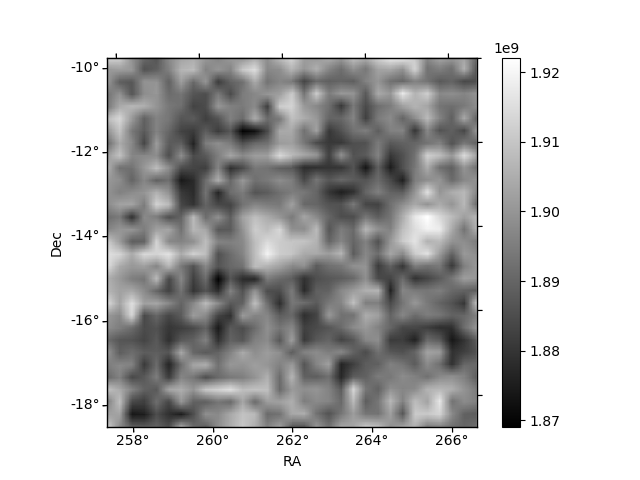
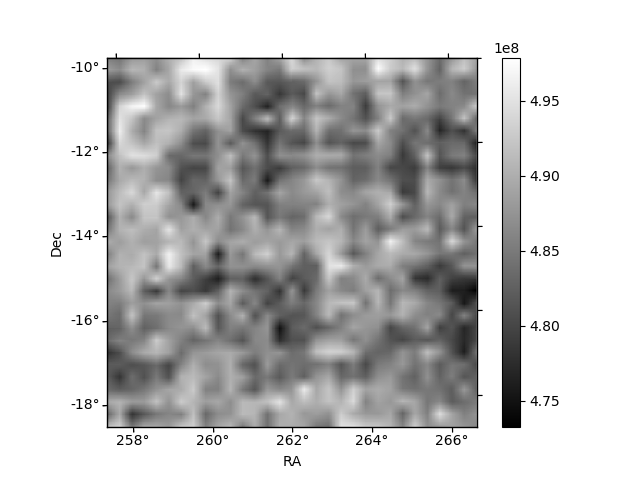
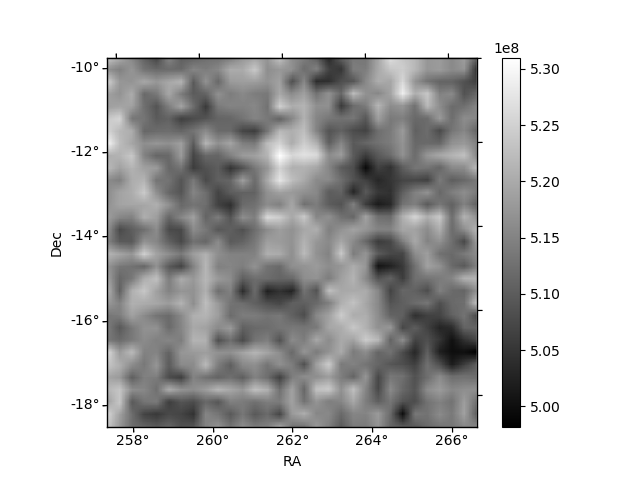
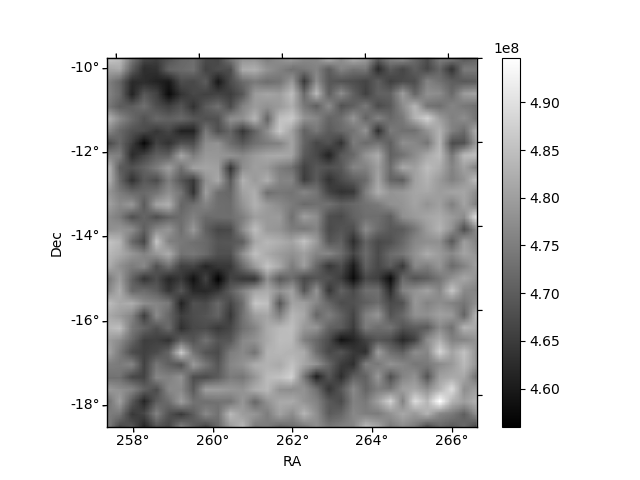
Histogram calculated using DETX and DETY for each event in the final _common_clean file
| Quadrant A | 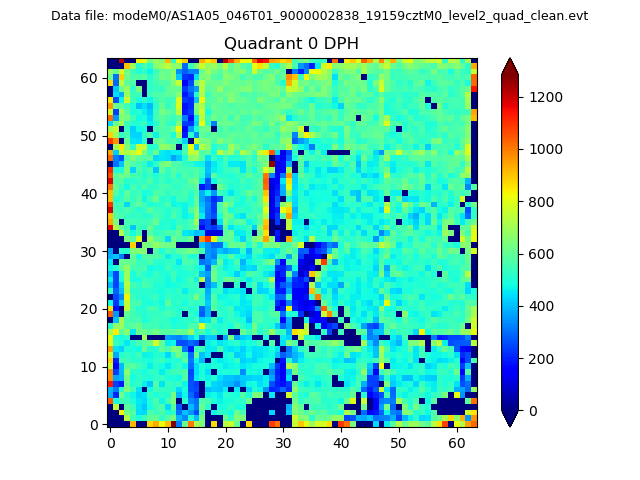 |
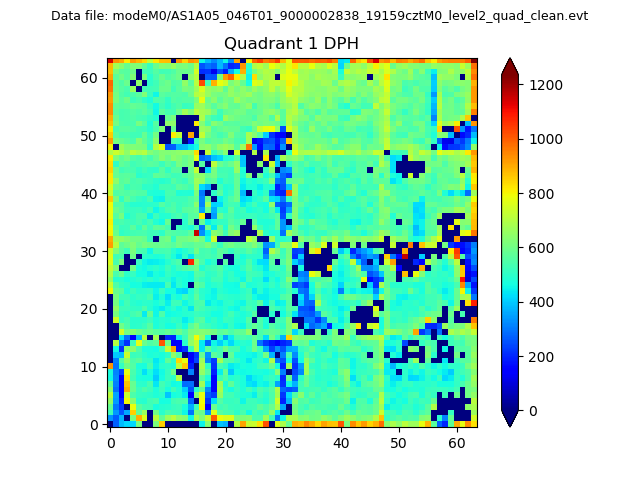 |
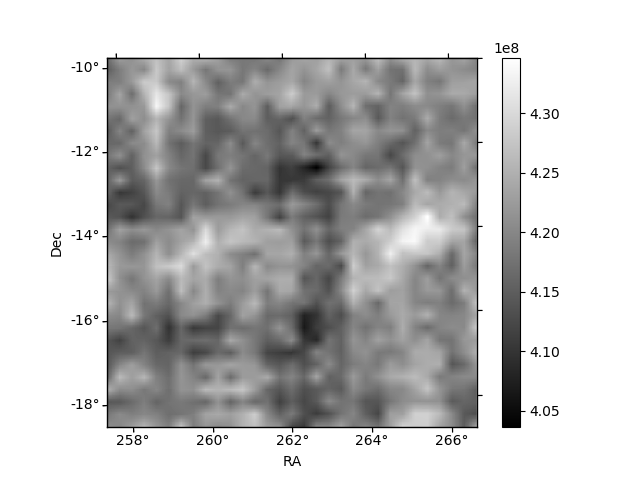
Quadrant B |
|---|---|---|---|
| Quadrant D | 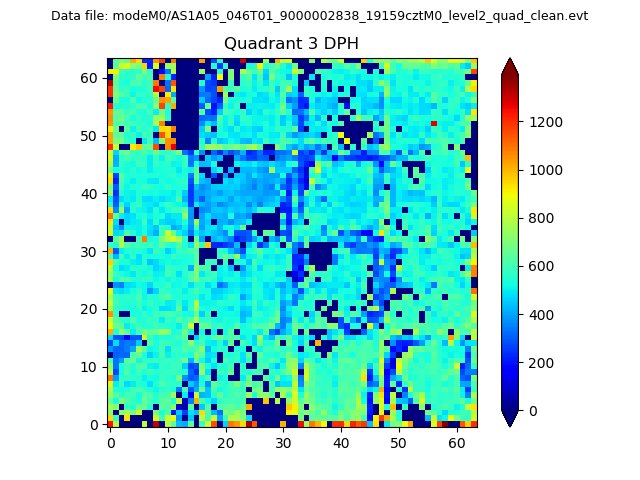 |
 |
Quadrant C |
| Plot type | Count rate plots | Images |
|---|---|---|
| Comparison with Poisson distribution Blue bars denote a histogram of data divided into 1 sec bins. Red curve is a Poisson curve with rate = median count rate of data. |
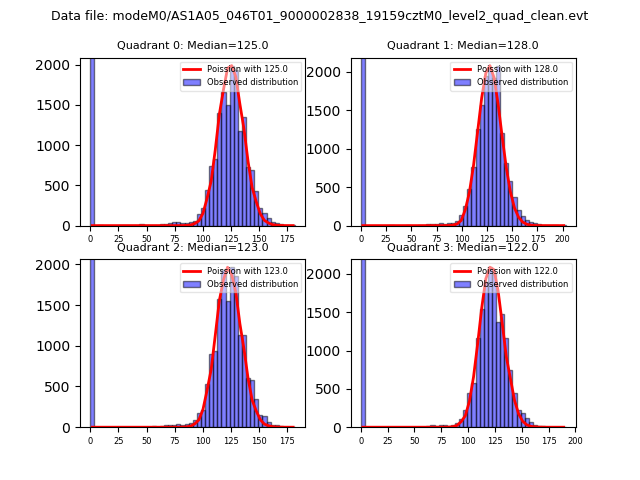 |
 |
| Quadrant-wise count rates Data is divided into 100 sec bins |
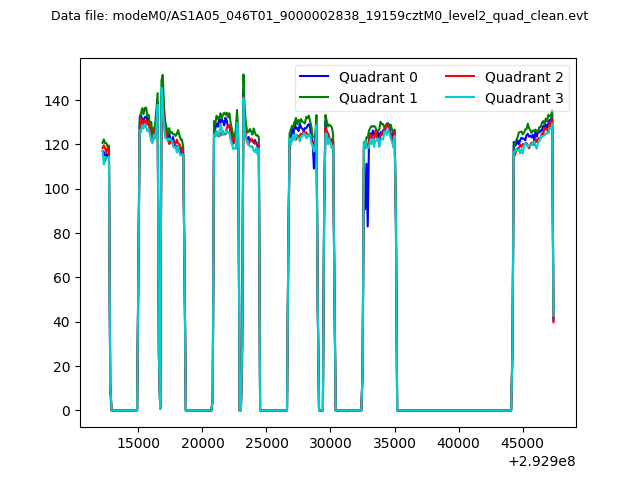 |
|
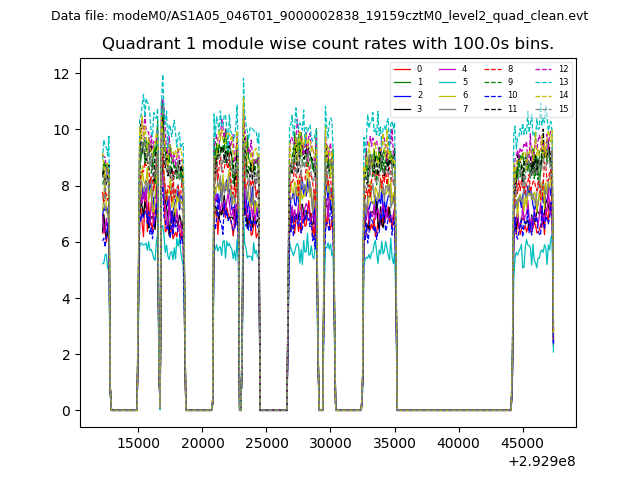
| Module-wise count rates for Quadrant A Data is divided into 100 sec bins |
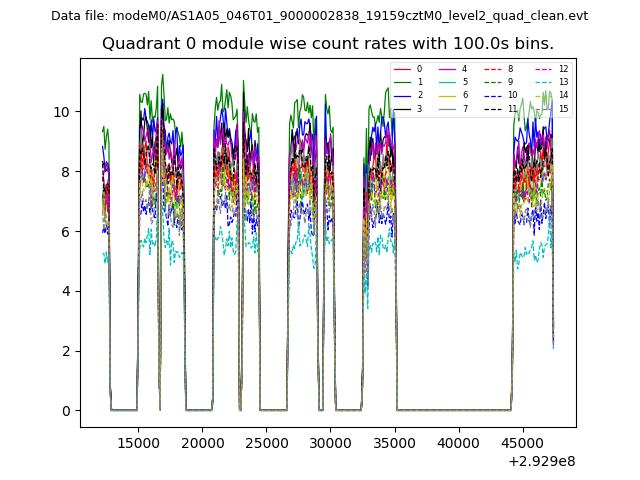 |
 |
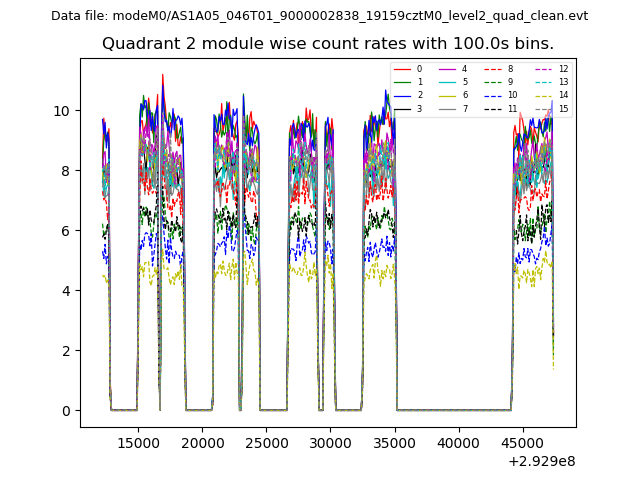
| Module-wise count rates for Quadrant B Data is divided into 100 sec bins |
 |
 |
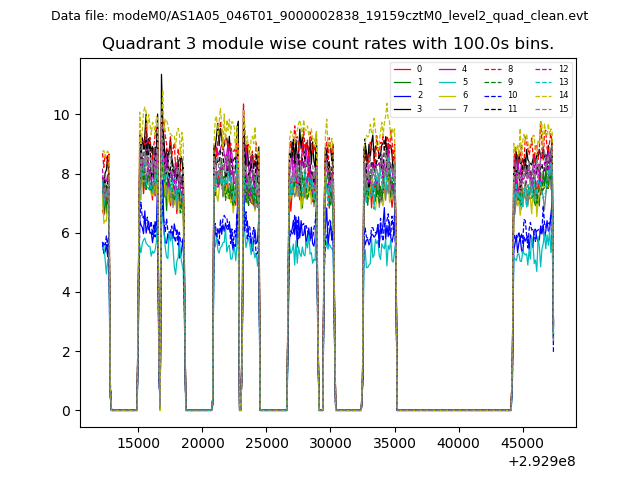
| Module-wise count rates for Quadrant C Data is divided into 100 sec bins |
 |
 |
| Module-wise count rates for Quadrant D Data is divided into 100 sec bins |
 |
 |
| Parameter | Plot |
|---|---|
| CZT HV Monitor | 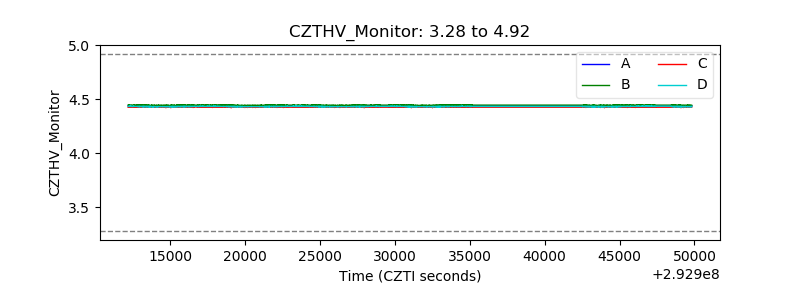 |
| D_VDD | 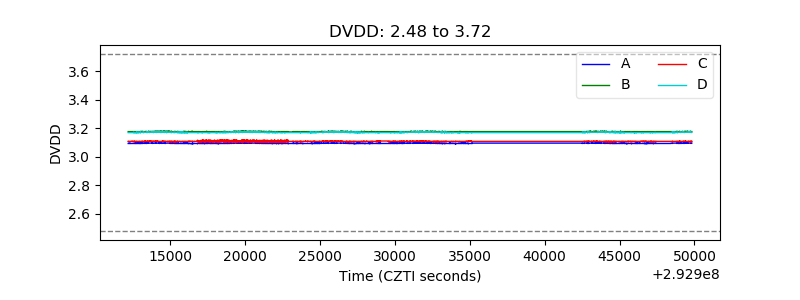 |
| Temperature 1 | 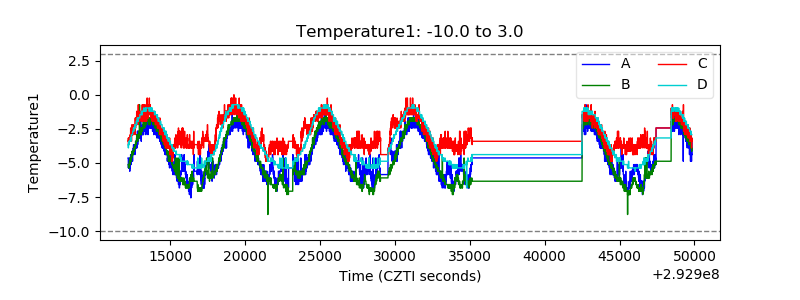 |
| Veto HV Monitor | 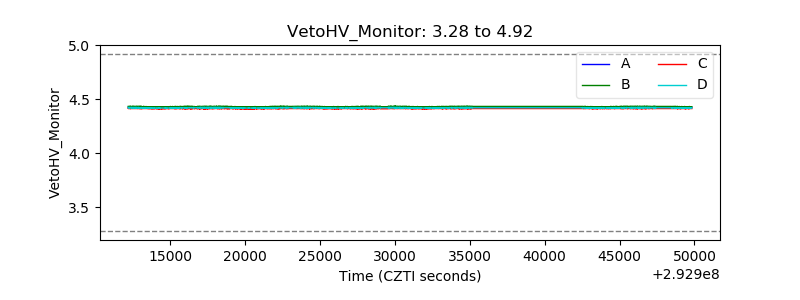 |
| Veto LLD | 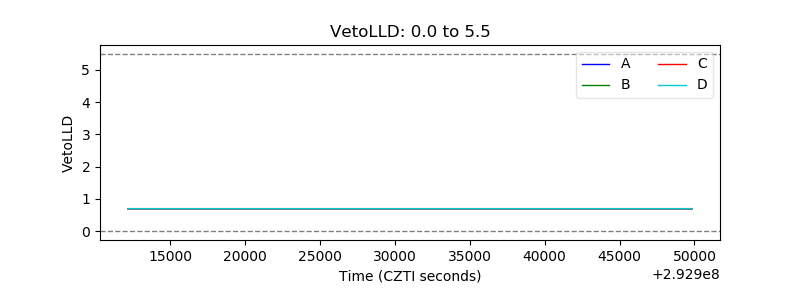 |
| Alpha Counter | 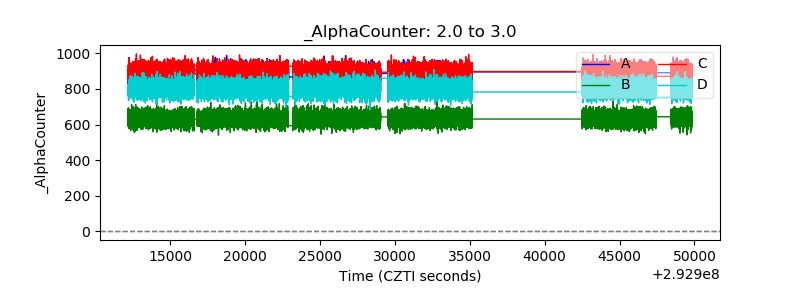 |
| _CPM_Rate | 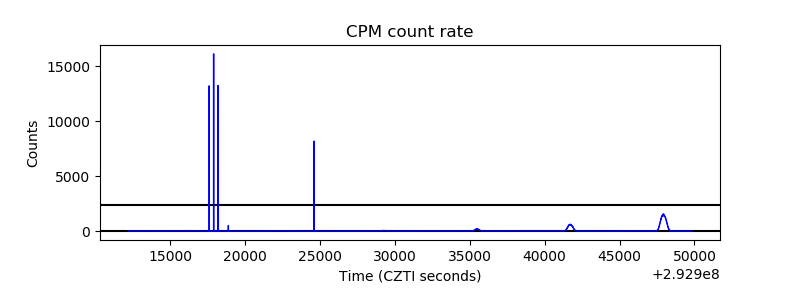 |
| CZT Counter | 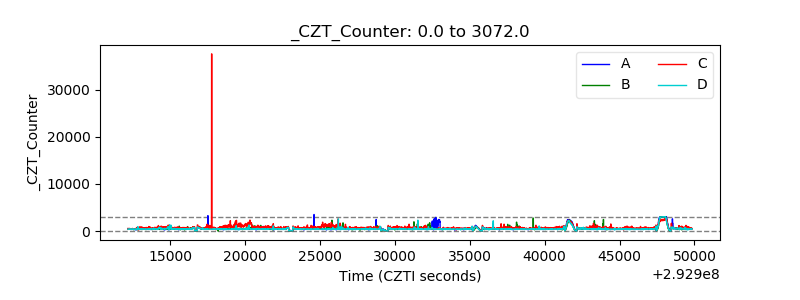 |
| +2.5 Volts monitor | 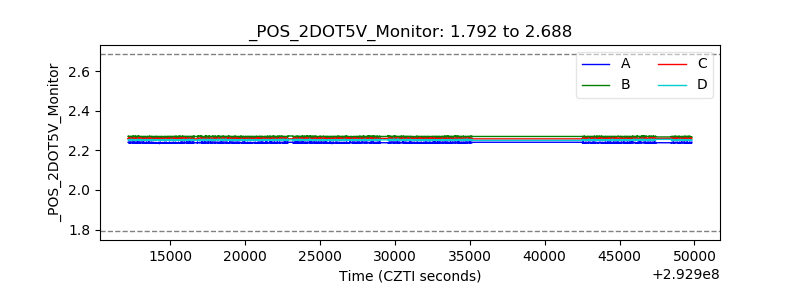 |
| +5 Volts monitor | 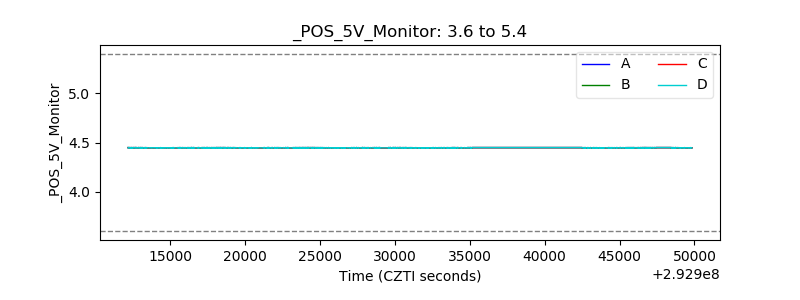 |
| _ROLL_ROT | 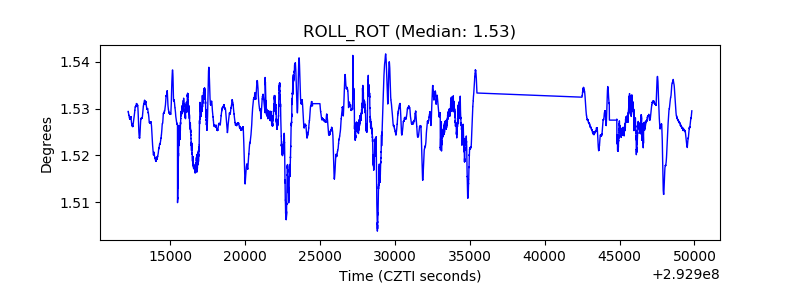 |
| _Roll_DEC |  |
| _Roll_RA | 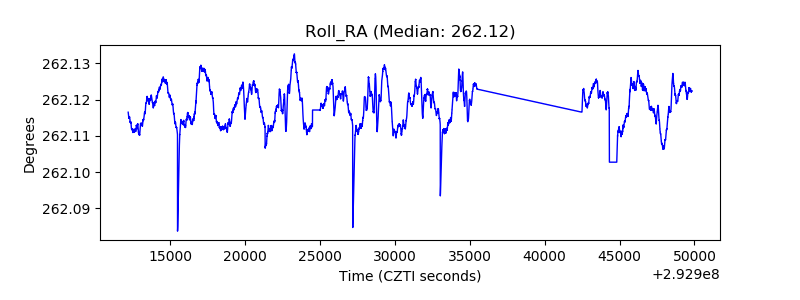 |
| Veto Counter |  |