| Param | Original file | Final file |
|---|---|---|
| Filename | modeM0/AS1A05_046T01_9000002838_19161cztM0_level2.evt | modeM0/AS1A05_046T01_9000002838_19161cztM0_level2_quad_clean.evt |
| Size (bytes) | 489,856,320 | 75,185,280 |
| Size | 467.2 MB | 71.7 MB |
| Events in quadrant A | 3,396,730 | 459,394 |
| Events in quadrant B | 3,593,622 | 469,857 |
| Events in quadrant C | 4,125,403 | 447,681 |
| Events in quadrant D | 3,276,639 | 444,687 |
| Mode M0 | |||
|---|---|---|---|
| Quadrant | BADHDUFLAG | Total packets | Discarded packets |
| A | 0 | 14273 | 2 |
| B | 0 | 14946 | 2 |
| C | 0 | 16472 | 2 |
| D | 0 | 14116 | 2 |
| Mode SS | |||
|---|---|---|---|
| Quadrant | BADHDUFLAG | Total packets | Discarded packets |
| A | 0 | 134 | 0 |
| B | 0 | 134 | 0 |
| C | 0 | 134 | 0 |
| D | 0 | 134 | 0 |
| Mode M9 | |||
|---|---|---|---|
| Quadrant | BADHDUFLAG | Total packets | Discarded packets |
| A | 0 | 22 | 0 |
| B | 0 | 22 | 0 |
| C | 0 | 22 | 0 |
| D | 0 | 22 | 0 |
| Quadrant | Total seconds | Saturated seconds | Saturation percentage |
|---|---|---|---|
| A | 6526 | 118 | 1.808152% |
| B | 6527 | 144 | 2.206220% |
| C | 6526 | 180 | 2.758198% |
| D | 6526 | 75 | 1.149249% |
Noise dominated data is calculated using 1-second bins in cleaned event files. If a bin has >2000 counts, and if more than 50% of those come from <1% of pixels, then it is considered to be noise-dominated and hence unusable.
| Quadrant | # 1 sec bins | Bins with >0 counts | Bins with >2000 counts | High rate bins dominated by noise | Noise dominated (total time) | Noise dominated (detector-on time) | Marked lightcurve |
|---|---|---|---|---|---|---|---|
| A | 8656 | 6528 | 31 | 31 | 0.36% | 0.47% |  |
| B | 8657 | 6529 | 19 | 19 | 0.22% | 0.29% |  |
| C | 8656 | 6528 | 26 | 26 | 0.30% | 0.40% |  |
| D | 8656 | 6528 | 40 | 40 | 0.46% | 0.61% |  |
Top three noisy pixels from each quadrant. If the there are fewer than three noisy pixels in the level2.evt file, extra rows are filled as -1
| Pixel properties | Quadrant properties | ||||||
|---|---|---|---|---|---|---|---|
| Quadrant | DetID | PixID | Counts | Sigma | Mean | Median | Sigma |
| A | 15 | 174 | 106626 | 624.23 | 837 | 819 | 169.5 |
| A | 11 | 47 | 67408 | 392.85 | 837 | 819 | 169.5 |
| A | 13 | 254 | 8405 | 44.75 | 837 | 819 | 169.5 |
| B | 3 | 112 | 176761 | 1092.65 | 840 | 820 | 161.0 |
| B | 7 | 220 | 103335 | 636.65 | 840 | 820 | 161.0 |
| B | 12 | 111 | 18473 | 109.63 | 840 | 820 | 161.0 |
| C | 3 | 233 | 845834 | 4517.59 | 806 | 814 | 187.1 |
| C | 14 | 238 | 125242 | 665.21 | 806 | 814 | 187.1 |
| C | 0 | 207 | 9554 | 46.73 | 806 | 814 | 187.1 |
| D | 11 | 176 | 151941 | 753.08 | 819 | 796 | 200.7 |
| D | 2 | 234 | 29212 | 141.58 | 819 | 796 | 200.7 |
| D | 7 | 96 | 16308 | 77.29 | 819 | 796 | 200.7 |
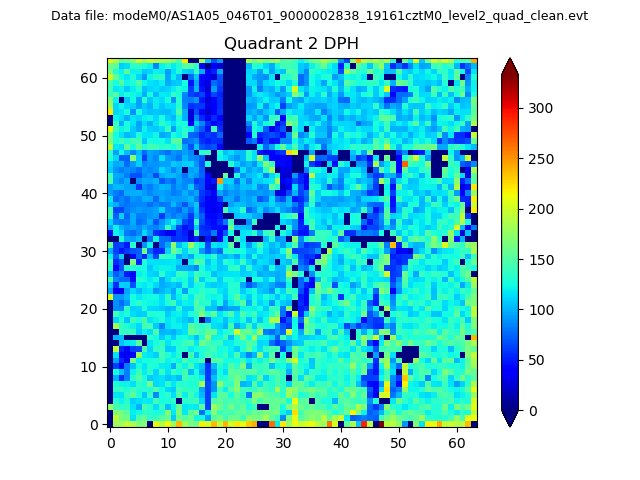
Histogram calculated using DETX and DETY for each event in the final _common_clean file
| Quadrant A | 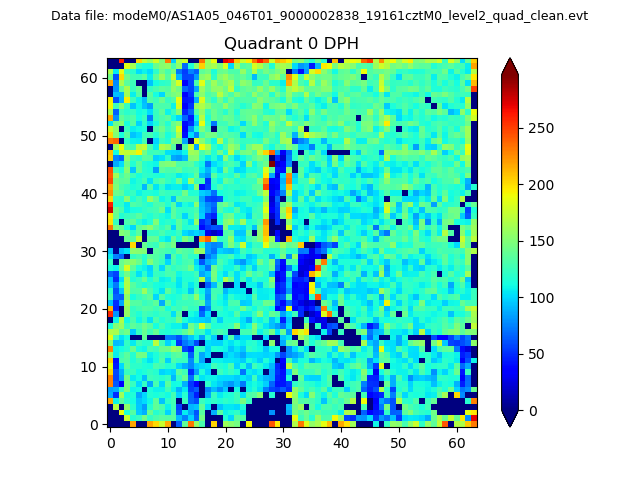 |
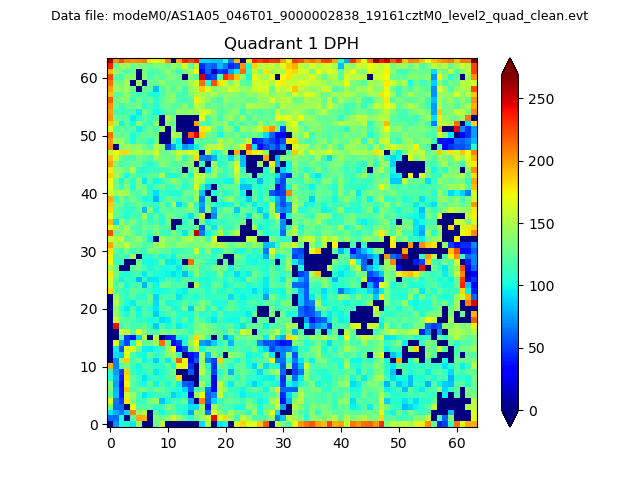 |
Quadrant B |
|---|---|---|---|
| Quadrant D | 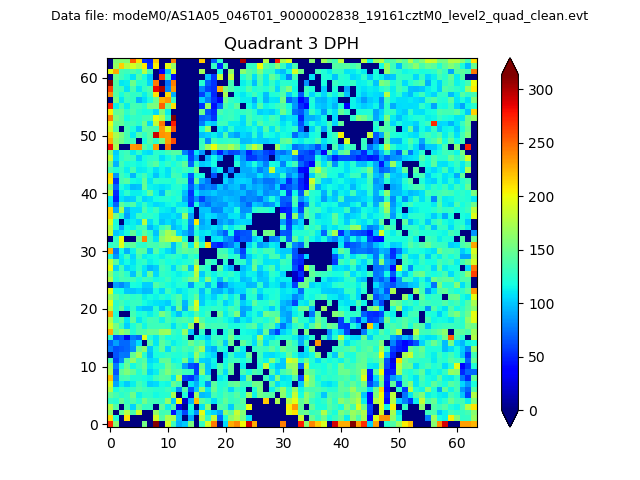 |
 |
Quadrant C |
| Plot type | Count rate plots | Images |
|---|---|---|
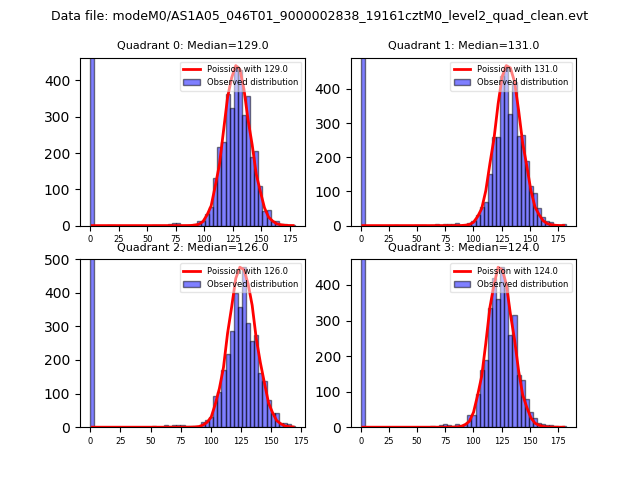
| Comparison with Poisson distribution Blue bars denote a histogram of data divided into 1 sec bins. Red curve is a Poisson curve with rate = median count rate of data. |
 |
 |
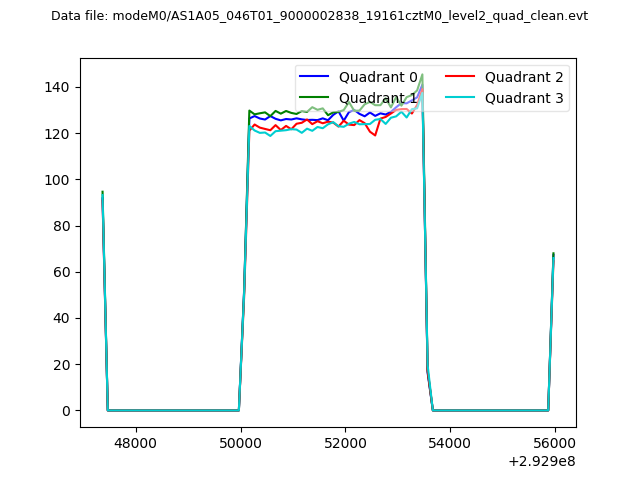
| Quadrant-wise count rates Data is divided into 100 sec bins |
 |
|
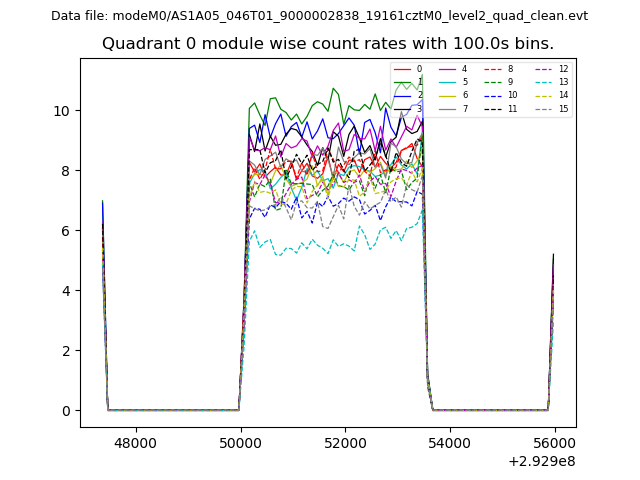
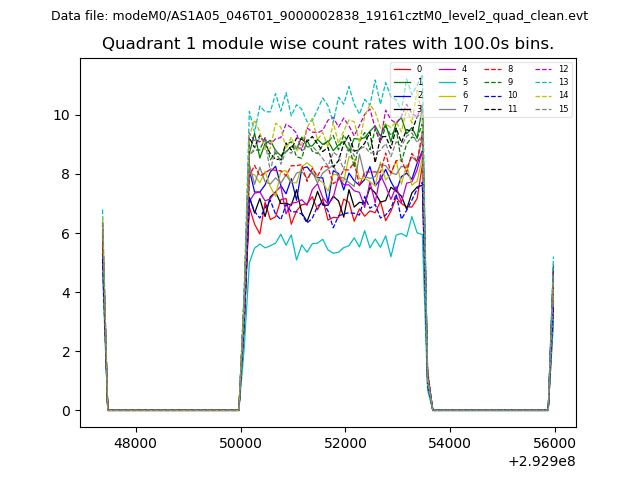
| Module-wise count rates for Quadrant A Data is divided into 100 sec bins |
 |
 |
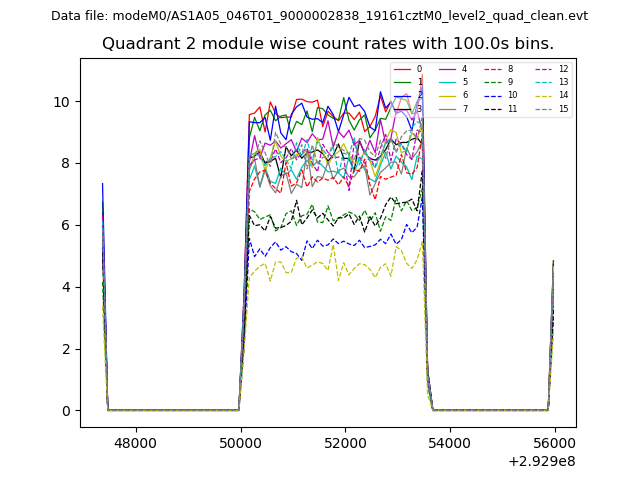
| Module-wise count rates for Quadrant B Data is divided into 100 sec bins |
 |
 |
| Module-wise count rates for Quadrant C Data is divided into 100 sec bins |
 |
 |
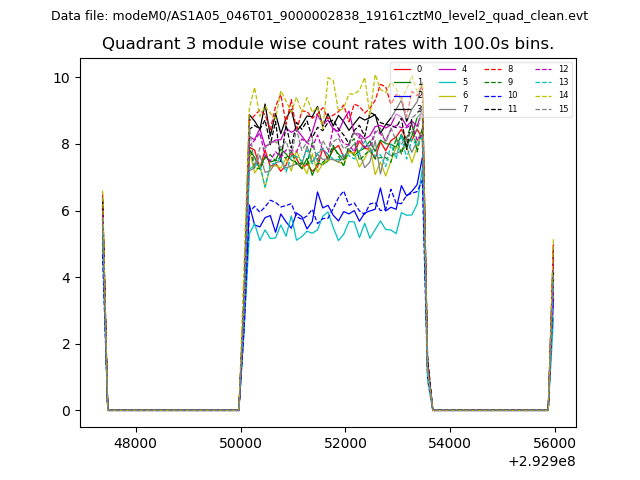
| Module-wise count rates for Quadrant D Data is divided into 100 sec bins |
 |
 |
| Parameter | Plot |
|---|---|
| CZT HV Monitor | 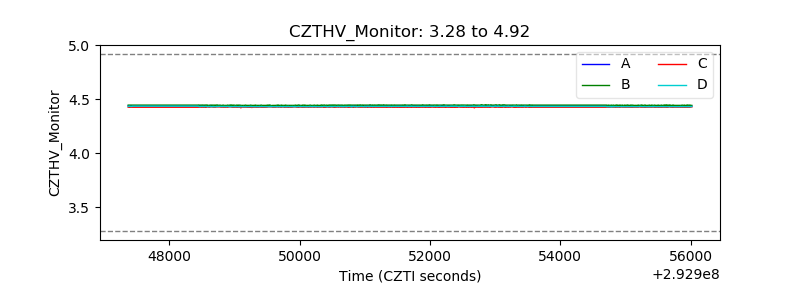 |
| D_VDD | 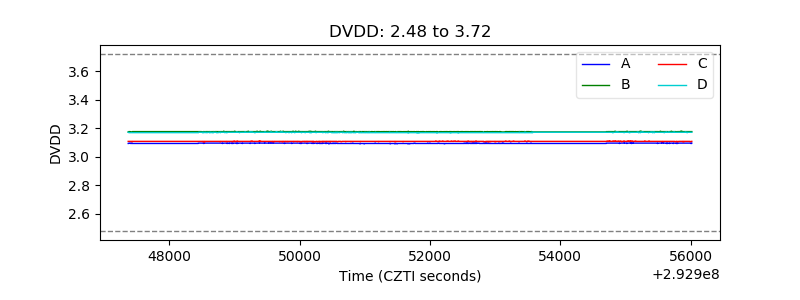 |
| Temperature 1 | 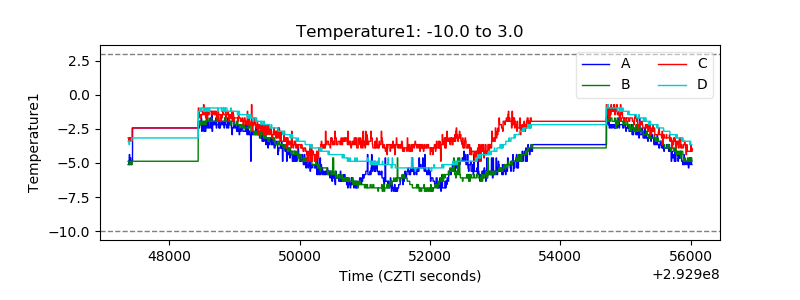 |
| Veto HV Monitor | 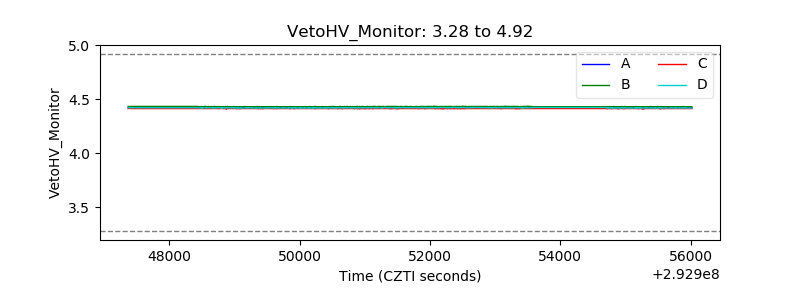 |
| Veto LLD | 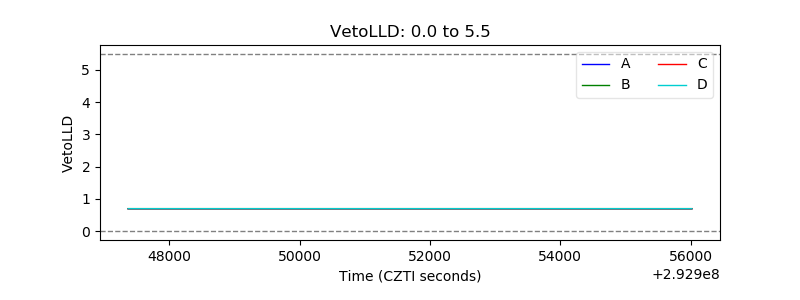 |
| Alpha Counter |  |
| _CPM_Rate | 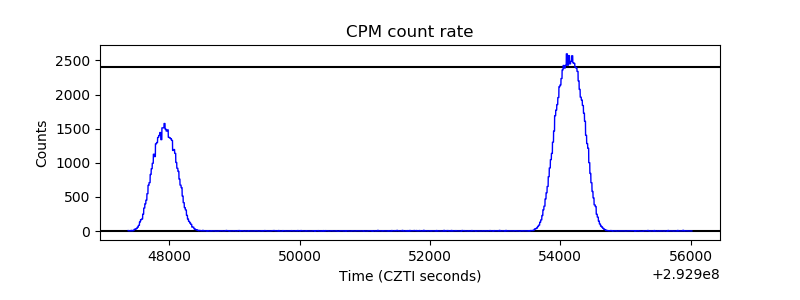 |
| CZT Counter | 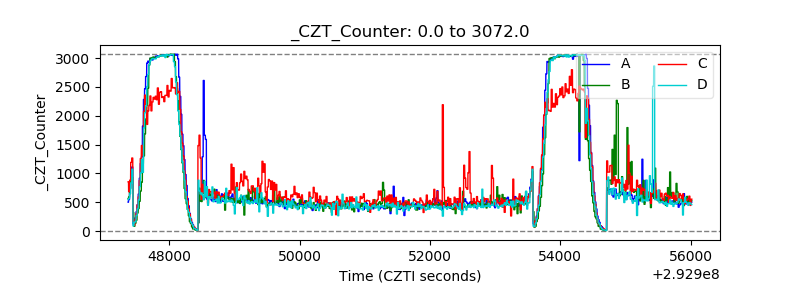 |
| +2.5 Volts monitor | 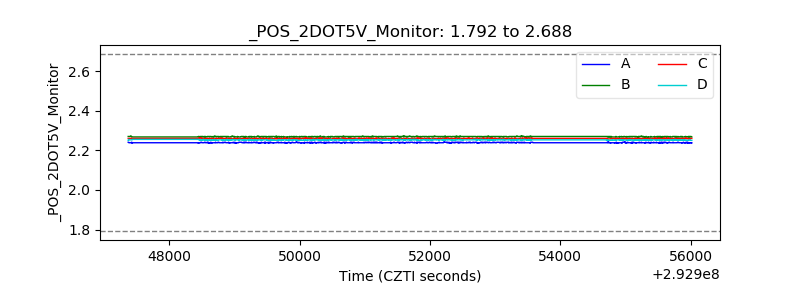 |
| +5 Volts monitor | 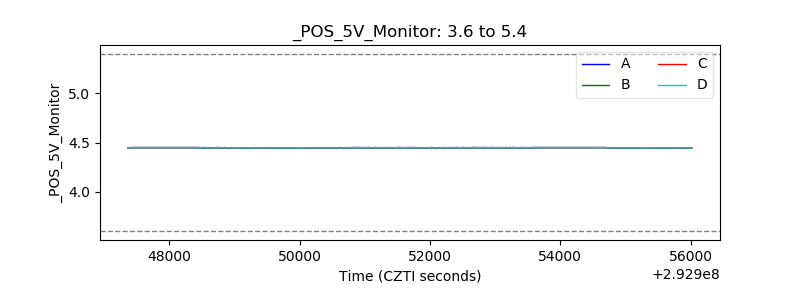 |
| _ROLL_ROT |  |
| _Roll_DEC | 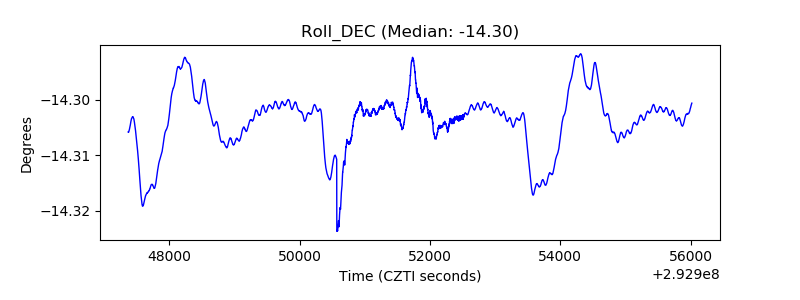 |
| _Roll_RA | 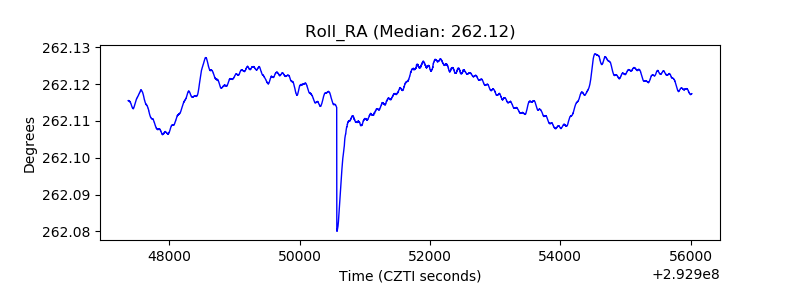 |
| Veto Counter | 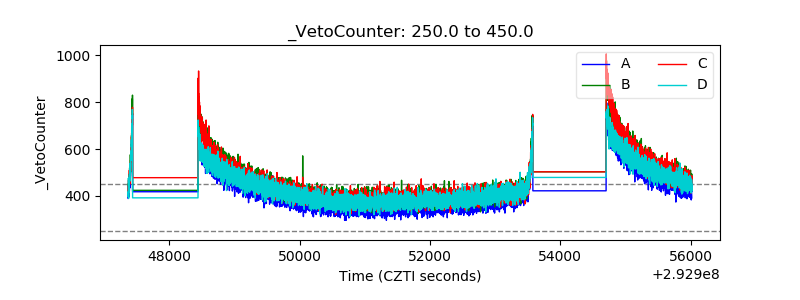 |