| Param | Original file | Final file |
|---|---|---|
| Filename | modeM0/AS1A05_046T01_9000002838_19162cztM0_level2.evt | modeM0/AS1A05_046T01_9000002838_19162cztM0_level2_quad_clean.evt |
| Size (bytes) | 473,460,480 | 84,988,800 |
| Size | 451.5 MB | 81.1 MB |
| Events in quadrant A | 3,243,277 | 538,849 |
| Events in quadrant B | 3,782,492 | 551,773 |
| Events in quadrant C | 3,618,427 | 528,894 |
| Events in quadrant D | 3,269,887 | 517,654 |
| Mode M0 | |||
|---|---|---|---|
| Quadrant | BADHDUFLAG | Total packets | Discarded packets |
| A | 0 | 13736 | 2 |
| B | 0 | 15227 | 2 |
| C | 0 | 14666 | 2 |
| D | 0 | 13849 | 3 |
| Mode SS | |||
|---|---|---|---|
| Quadrant | BADHDUFLAG | Total packets | Discarded packets |
| A | 0 | 128 | 0 |
| B | 0 | 128 | 0 |
| C | 0 | 128 | 0 |
| D | 0 | 128 | 0 |
| Mode M9 | |||
|---|---|---|---|
| Quadrant | BADHDUFLAG | Total packets | Discarded packets |
| A | 0 | 23 | 0 |
| B | 0 | 24 | 0 |
| C | 0 | 24 | 0 |
| D | 0 | 24 | 0 |
| Quadrant | Total seconds | Saturated seconds | Saturation percentage |
|---|---|---|---|
| A | 6258 | 70 | 1.118568% |
| B | 6258 | 215 | 3.435602% |
| C | 6258 | 122 | 1.949505% |
| D | 6257 | 85 | 1.358479% |
Noise dominated data is calculated using 1-second bins in cleaned event files. If a bin has >2000 counts, and if more than 50% of those come from <1% of pixels, then it is considered to be noise-dominated and hence unusable.
| Quadrant | # 1 sec bins | Bins with >0 counts | Bins with >2000 counts | High rate bins dominated by noise | Noise dominated (total time) | Noise dominated (detector-on time) | Marked lightcurve |
|---|---|---|---|---|---|---|---|
| A | 7473 | 6259 | 0 | 0 | 0.00% | 0.00% | 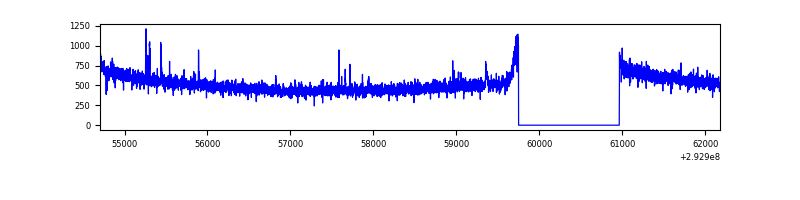 |
| B | 7473 | 6259 | 56 | 56 | 0.75% | 0.89% | 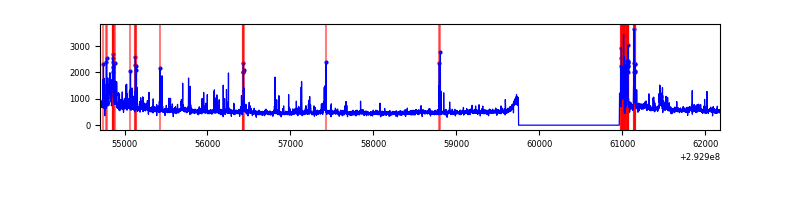 |
| C | 7473 | 6259 | 1 | 1 | 0.01% | 0.02% | 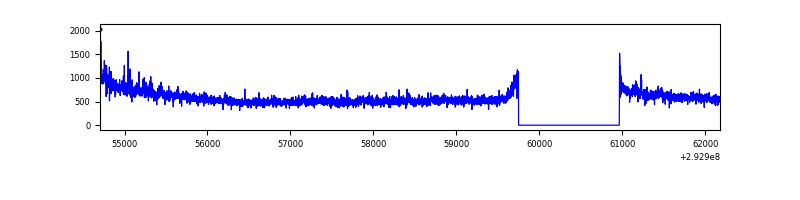 |
| D | 7472 | 6258 | 47 | 47 | 0.63% | 0.75% | 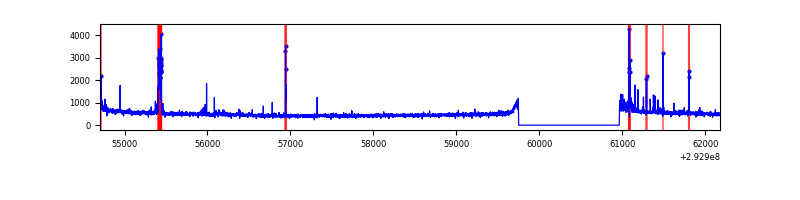 |
Top three noisy pixels from each quadrant. If the there are fewer than three noisy pixels in the level2.evt file, extra rows are filled as -1
| Pixel properties | Quadrant properties | ||||||
|---|---|---|---|---|---|---|---|
| Quadrant | DetID | PixID | Counts | Sigma | Mean | Median | Sigma |
| A | 11 | 47 | 41924 | 244.93 | 828 | 812 | 167.8 |
| A | 15 | 174 | 12435 | 69.25 | 828 | 812 | 167.8 |
| A | 13 | 254 | 8339 | 44.84 | 828 | 812 | 167.8 |
| B | 3 | 112 | 304179 | 1950.66 | 826 | 810 | 155.5 |
| B | 7 | 220 | 192978 | 1235.64 | 826 | 810 | 155.5 |
| B | 0 | 197 | 33191 | 208.21 | 826 | 810 | 155.5 |
| C | 3 | 233 | 376512 | 2031.67 | 799 | 807 | 184.9 |
| C | 14 | 238 | 125445 | 673.99 | 799 | 807 | 184.9 |
| C | 13 | 61 | 5578 | 25.8 | 799 | 807 | 184.9 |
| D | 11 | 176 | 219669 | 1125.0 | 804 | 782 | 194.6 |
| D | 2 | 234 | 26401 | 131.67 | 804 | 782 | 194.6 |
| D | 14 | 226 | 7849 | 36.32 | 804 | 782 | 194.6 |
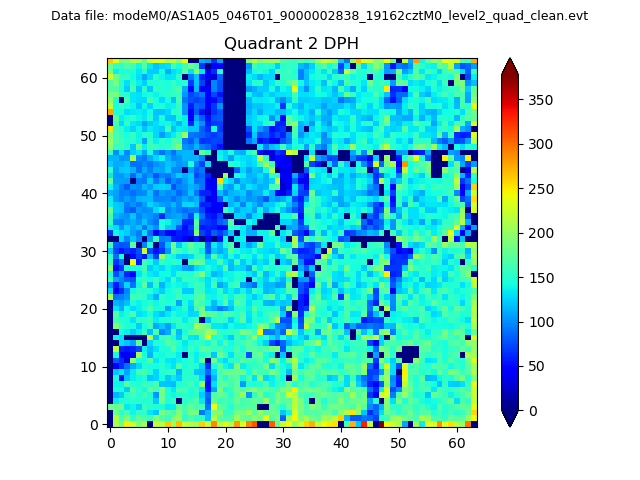
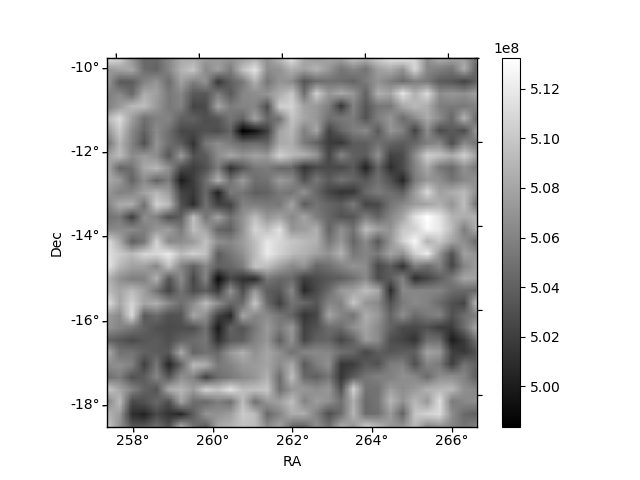
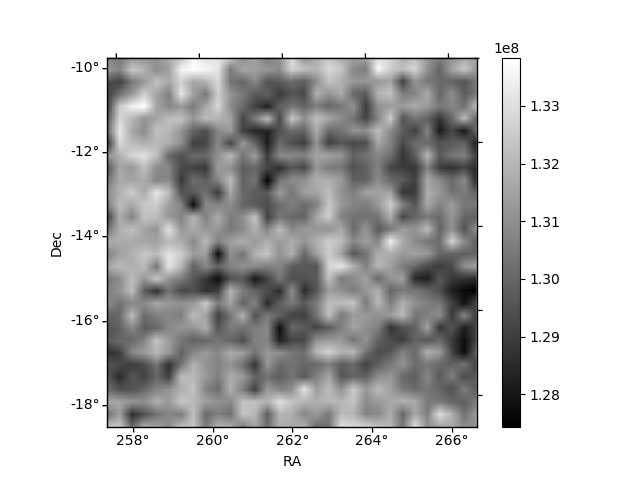
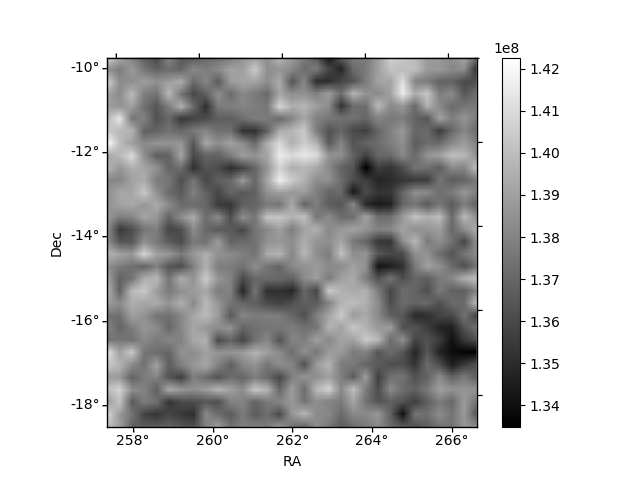
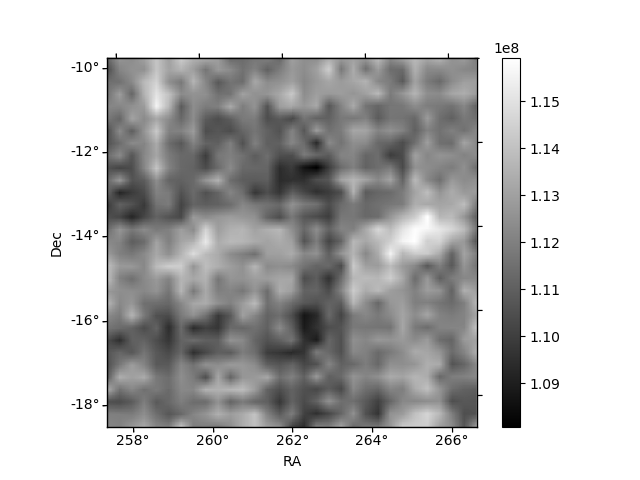
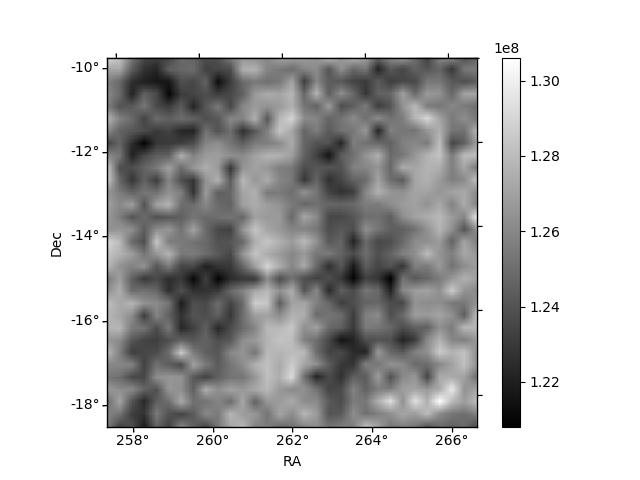
Histogram calculated using DETX and DETY for each event in the final _common_clean file
| Quadrant A | 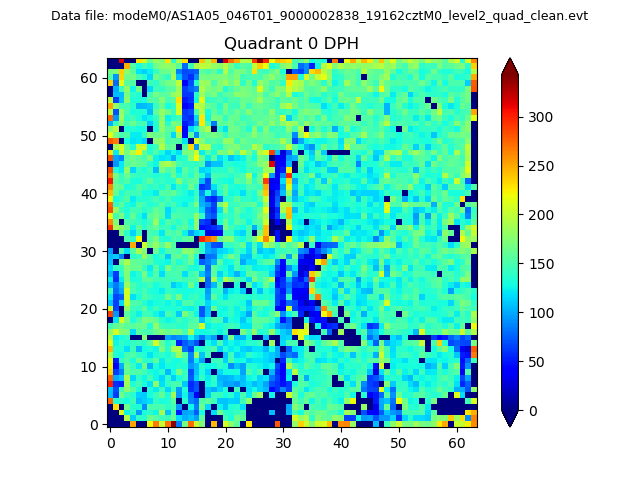 |
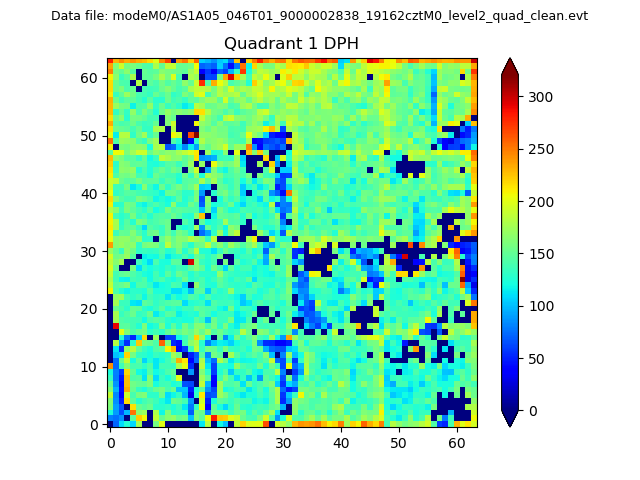 |
Quadrant B |
|---|---|---|---|
| Quadrant D | 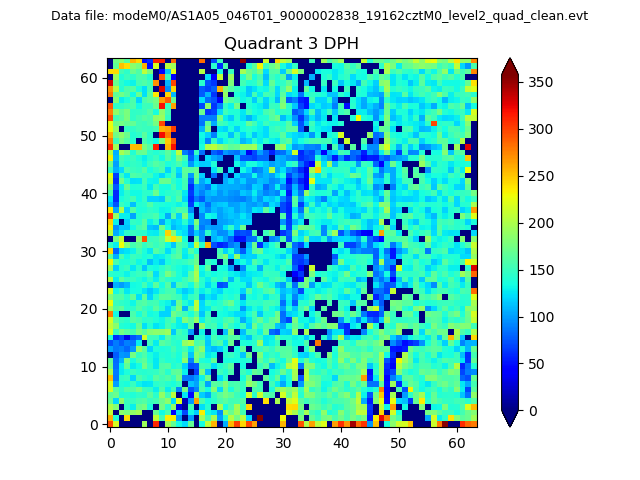 |
 |
Quadrant C |
| Plot type | Count rate plots | Images |
|---|---|---|
| Comparison with Poisson distribution Blue bars denote a histogram of data divided into 1 sec bins. Red curve is a Poisson curve with rate = median count rate of data. |
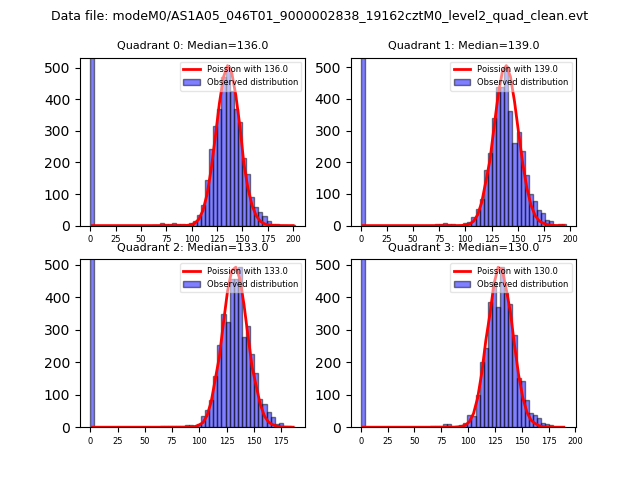 |
 |
| Quadrant-wise count rates Data is divided into 100 sec bins |
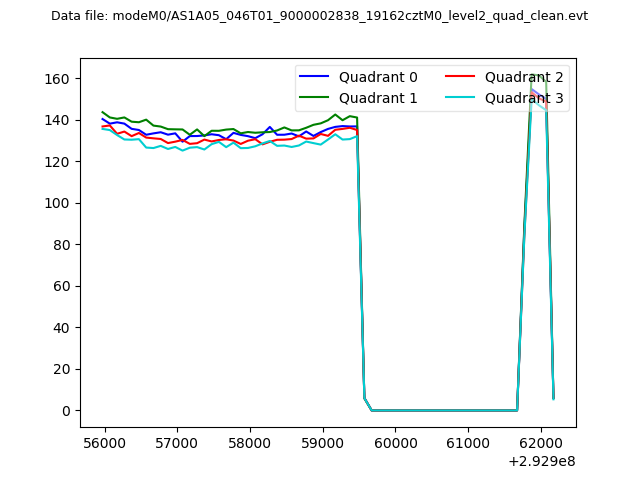 |
|
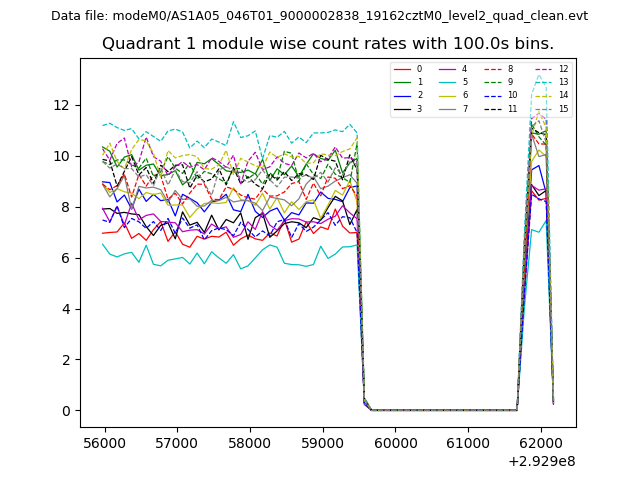
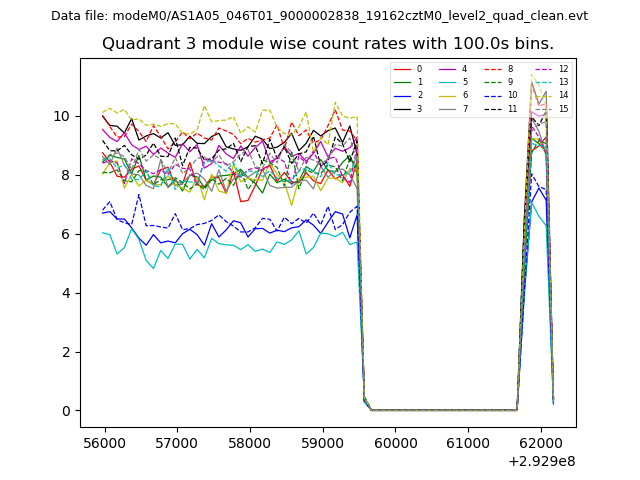
| Module-wise count rates for Quadrant A Data is divided into 100 sec bins |
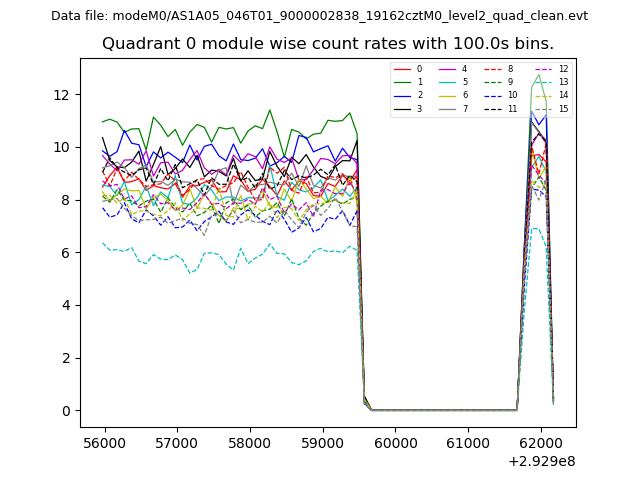 |
 |
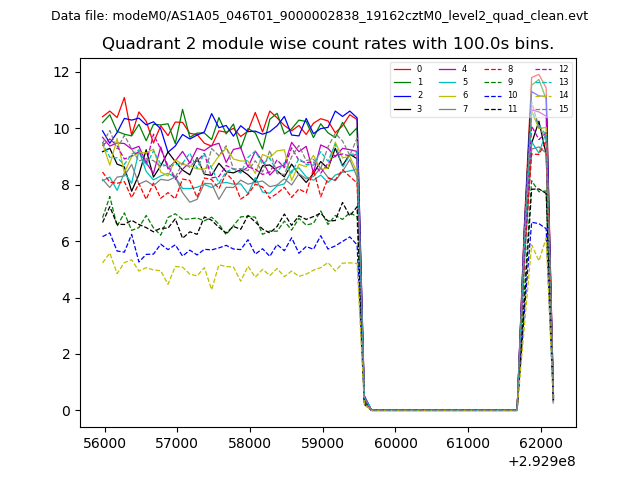
| Module-wise count rates for Quadrant B Data is divided into 100 sec bins |
 |
 |
| Module-wise count rates for Quadrant C Data is divided into 100 sec bins |
 |
 |
| Module-wise count rates for Quadrant D Data is divided into 100 sec bins |
 |
 |
| Parameter | Plot |
|---|---|
| CZT HV Monitor | 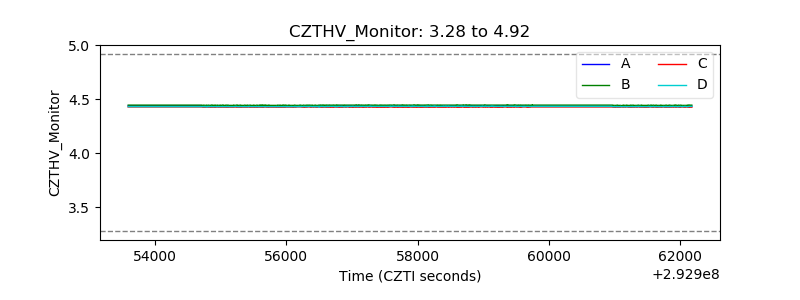 |
| D_VDD | 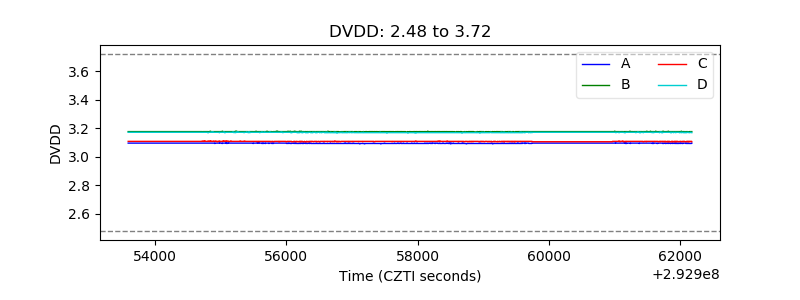 |
| Temperature 1 | 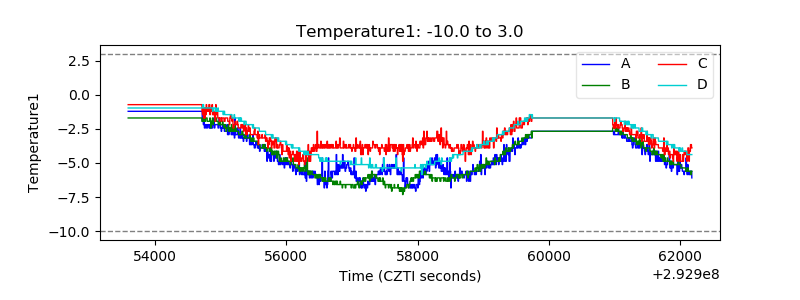 |
| Veto HV Monitor | 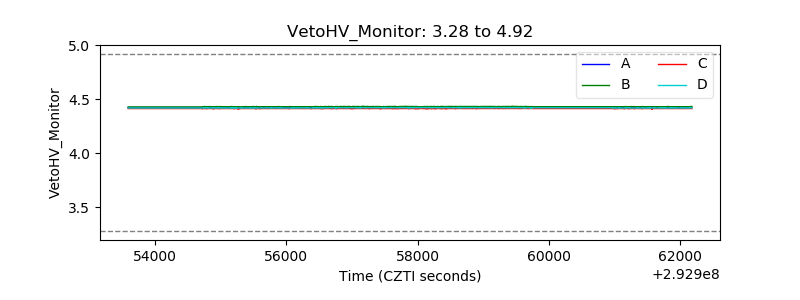 |
| Veto LLD | 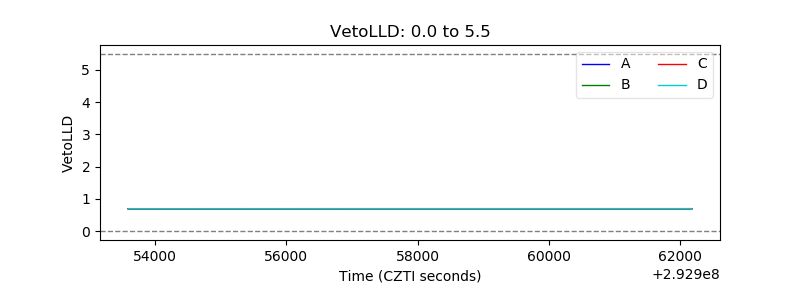 |
| Alpha Counter | 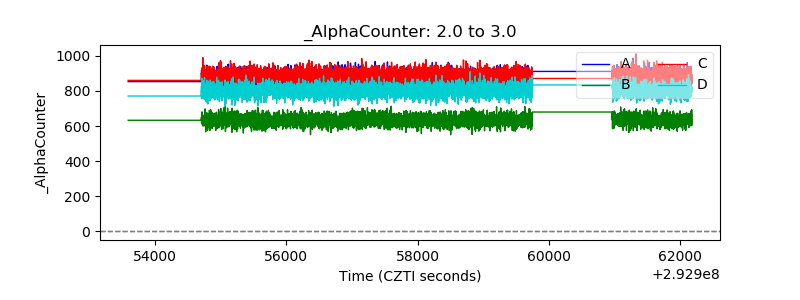 |
| _CPM_Rate | 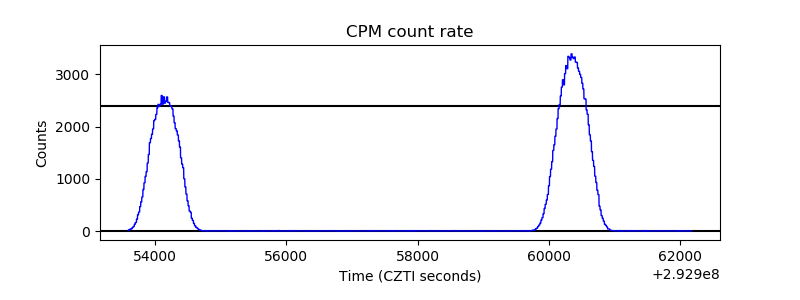 |
| CZT Counter | 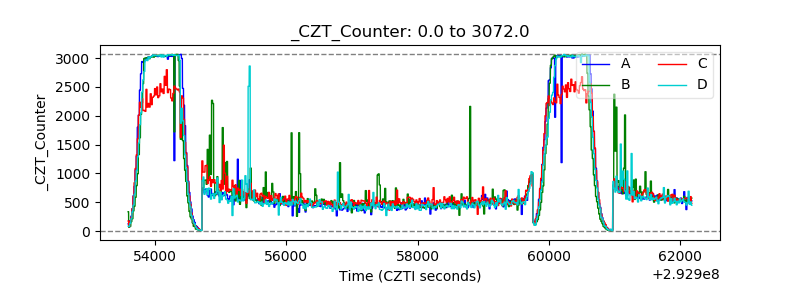 |
| +2.5 Volts monitor |  |
| +5 Volts monitor |  |
| _ROLL_ROT | 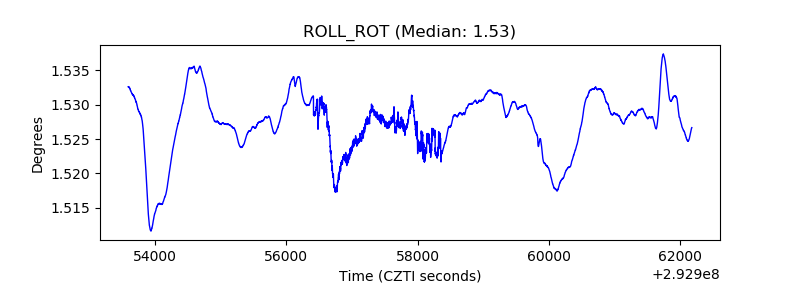 |
| _Roll_DEC |  |
| _Roll_RA | 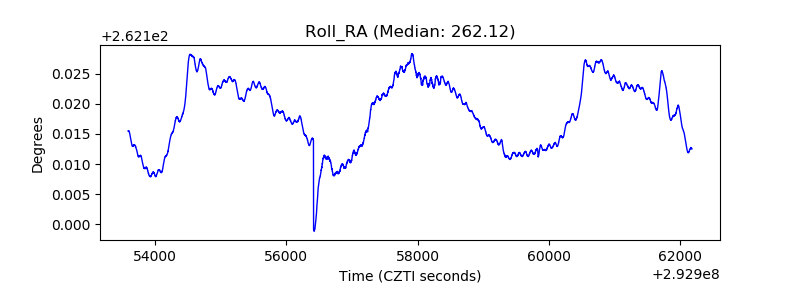 |
| Veto Counter | 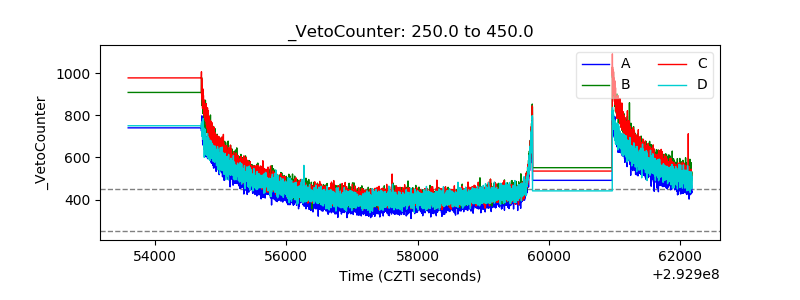 |