| Param | Original file | Final file |
|---|---|---|
| Filename | modeM0/AS1A05_046T01_9000002838_19163cztM0_level2.evt | modeM0/AS1A05_046T01_9000002838_19163cztM0_level2_quad_clean.evt |
| Size (bytes) | 471,326,400 | 98,496,000 |
| Size | 449.5 MB | 93.9 MB |
| Events in quadrant A | 3,256,465 | 637,311 |
| Events in quadrant B | 3,760,381 | 661,643 |
| Events in quadrant C | 3,524,094 | 632,701 |
| Events in quadrant D | 3,308,126 | 614,298 |
| Mode M0 | |||
|---|---|---|---|
| Quadrant | BADHDUFLAG | Total packets | Discarded packets |
| A | 0 | 13657 | 2 |
| B | 0 | 15178 | 2 |
| C | 0 | 14400 | 2 |
| D | 0 | 13878 | 2 |
| Mode SS | |||
|---|---|---|---|
| Quadrant | BADHDUFLAG | Total packets | Discarded packets |
| A | 0 | 128 | 0 |
| B | 0 | 128 | 0 |
| C | 0 | 128 | 0 |
| D | 0 | 128 | 0 |
| Mode M9 | |||
|---|---|---|---|
| Quadrant | BADHDUFLAG | Total packets | Discarded packets |
| A | 0 | 14 | 0 |
| B | 0 | 15 | 0 |
| C | 0 | 15 | 0 |
| D | 0 | 15 | 0 |
| Quadrant | Total seconds | Saturated seconds | Saturation percentage |
|---|---|---|---|
| A | 6259 | 56 | 0.894712% |
| B | 6259 | 195 | 3.115514% |
| C | 6259 | 100 | 1.597699% |
| D | 6259 | 52 | 0.830804% |
Noise dominated data is calculated using 1-second bins in cleaned event files. If a bin has >2000 counts, and if more than 50% of those come from <1% of pixels, then it is considered to be noise-dominated and hence unusable.
| Quadrant | # 1 sec bins | Bins with >0 counts | Bins with >2000 counts | High rate bins dominated by noise | Noise dominated (total time) | Noise dominated (detector-on time) | Marked lightcurve |
|---|---|---|---|---|---|---|---|
| A | 7564 | 6260 | 0 | 0 | 0.00% | 0.00% | 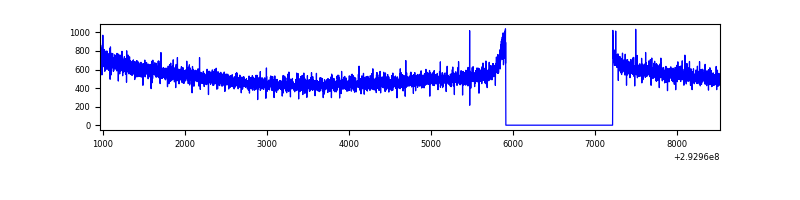 |
| B | 7564 | 6260 | 63 | 63 | 0.83% | 1.01% | 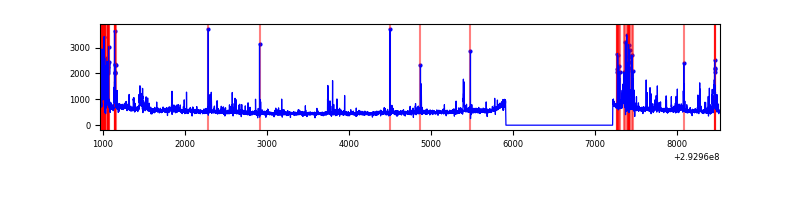 |
| C | 7564 | 6260 | 4 | 4 | 0.05% | 0.06% | 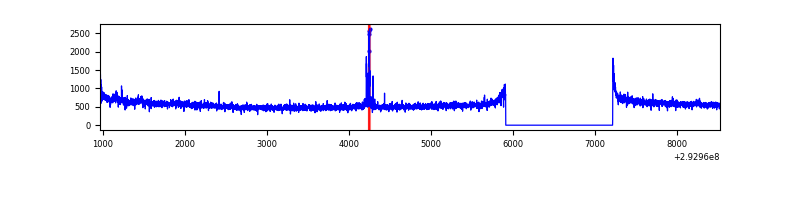 |
| D | 7564 | 6260 | 26 | 26 | 0.34% | 0.42% | 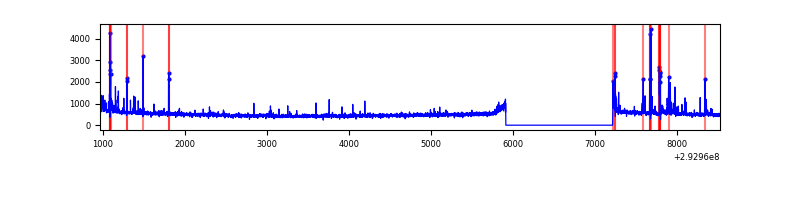 |
Top three noisy pixels from each quadrant. If the there are fewer than three noisy pixels in the level2.evt file, extra rows are filled as -1
| Pixel properties | Quadrant properties | ||||||
|---|---|---|---|---|---|---|---|
| Quadrant | DetID | PixID | Counts | Sigma | Mean | Median | Sigma |
| A | 11 | 47 | 32589 | 188.93 | 836 | 822 | 168.1 |
| A | 13 | 254 | 7874 | 41.94 | 836 | 822 | 168.1 |
| A | 0 | 226 | 7302 | 38.54 | 836 | 822 | 168.1 |
| B | 3 | 112 | 237572 | 1511.01 | 839 | 820 | 156.7 |
| B | 7 | 220 | 178758 | 1135.64 | 839 | 820 | 156.7 |
| B | 0 | 197 | 38175 | 238.41 | 839 | 820 | 156.7 |
| C | 3 | 233 | 218978 | 1151.67 | 814 | 824 | 189.4 |
| C | 14 | 238 | 127605 | 669.3 | 814 | 824 | 189.4 |
| C | 13 | 61 | 5630 | 25.37 | 814 | 824 | 189.4 |
| D | 11 | 176 | 210880 | 1065.03 | 815 | 793 | 197.3 |
| D | 2 | 234 | 27747 | 136.64 | 815 | 793 | 197.3 |
| D | 1 | 52 | 13725 | 65.56 | 815 | 793 | 197.3 |
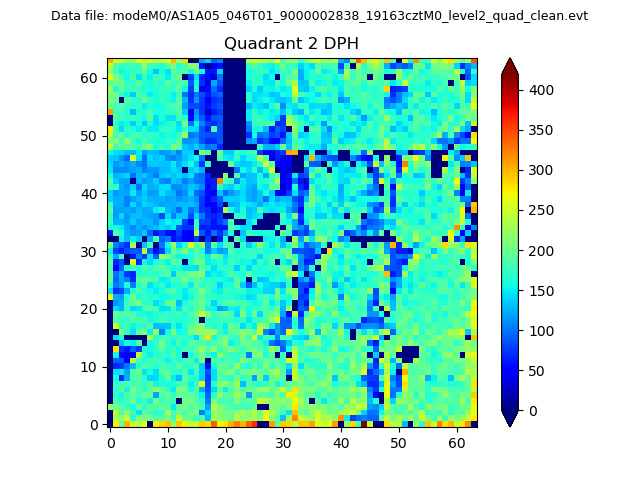
Histogram calculated using DETX and DETY for each event in the final _common_clean file
| Quadrant A | 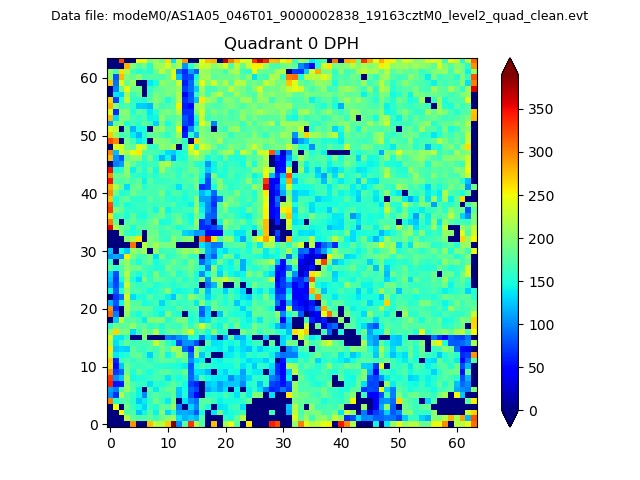 |
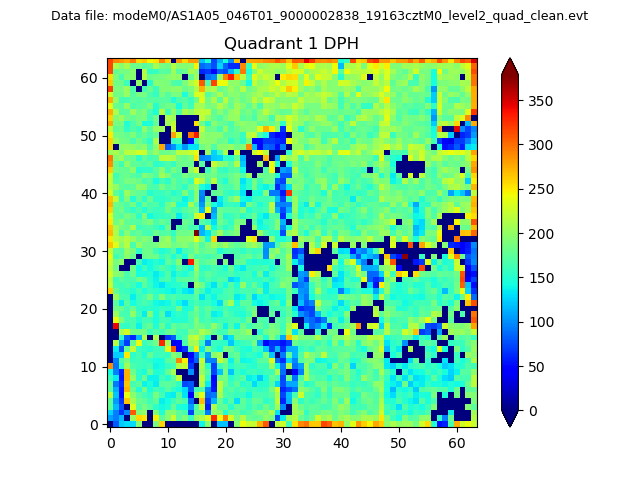 |
Quadrant B |
|---|---|---|---|
| Quadrant D | 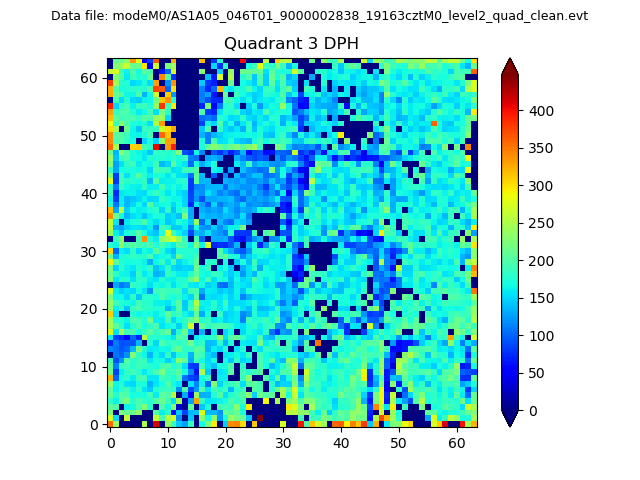 |
 |
Quadrant C |
| Plot type | Count rate plots | Images |
|---|---|---|
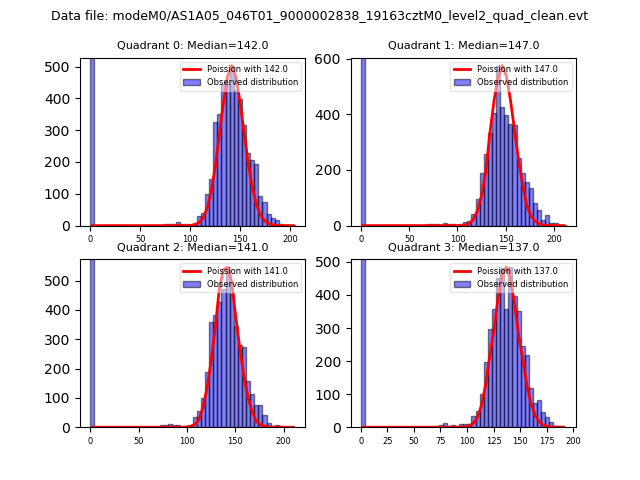
| Comparison with Poisson distribution Blue bars denote a histogram of data divided into 1 sec bins. Red curve is a Poisson curve with rate = median count rate of data. |
 |
 |
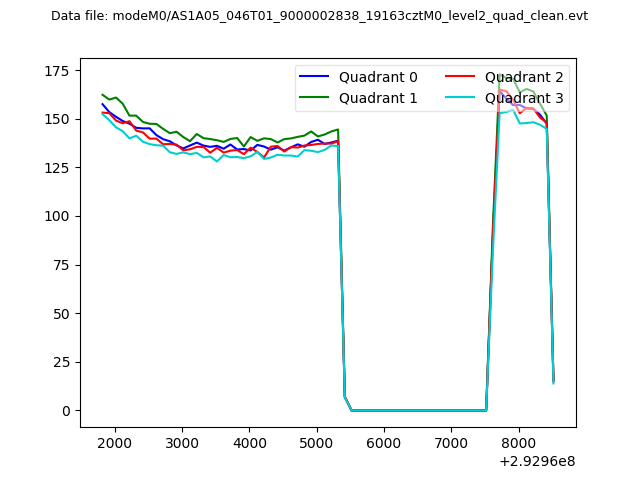
| Quadrant-wise count rates Data is divided into 100 sec bins |
 |
|
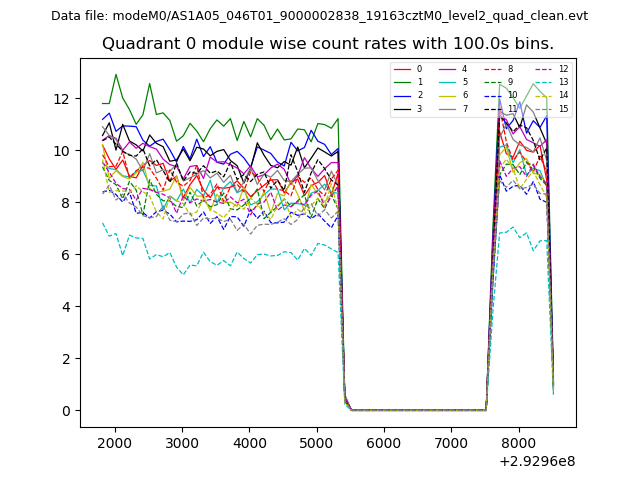
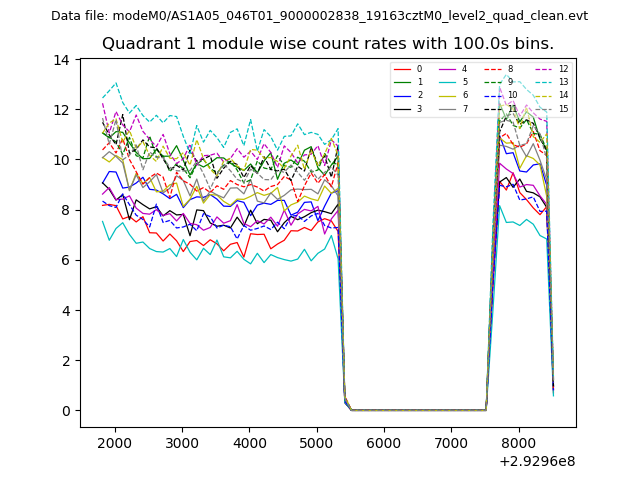
| Module-wise count rates for Quadrant A Data is divided into 100 sec bins |
 |
 |
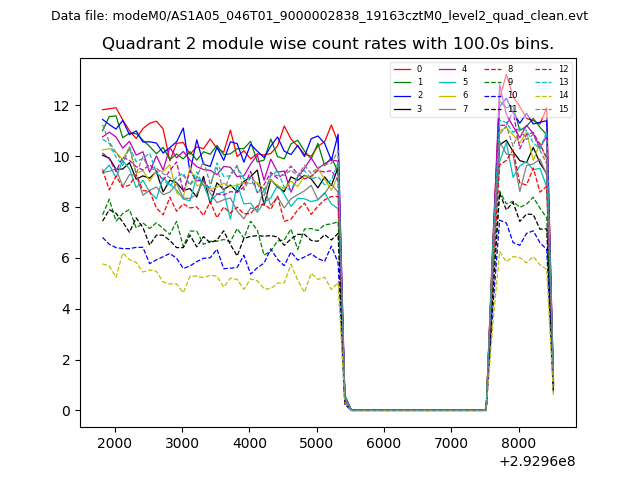
| Module-wise count rates for Quadrant B Data is divided into 100 sec bins |
 |
 |
| Module-wise count rates for Quadrant C Data is divided into 100 sec bins |
 |
 |
| Module-wise count rates for Quadrant D Data is divided into 100 sec bins |
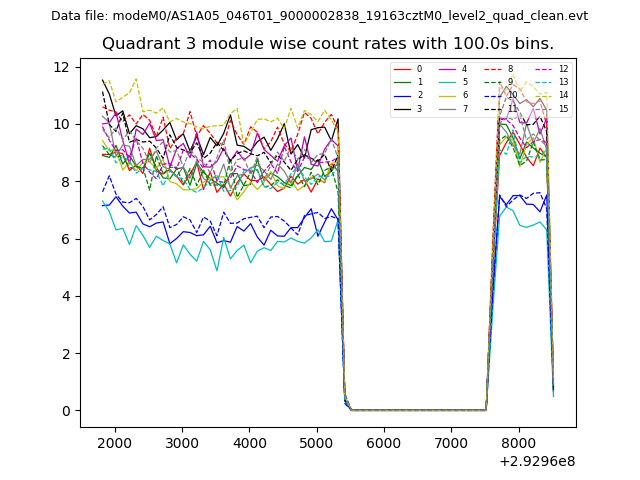 |
 |
| Parameter | Plot |
|---|---|
| CZT HV Monitor | 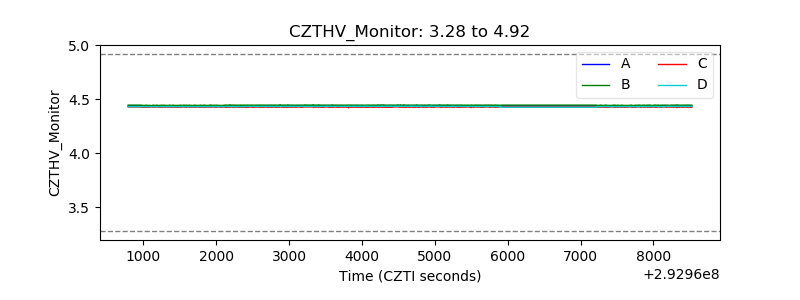 |
| D_VDD | 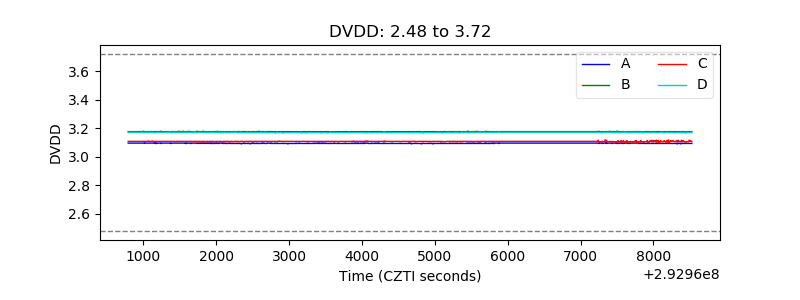 |
| Temperature 1 | 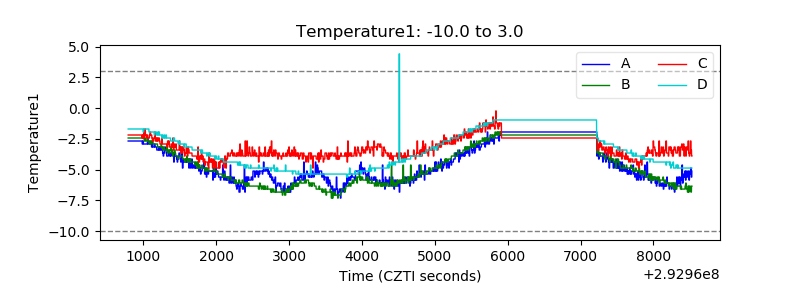 |
| Veto HV Monitor | 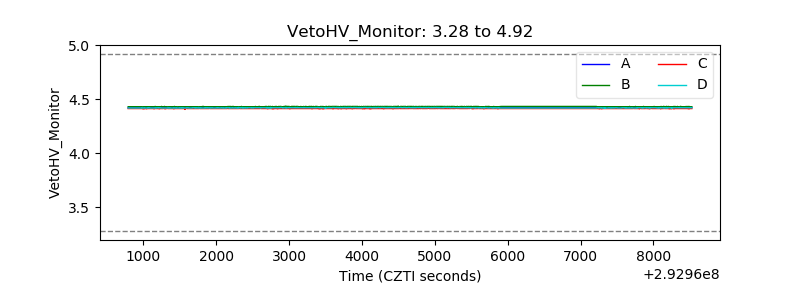 |
| Veto LLD | 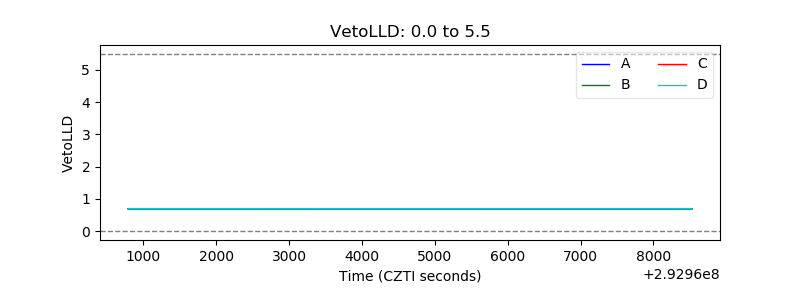 |
| Alpha Counter | 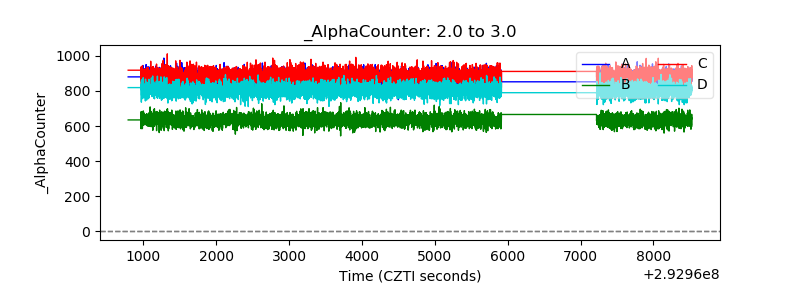 |
| _CPM_Rate | 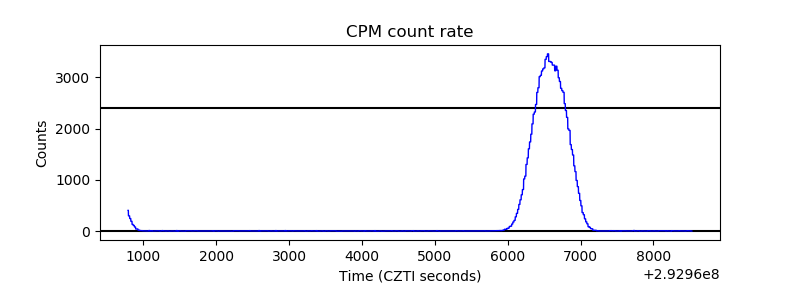 |
| CZT Counter | 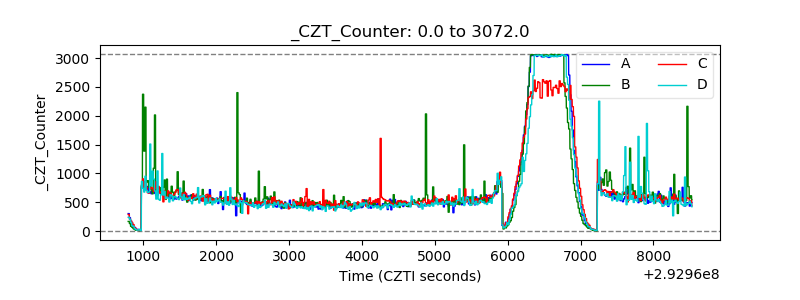 |
| +2.5 Volts monitor |  |
| +5 Volts monitor |  |
| _ROLL_ROT | 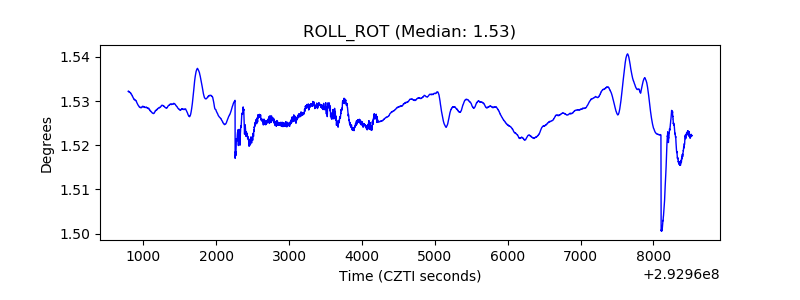 |
| _Roll_DEC | 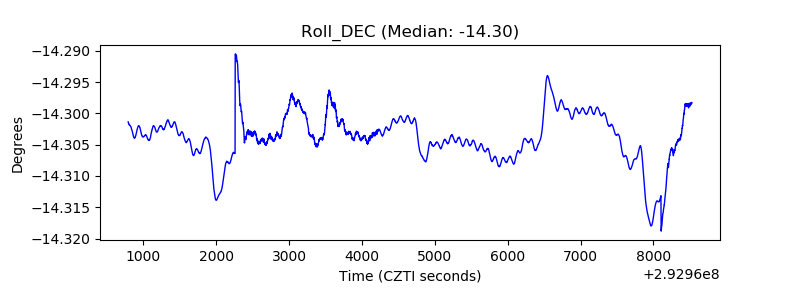 |
| _Roll_RA | 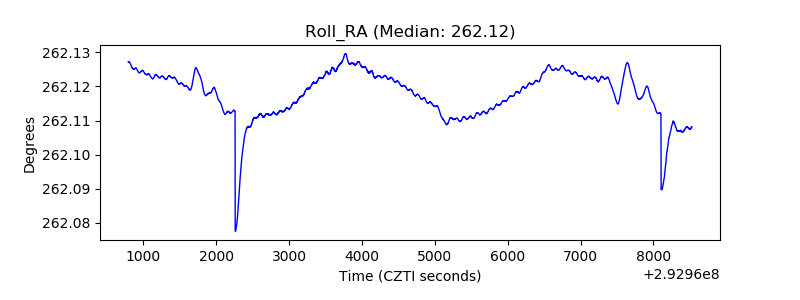 |
| Veto Counter | 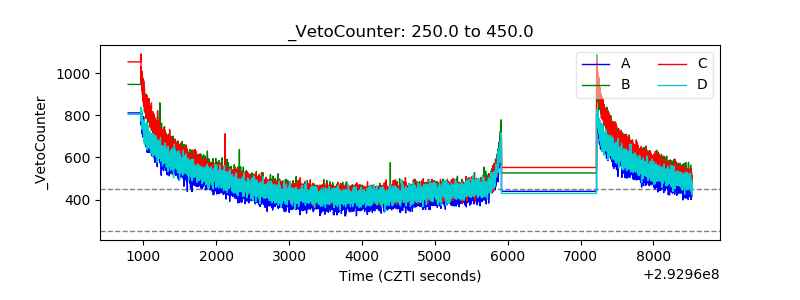 |