| Param | Original file | Final file |
|---|---|---|
| Filename | modeM0/AS1A05_046T01_9000002838_19164cztM0_level2.evt | modeM0/AS1A05_046T01_9000002838_19164cztM0_level2_quad_clean.evt |
| Size (bytes) | 463,210,560 | 105,338,880 |
| Size | 441.8 MB | 100.5 MB |
| Events in quadrant A | 3,117,584 | 692,517 |
| Events in quadrant B | 3,618,702 | 718,005 |
| Events in quadrant C | 3,585,413 | 691,096 |
| Events in quadrant D | 3,293,809 | 664,072 |
| Mode M0 | |||
|---|---|---|---|
| Quadrant | BADHDUFLAG | Total packets | Discarded packets |
| A | 0 | 13039 | 2 |
| B | 0 | 14589 | 2 |
| C | 0 | 14472 | 2 |
| D | 0 | 13760 | 2 |
| Mode SS | |||
|---|---|---|---|
| Quadrant | BADHDUFLAG | Total packets | Discarded packets |
| A | 0 | 124 | 0 |
| B | 0 | 124 | 0 |
| C | 0 | 124 | 0 |
| D | 0 | 124 | 0 |
| Mode M9 | |||
|---|---|---|---|
| Quadrant | BADHDUFLAG | Total packets | Discarded packets |
| A | 0 | 13 | 0 |
| B | 0 | 14 | 0 |
| C | 0 | 14 | 0 |
| D | 0 | 14 | 0 |
| Quadrant | Total seconds | Saturated seconds | Saturation percentage |
|---|---|---|---|
| A | 6080 | 31 | 0.509868% |
| B | 6080 | 151 | 2.483553% |
| C | 6079 | 104 | 1.710808% |
| D | 6079 | 79 | 1.299556% |
Noise dominated data is calculated using 1-second bins in cleaned event files. If a bin has >2000 counts, and if more than 50% of those come from <1% of pixels, then it is considered to be noise-dominated and hence unusable.
| Quadrant | # 1 sec bins | Bins with >0 counts | Bins with >2000 counts | High rate bins dominated by noise | Noise dominated (total time) | Noise dominated (detector-on time) | Marked lightcurve |
|---|---|---|---|---|---|---|---|
| A | 7445 | 6081 | 0 | 0 | 0.00% | 0.00% | 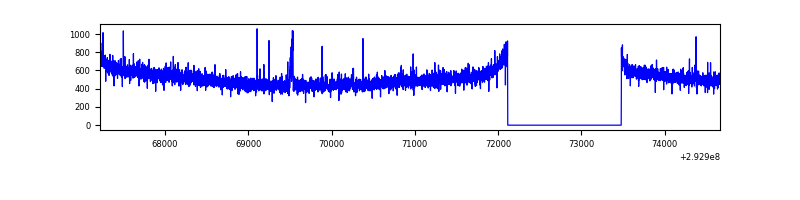 |
| B | 7445 | 6081 | 55 | 55 | 0.74% | 0.90% | 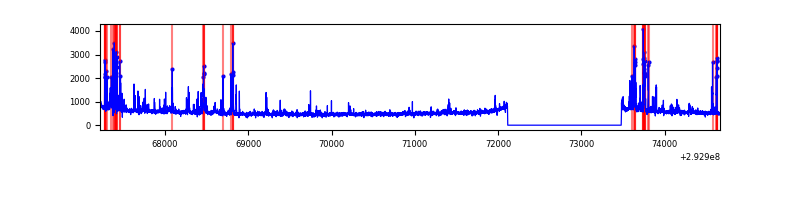 |
| C | 7444 | 6080 | 9 | 9 | 0.12% | 0.15% | 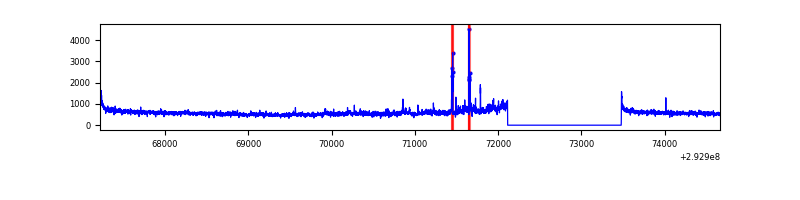 |
| D | 7444 | 6080 | 62 | 62 | 0.83% | 1.02% | 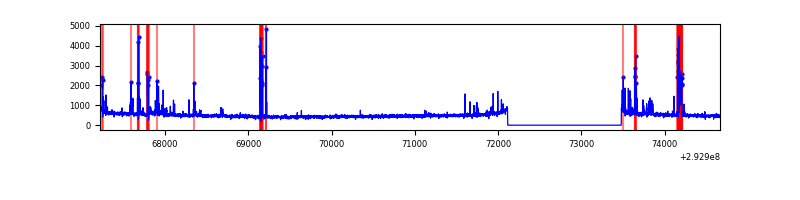 |
Top three noisy pixels from each quadrant. If the there are fewer than three noisy pixels in the level2.evt file, extra rows are filled as -1
| Pixel properties | Quadrant properties | ||||||
|---|---|---|---|---|---|---|---|
| Quadrant | DetID | PixID | Counts | Sigma | Mean | Median | Sigma |
| A | 11 | 47 | 22151 | 132.49 | 801 | 786 | 161.3 |
| A | 13 | 254 | 7779 | 43.36 | 801 | 786 | 161.3 |
| A | 0 | 226 | 7164 | 39.55 | 801 | 786 | 161.3 |
| B | 3 | 112 | 362060 | 2400.04 | 807 | 789 | 150.5 |
| B | 7 | 220 | 56552 | 370.45 | 807 | 789 | 150.5 |
| B | 0 | 197 | 22789 | 146.15 | 807 | 789 | 150.5 |
| C | 3 | 233 | 391435 | 2138.17 | 783 | 792 | 182.7 |
| C | 14 | 238 | 123269 | 670.37 | 783 | 792 | 182.7 |
| C | 8 | 128 | 11483 | 58.52 | 783 | 792 | 182.7 |
| D | 11 | 176 | 339599 | 1808.85 | 779 | 758 | 187.3 |
| D | 2 | 234 | 28963 | 150.57 | 779 | 758 | 187.3 |
| D | 1 | 52 | 8632 | 42.03 | 779 | 758 | 187.3 |
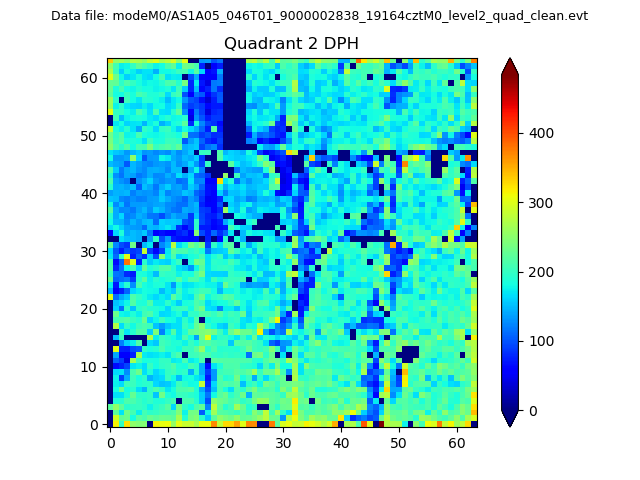
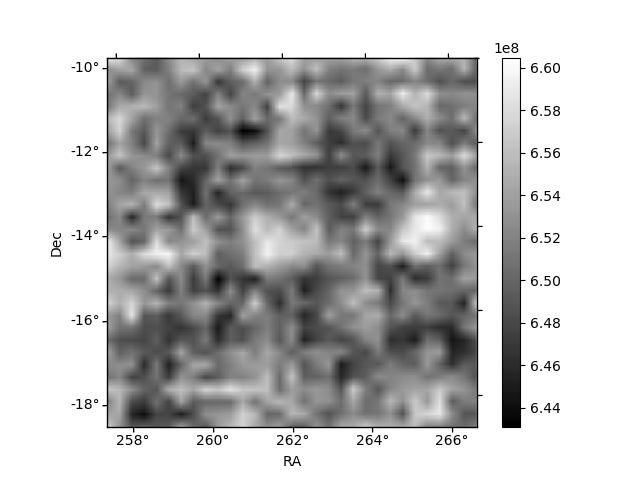
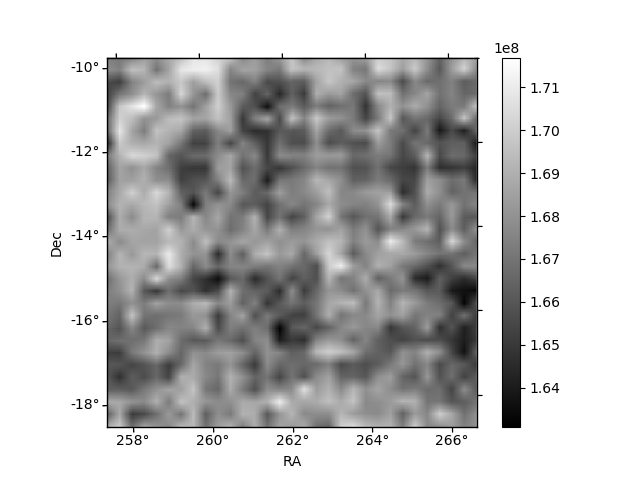
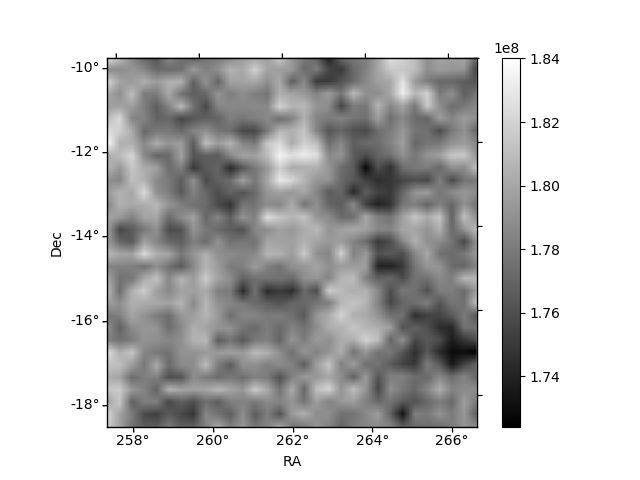
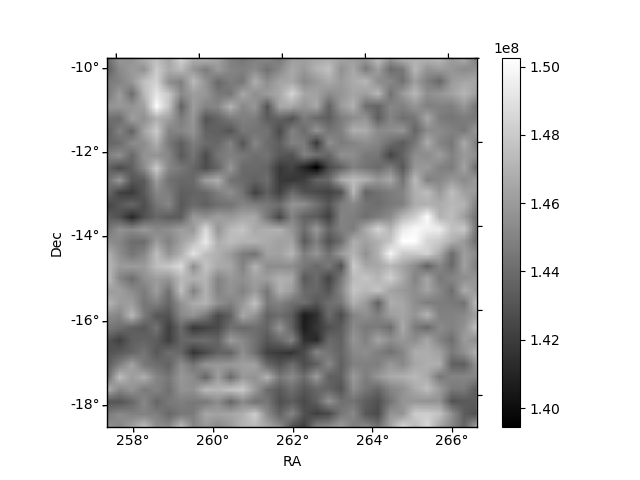
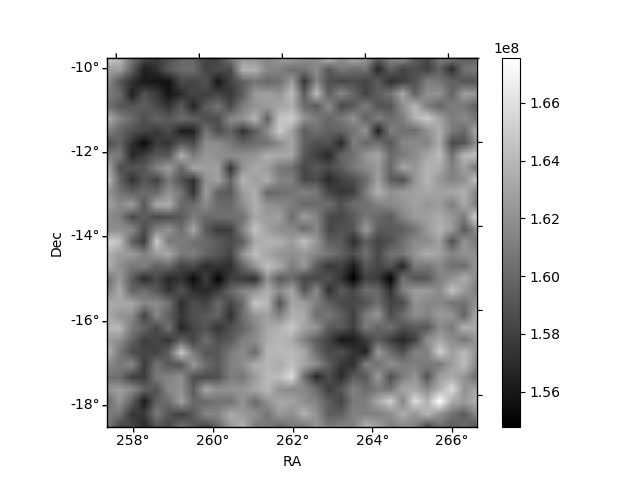
Histogram calculated using DETX and DETY for each event in the final _common_clean file
| Quadrant A | 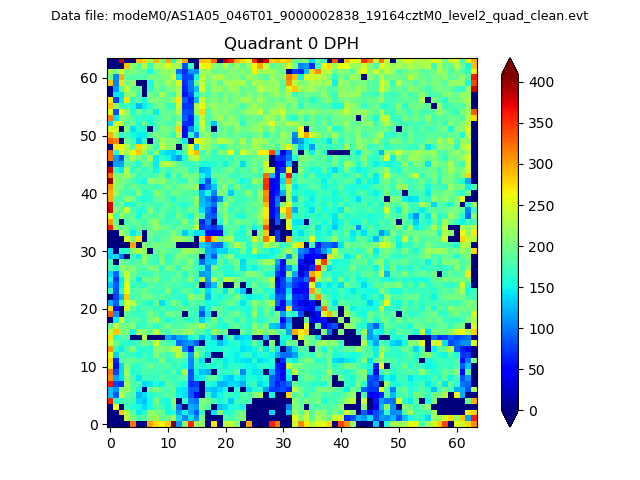 |
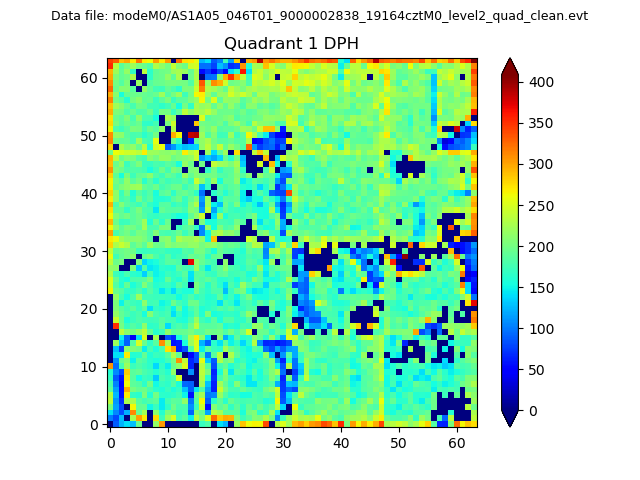 |
Quadrant B |
|---|---|---|---|
| Quadrant D | 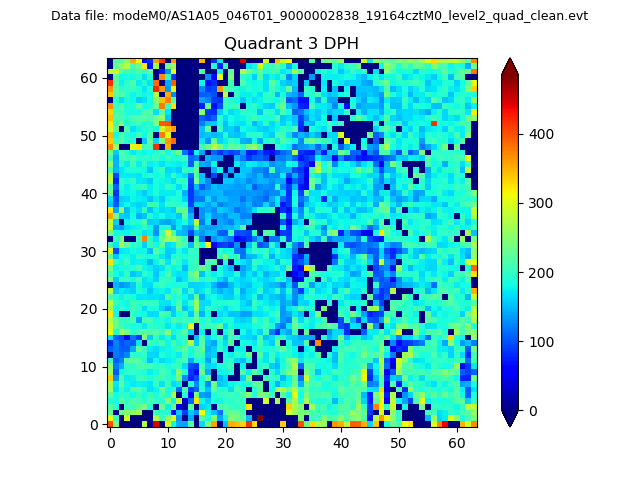 |
 |
Quadrant C |
| Plot type | Count rate plots | Images |
|---|---|---|
| Comparison with Poisson distribution Blue bars denote a histogram of data divided into 1 sec bins. Red curve is a Poisson curve with rate = median count rate of data. |
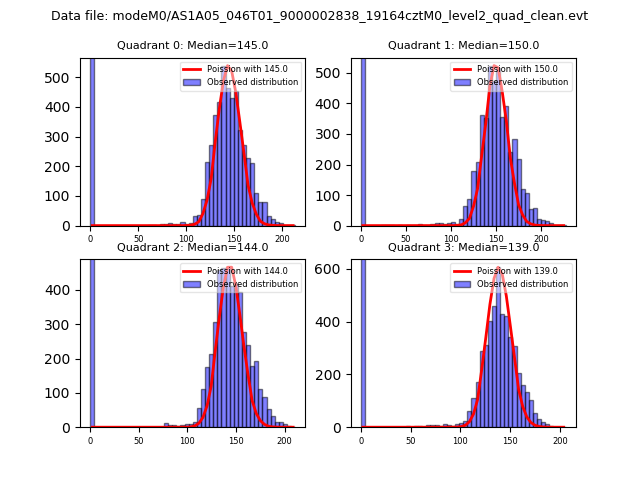 |
 |
| Quadrant-wise count rates Data is divided into 100 sec bins |
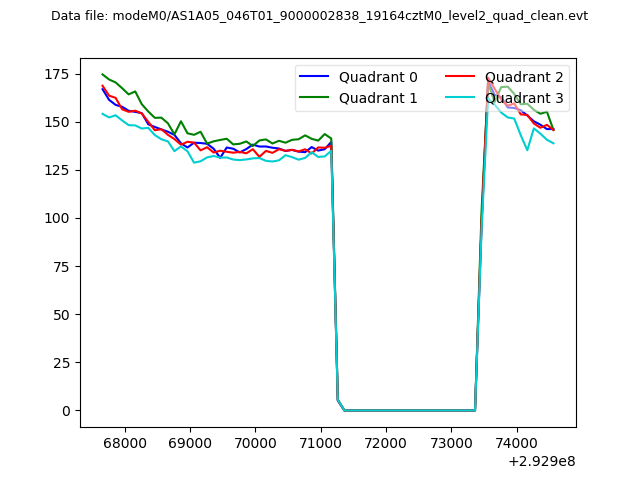 |
|
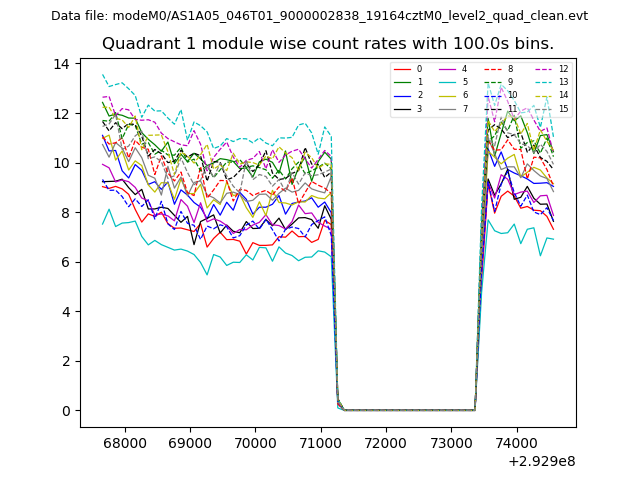
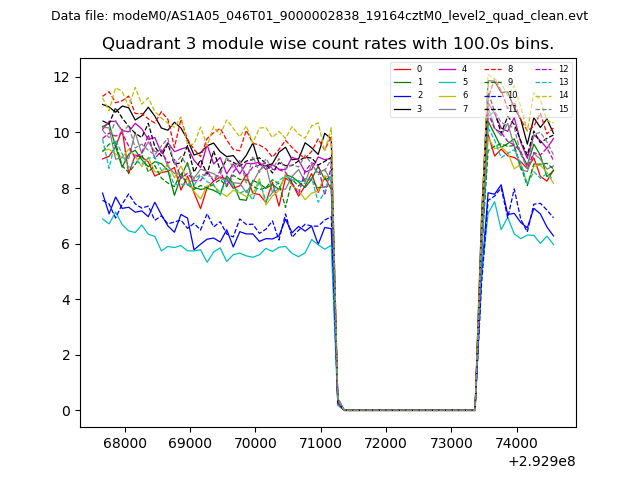
| Module-wise count rates for Quadrant A Data is divided into 100 sec bins |
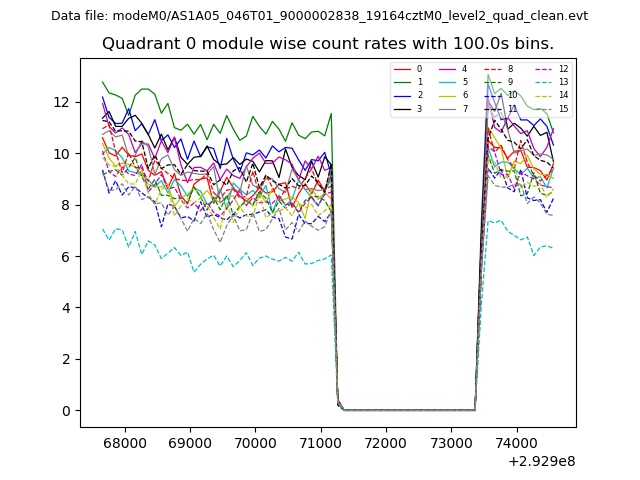 |
 |
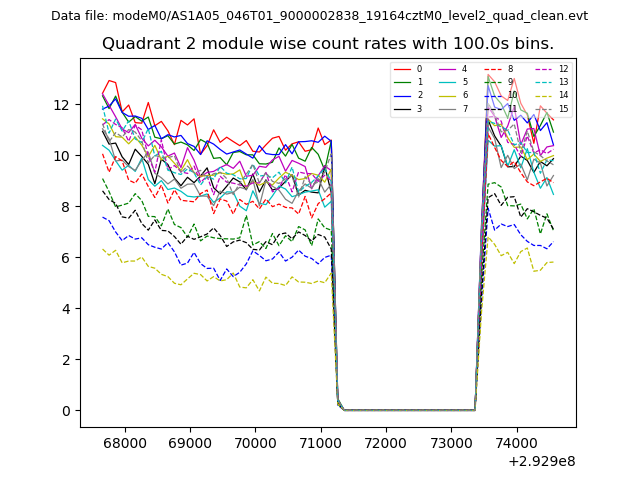
| Module-wise count rates for Quadrant B Data is divided into 100 sec bins |
 |
 |
| Module-wise count rates for Quadrant C Data is divided into 100 sec bins |
 |
 |
| Module-wise count rates for Quadrant D Data is divided into 100 sec bins |
 |
 |
| Parameter | Plot |
|---|---|
| CZT HV Monitor | 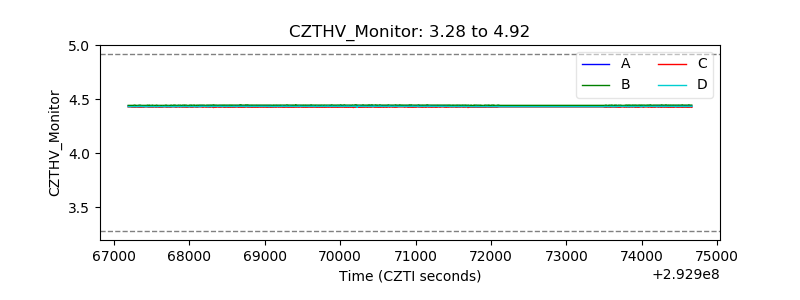 |
| D_VDD | 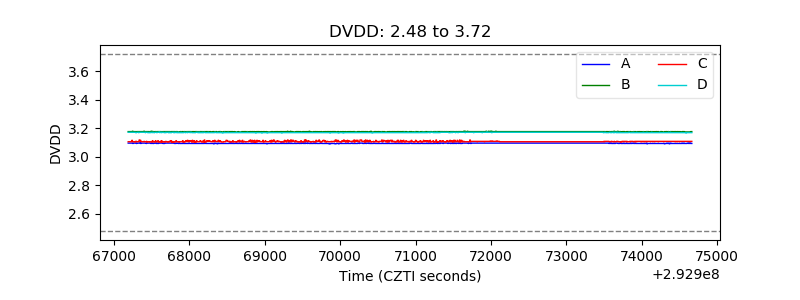 |
| Temperature 1 | 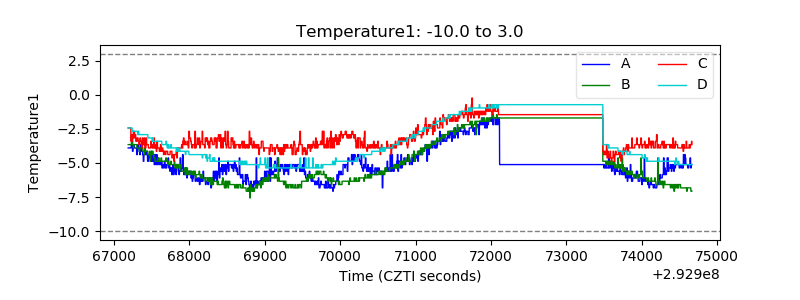 |
| Veto HV Monitor | 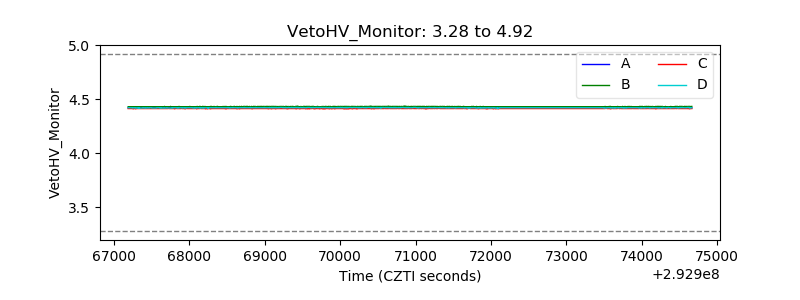 |
| Veto LLD | 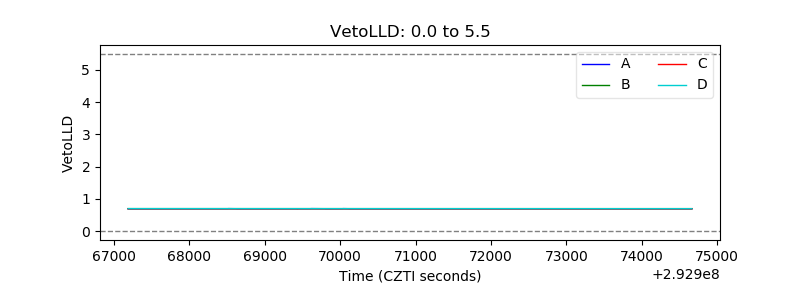 |
| Alpha Counter | 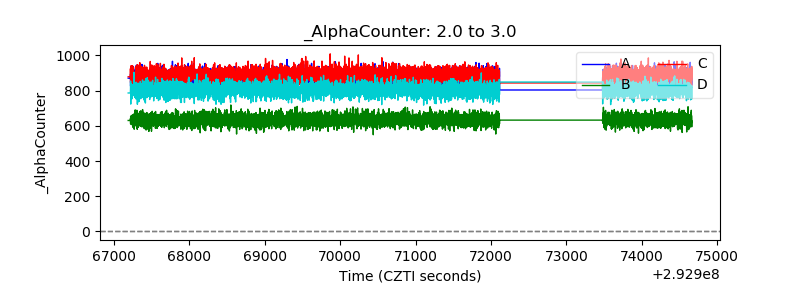 |
| _CPM_Rate | 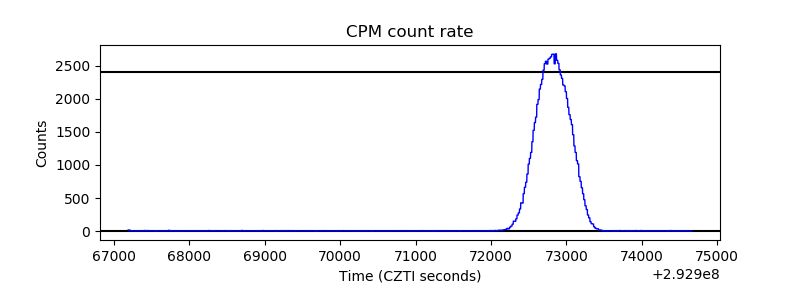 |
| CZT Counter | 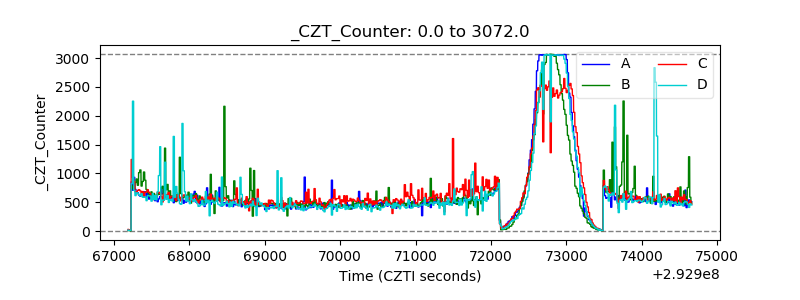 |
| +2.5 Volts monitor |  |
| +5 Volts monitor |  |
| _ROLL_ROT | 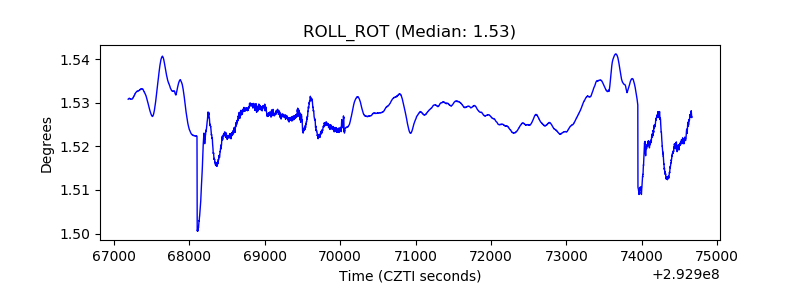 |
| _Roll_DEC | 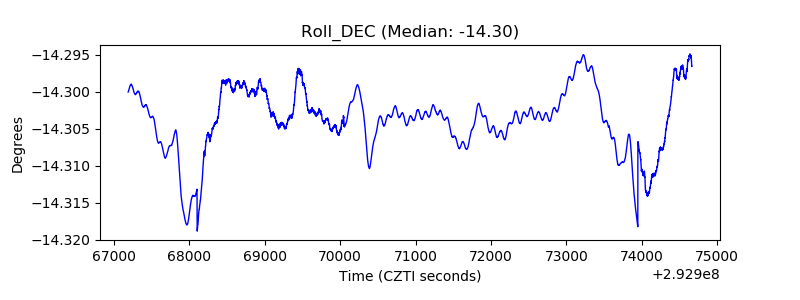 |
| _Roll_RA | 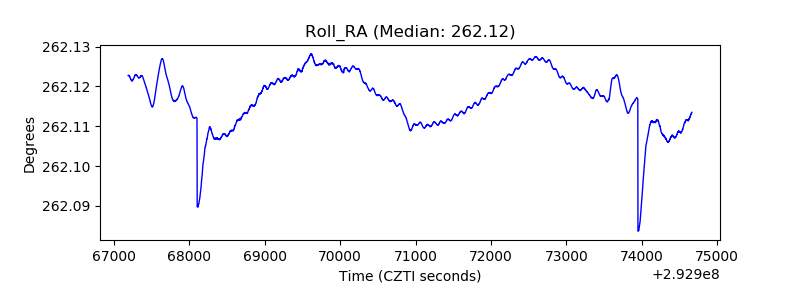 |
| Veto Counter | 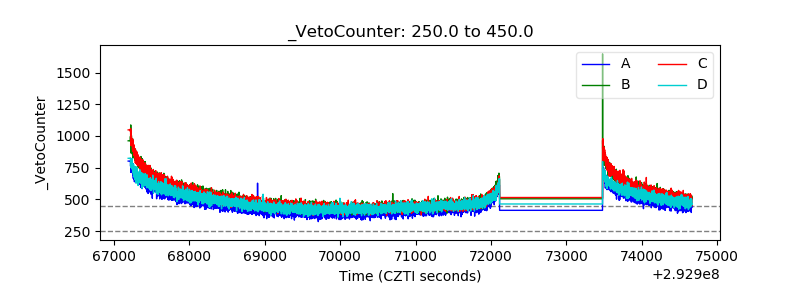 |