| Param | Original file | Final file |
|---|---|---|
| Filename | modeM0/AS1A05_046T01_9000002838_19165cztM0_level2.evt | modeM0/AS1A05_046T01_9000002838_19165cztM0_level2_quad_clean.evt |
| Size (bytes) | 478,408,320 | 106,099,200 |
| Size | 456.2 MB | 101.2 MB |
| Events in quadrant A | 3,252,674 | 690,271 |
| Events in quadrant B | 3,645,668 | 715,162 |
| Events in quadrant C | 3,782,015 | 692,544 |
| Events in quadrant D | 3,369,186 | 664,408 |
| Mode M0 | |||
|---|---|---|---|
| Quadrant | BADHDUFLAG | Total packets | Discarded packets |
| A | 0 | 13738 | 2 |
| B | 0 | 14839 | 2 |
| C | 0 | 15236 | 2 |
| D | 0 | 14312 | 2 |
| Mode SS | |||
|---|---|---|---|
| Quadrant | BADHDUFLAG | Total packets | Discarded packets |
| A | 0 | 134 | 0 |
| B | 0 | 134 | 0 |
| C | 0 | 134 | 0 |
| D | 0 | 134 | 0 |
| Mode M9 | |||
|---|---|---|---|
| Quadrant | BADHDUFLAG | Total packets | Discarded packets |
| A | 0 | 26 | 0 |
| B | 0 | 26 | 0 |
| C | 0 | 26 | 0 |
| D | 0 | 26 | 0 |
| Quadrant | Total seconds | Saturated seconds | Saturation percentage |
|---|---|---|---|
| A | 6463 | 53 | 0.820053% |
| B | 6462 | 171 | 2.646240% |
| C | 6462 | 166 | 2.568864% |
| D | 6462 | 63 | 0.974930% |
Noise dominated data is calculated using 1-second bins in cleaned event files. If a bin has >2000 counts, and if more than 50% of those come from <1% of pixels, then it is considered to be noise-dominated and hence unusable.
| Quadrant | # 1 sec bins | Bins with >0 counts | Bins with >2000 counts | High rate bins dominated by noise | Noise dominated (total time) | Noise dominated (detector-on time) | Marked lightcurve |
|---|---|---|---|---|---|---|---|
| A | 9088 | 6465 | 0 | 0 | 0.00% | 0.00% | 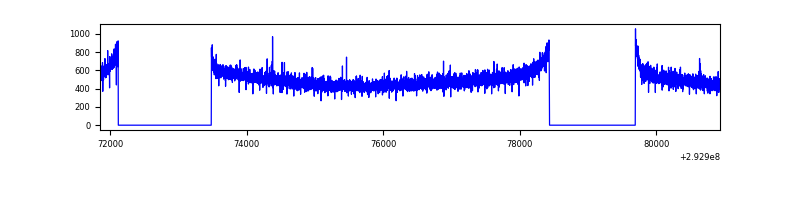 |
| B | 9087 | 6464 | 30 | 30 | 0.33% | 0.46% | 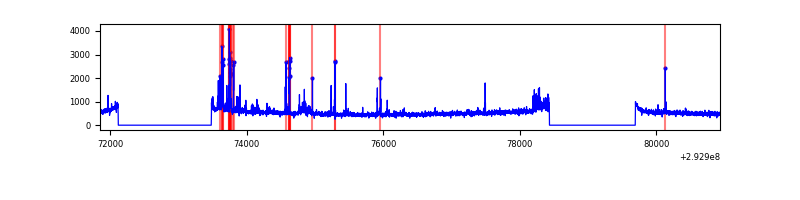 |
| C | 9087 | 6464 | 15 | 15 | 0.17% | 0.23% | 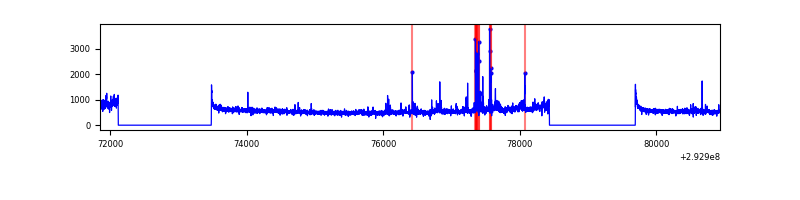 |
| D | 9087 | 6464 | 41 | 41 | 0.45% | 0.63% | 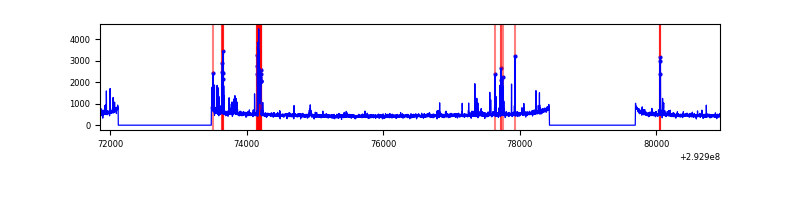 |
Top three noisy pixels from each quadrant. If the there are fewer than three noisy pixels in the level2.evt file, extra rows are filled as -1
| Pixel properties | Quadrant properties | ||||||
|---|---|---|---|---|---|---|---|
| Quadrant | DetID | PixID | Counts | Sigma | Mean | Median | Sigma |
| A | 8 | 205 | 9106 | 49.08 | 841 | 825 | 168.7 |
| A | 13 | 254 | 8921 | 47.98 | 841 | 825 | 168.7 |
| A | 0 | 226 | 7419 | 39.08 | 841 | 825 | 168.7 |
| B | 3 | 112 | 245860 | 1522.99 | 846 | 826 | 160.9 |
| B | 7 | 220 | 37791 | 229.75 | 846 | 826 | 160.9 |
| B | 10 | 245 | 29019 | 175.23 | 846 | 826 | 160.9 |
| C | 3 | 233 | 461875 | 2415.04 | 819 | 828 | 190.9 |
| C | 14 | 238 | 127189 | 661.9 | 819 | 828 | 190.9 |
| C | 13 | 61 | 5838 | 26.24 | 819 | 828 | 190.9 |
| D | 11 | 176 | 241248 | 1204.77 | 820 | 796 | 199.6 |
| D | 2 | 234 | 26993 | 131.26 | 820 | 796 | 199.6 |
| D | 7 | 96 | 22778 | 110.14 | 820 | 796 | 199.6 |
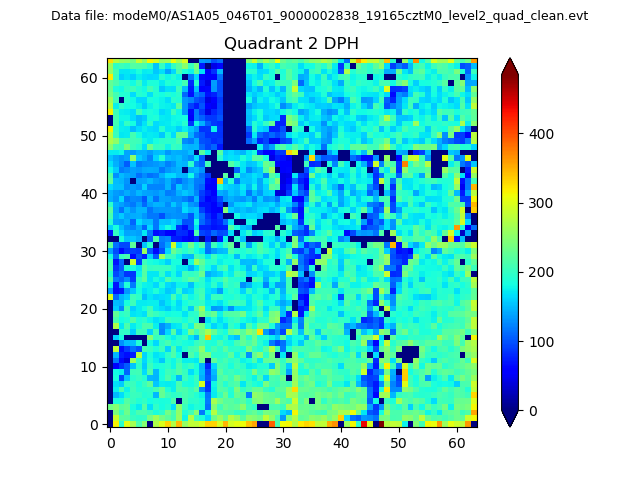
Histogram calculated using DETX and DETY for each event in the final _common_clean file
| Quadrant A | 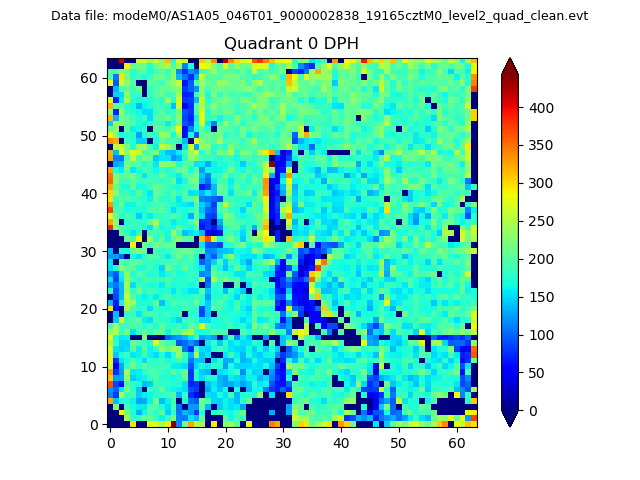 |
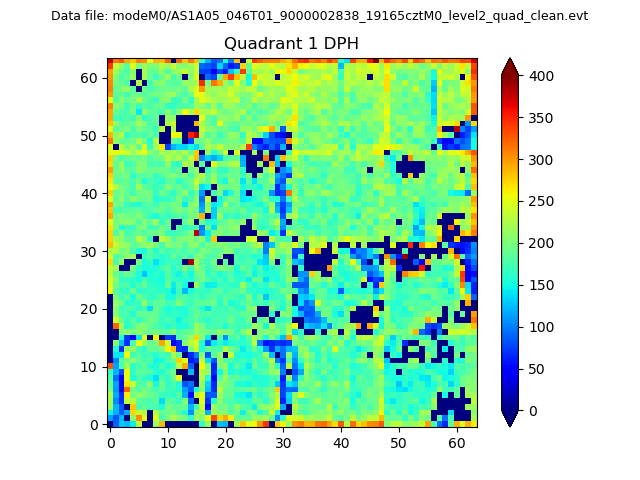 |
Quadrant B |
|---|---|---|---|
| Quadrant D | 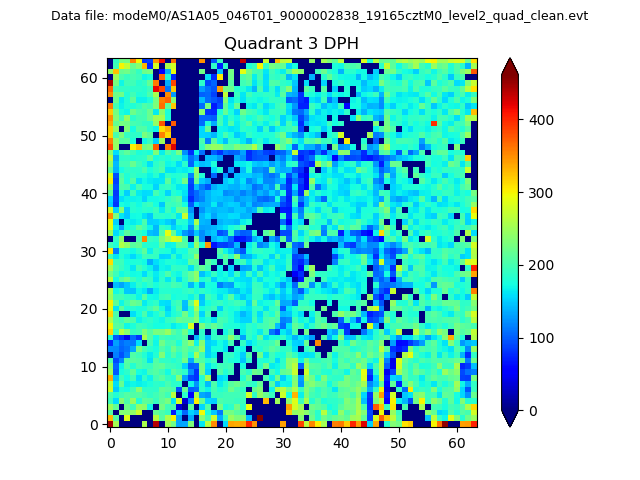 |
 |
Quadrant C |
| Plot type | Count rate plots | Images |
|---|---|---|
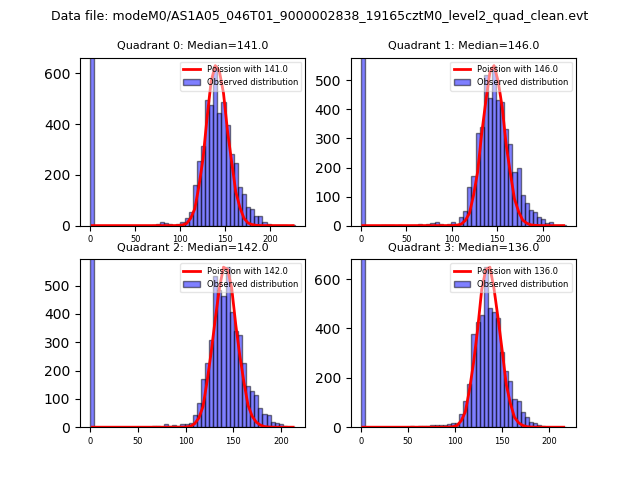
| Comparison with Poisson distribution Blue bars denote a histogram of data divided into 1 sec bins. Red curve is a Poisson curve with rate = median count rate of data. |
 |
 |
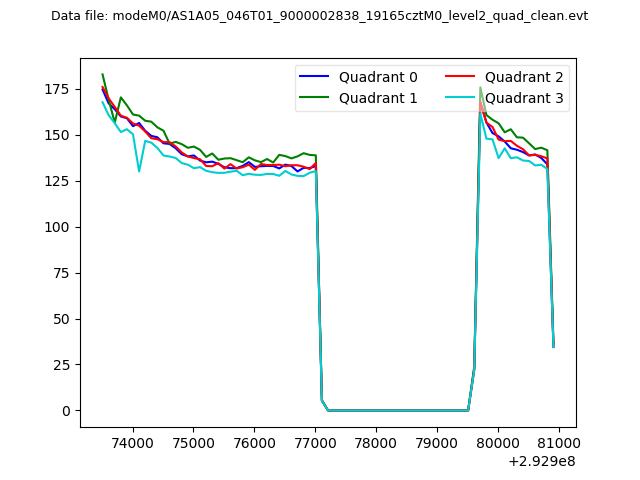
| Quadrant-wise count rates Data is divided into 100 sec bins |
 |
|
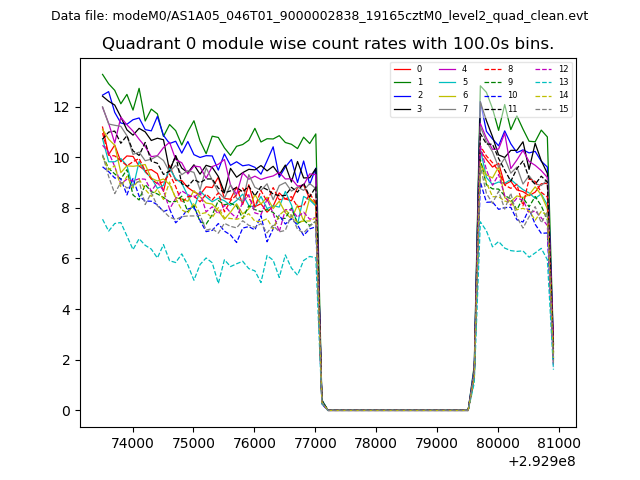
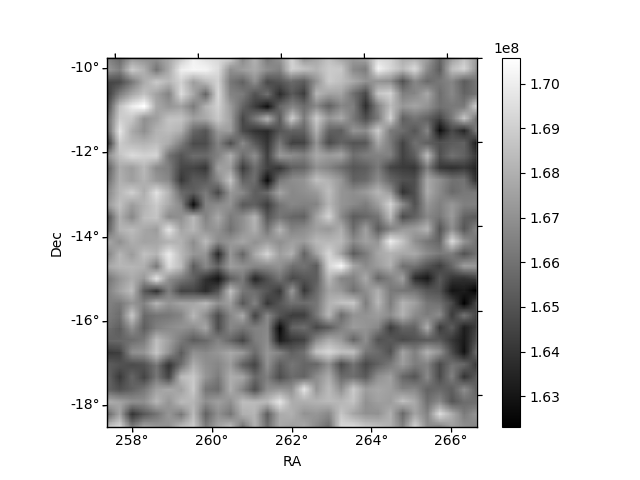
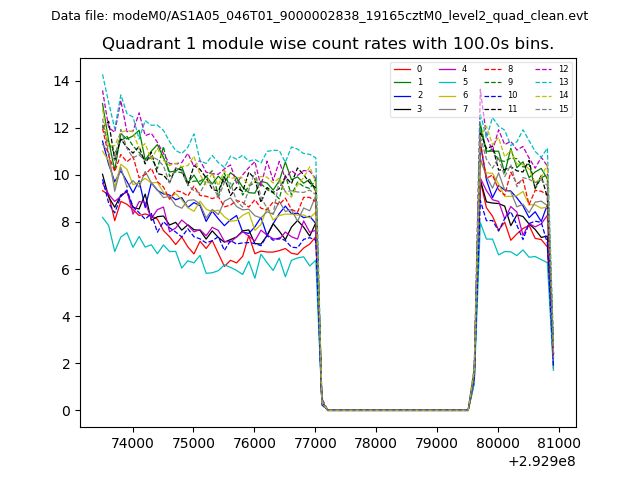
| Module-wise count rates for Quadrant A Data is divided into 100 sec bins |
 |
 |
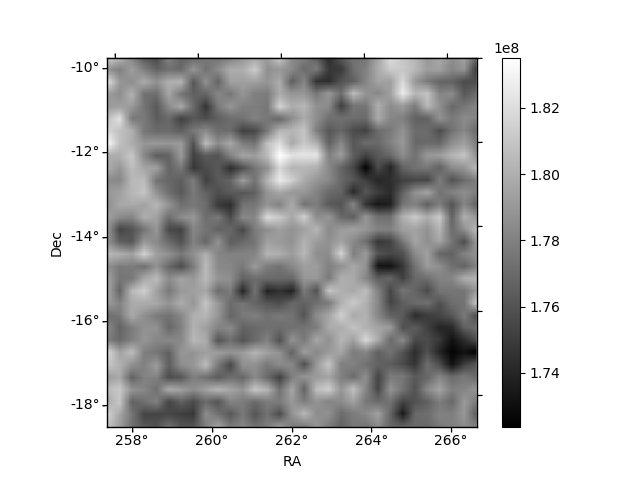
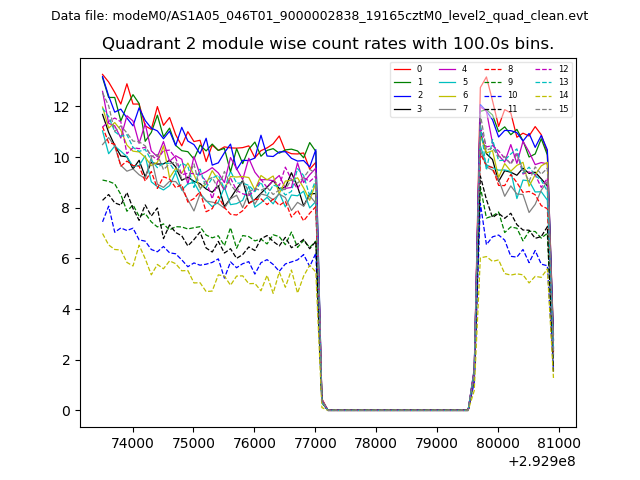
| Module-wise count rates for Quadrant B Data is divided into 100 sec bins |
 |
 |
| Module-wise count rates for Quadrant C Data is divided into 100 sec bins |
 |
 |
| Module-wise count rates for Quadrant D Data is divided into 100 sec bins |
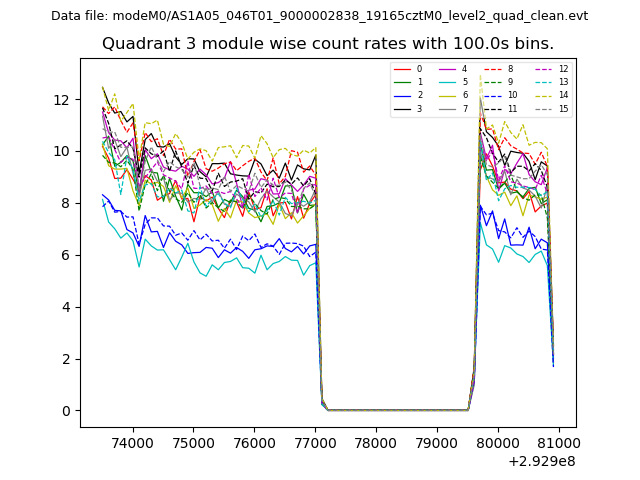 |
 |
| Parameter | Plot |
|---|---|
| CZT HV Monitor | 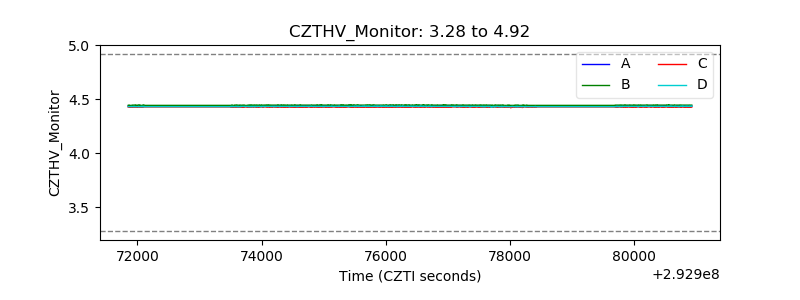 |
| D_VDD | 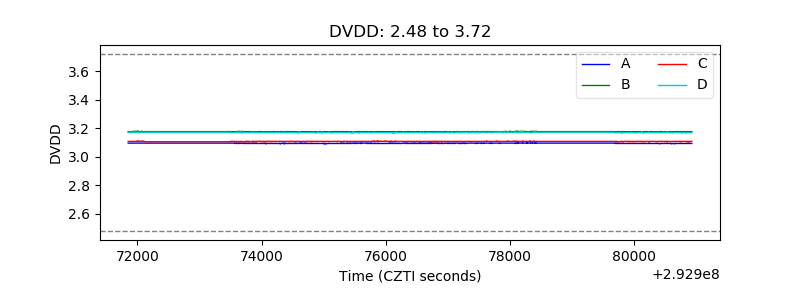 |
| Temperature 1 | 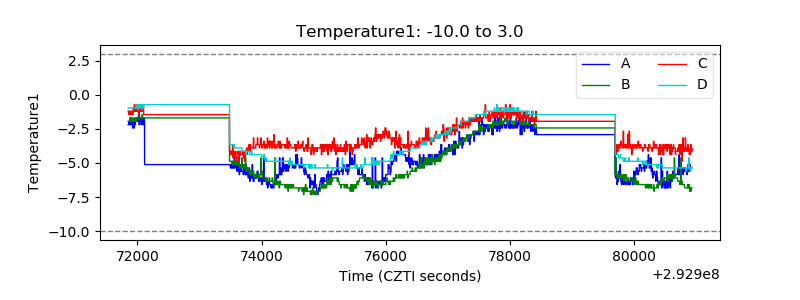 |
| Veto HV Monitor | 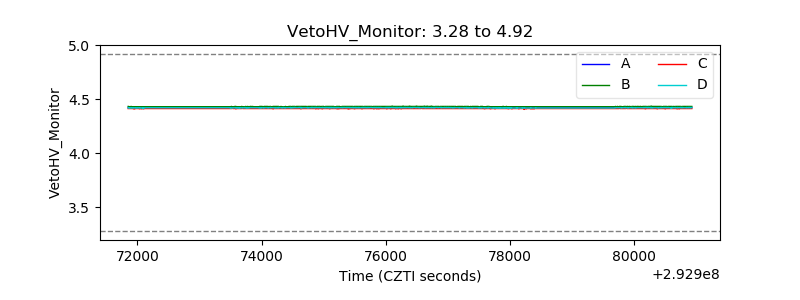 |
| Veto LLD | 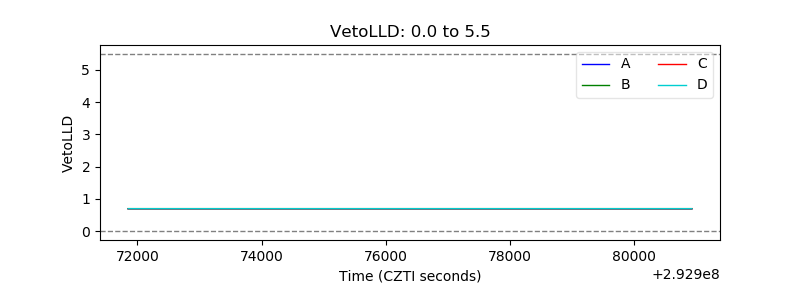 |
| Alpha Counter | 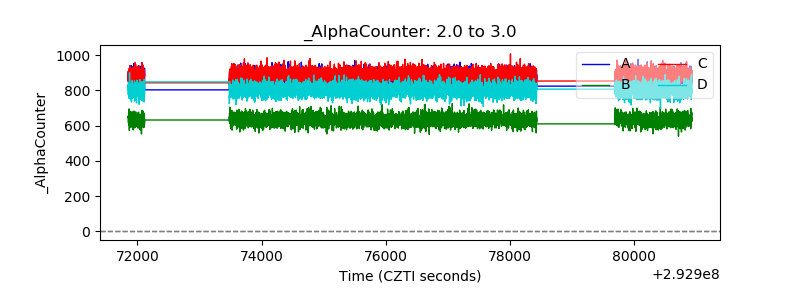 |
| _CPM_Rate | 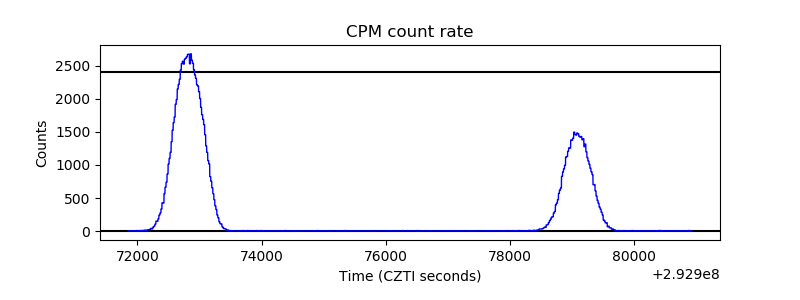 |
| CZT Counter | 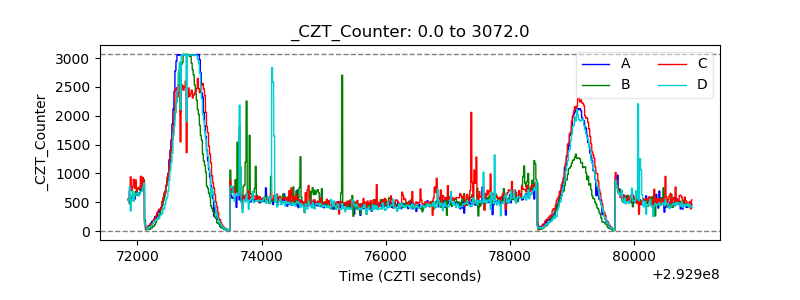 |
| +2.5 Volts monitor |  |
| +5 Volts monitor | 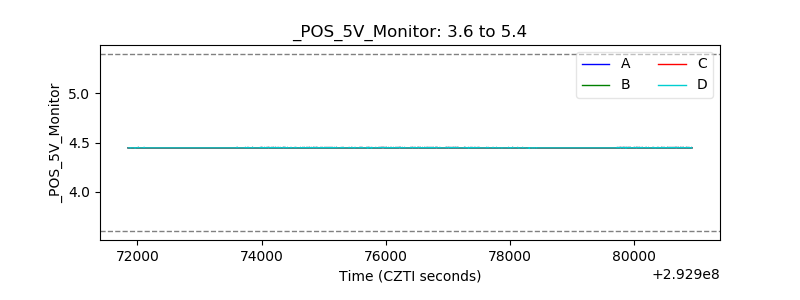 |
| _ROLL_ROT | 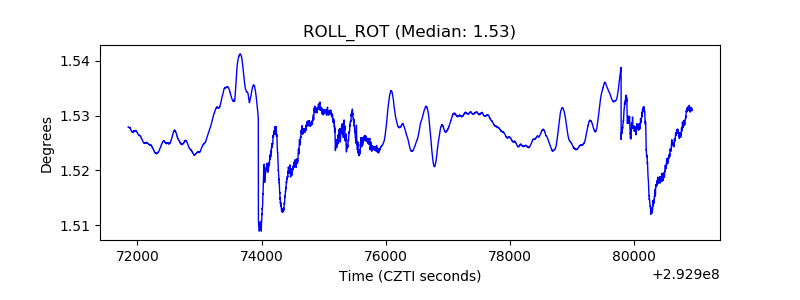 |
| _Roll_DEC | 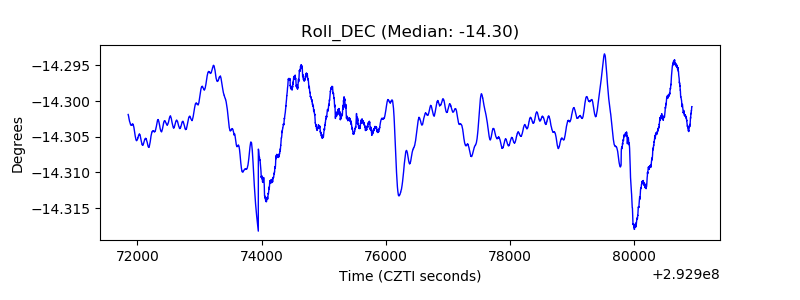 |
| _Roll_RA | 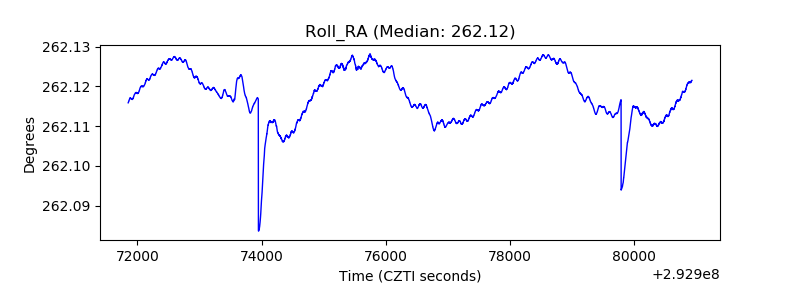 |
| Veto Counter | 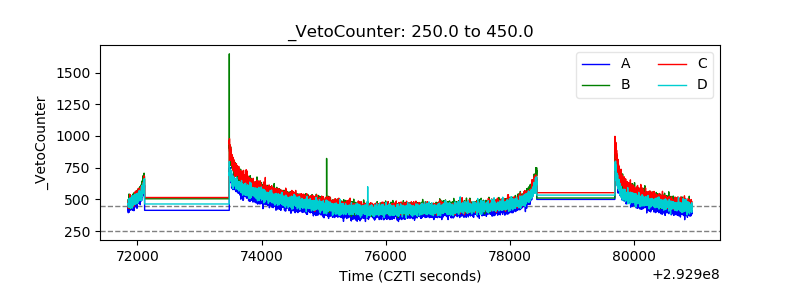 |