| Param | Original file | Final file |
|---|---|---|
| Filename | modeM0/AS1A05_046T01_9000002838_19166cztM0_level2.evt | modeM0/AS1A05_046T01_9000002838_19166cztM0_level2_quad_clean.evt |
| Size (bytes) | 457,629,120 | 97,770,240 |
| Size | 436.4 MB | 93.2 MB |
| Events in quadrant A | 3,152,695 | 623,898 |
| Events in quadrant B | 3,346,380 | 647,422 |
| Events in quadrant C | 3,665,560 | 627,751 |
| Events in quadrant D | 3,250,721 | 606,171 |
| Mode M0 | |||
|---|---|---|---|
| Quadrant | BADHDUFLAG | Total packets | Discarded packets |
| A | 0 | 13585 | 2 |
| B | 0 | 14102 | 2 |
| C | 0 | 14947 | 2 |
| D | 0 | 14254 | 2 |
| Mode SS | |||
|---|---|---|---|
| Quadrant | BADHDUFLAG | Total packets | Discarded packets |
| A | 0 | 132 | 0 |
| B | 0 | 132 | 0 |
| C | 0 | 132 | 0 |
| D | 0 | 132 | 0 |
| Mode M9 | |||
|---|---|---|---|
| Quadrant | BADHDUFLAG | Total packets | Discarded packets |
| A | 0 | 22 | 0 |
| B | 0 | 23 | 0 |
| C | 0 | 23 | 0 |
| D | 0 | 23 | 0 |
| Quadrant | Total seconds | Saturated seconds | Saturation percentage |
|---|---|---|---|
| A | 6538 | 26 | 0.397675% |
| B | 6538 | 85 | 1.300092% |
| C | 6538 | 99 | 1.514225% |
| D | 6538 | 26 | 0.397675% |
Noise dominated data is calculated using 1-second bins in cleaned event files. If a bin has >2000 counts, and if more than 50% of those come from <1% of pixels, then it is considered to be noise-dominated and hence unusable.
| Quadrant | # 1 sec bins | Bins with >0 counts | Bins with >2000 counts | High rate bins dominated by noise | Noise dominated (total time) | Noise dominated (detector-on time) | Marked lightcurve |
|---|---|---|---|---|---|---|---|
| A | 7603 | 6539 | 0 | 0 | 0.00% | 0.00% | 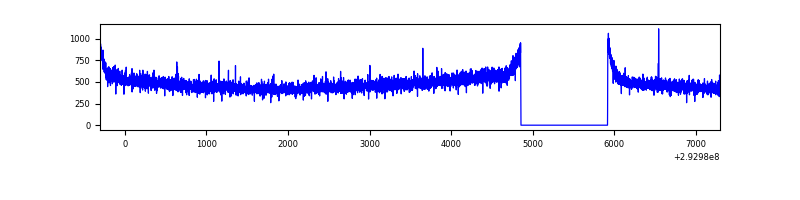 |
| B | 7603 | 6539 | 13 | 13 | 0.17% | 0.20% | 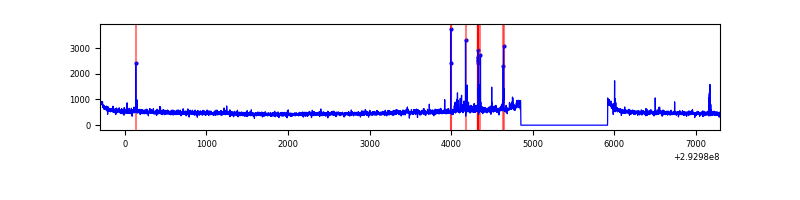 |
| C | 7603 | 6539 | 2 | 2 | 0.03% | 0.03% | 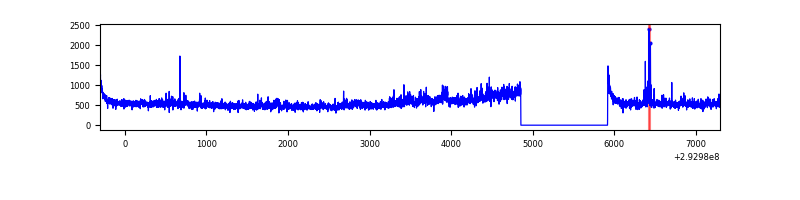 |
| D | 7603 | 6539 | 13 | 13 | 0.17% | 0.20% | 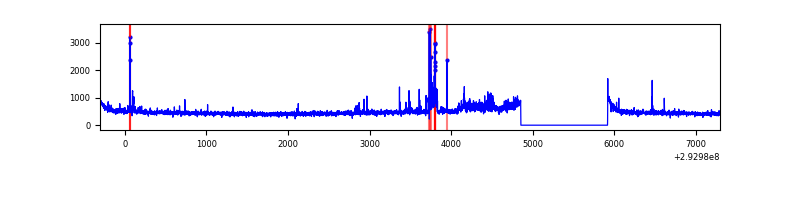 |
Top three noisy pixels from each quadrant. If the there are fewer than three noisy pixels in the level2.evt file, extra rows are filled as -1
| Pixel properties | Quadrant properties | ||||||
|---|---|---|---|---|---|---|---|
| Quadrant | DetID | PixID | Counts | Sigma | Mean | Median | Sigma |
| A | 13 | 254 | 9381 | 52.19 | 815 | 797 | 164.5 |
| A | 8 | 205 | 7833 | 42.78 | 815 | 797 | 164.5 |
| A | 0 | 226 | 7017 | 37.82 | 815 | 797 | 164.5 |
| B | 7 | 220 | 70084 | 440.67 | 822 | 800 | 157.2 |
| B | 0 | 190 | 20228 | 123.57 | 822 | 800 | 157.2 |
| B | 12 | 111 | 18689 | 113.78 | 822 | 800 | 157.2 |
| C | 3 | 233 | 435128 | 2321.36 | 796 | 803 | 187.1 |
| C | 14 | 238 | 122923 | 652.7 | 796 | 803 | 187.1 |
| C | 13 | 61 | 5609 | 25.69 | 796 | 803 | 187.1 |
| D | 11 | 176 | 124592 | 634.86 | 797 | 773 | 195.0 |
| D | 10 | 66 | 94085 | 478.44 | 797 | 773 | 195.0 |
| D | 2 | 234 | 27648 | 137.8 | 797 | 773 | 195.0 |
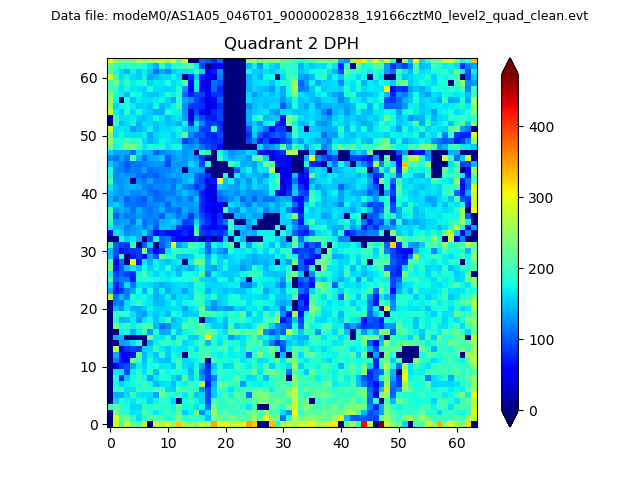
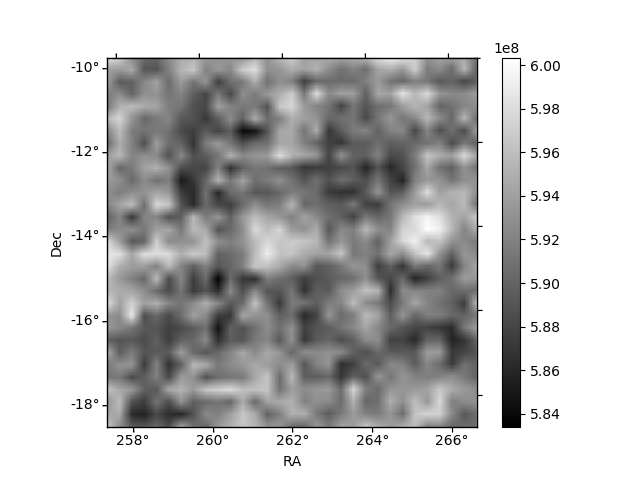
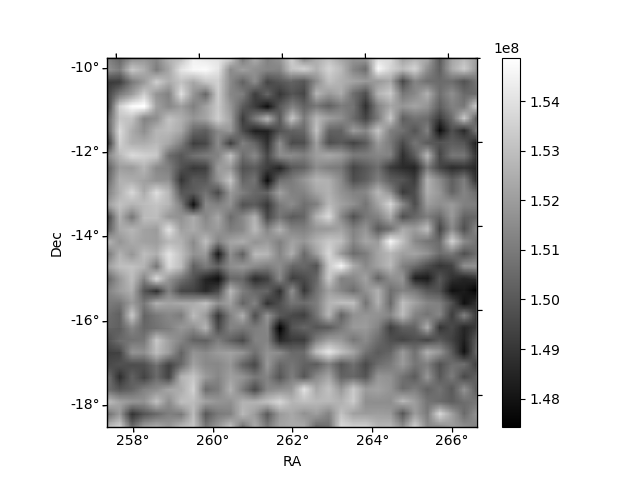
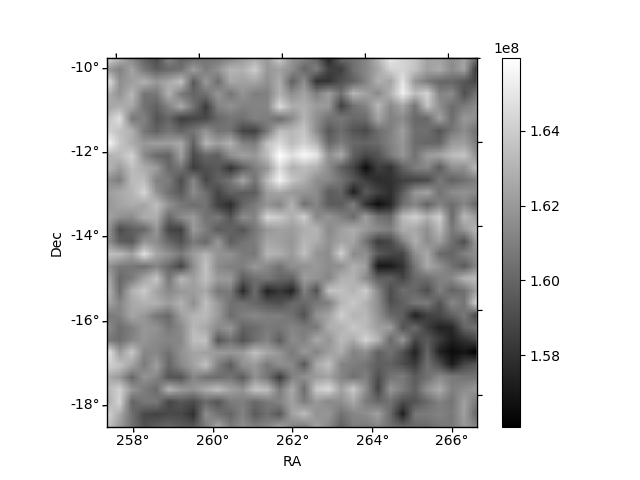
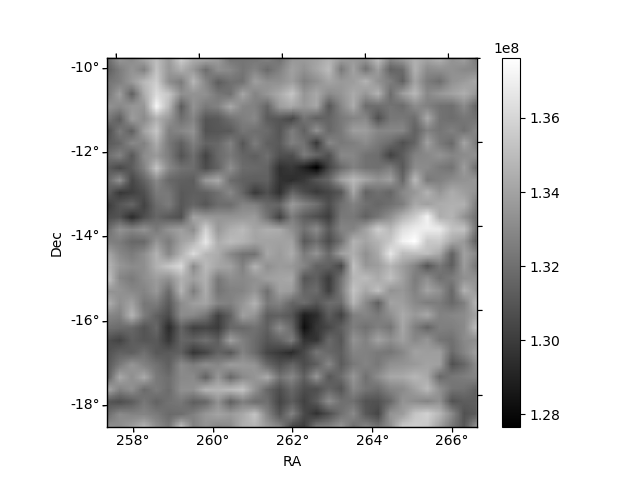
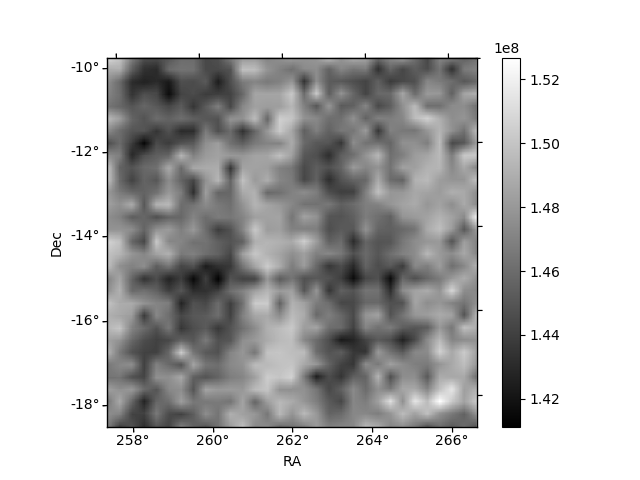
Histogram calculated using DETX and DETY for each event in the final _common_clean file
| Quadrant A | 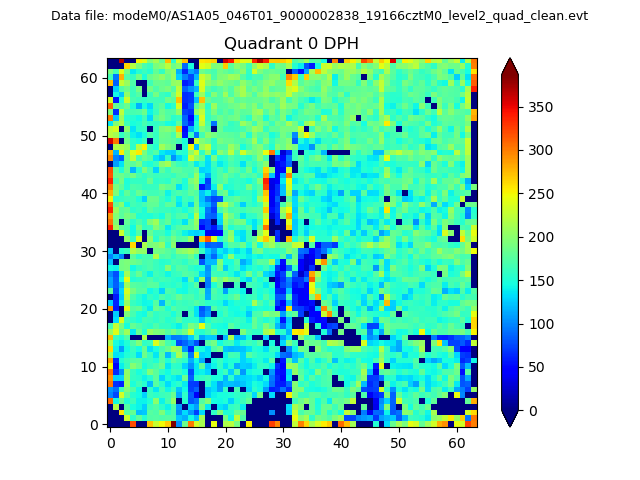 |
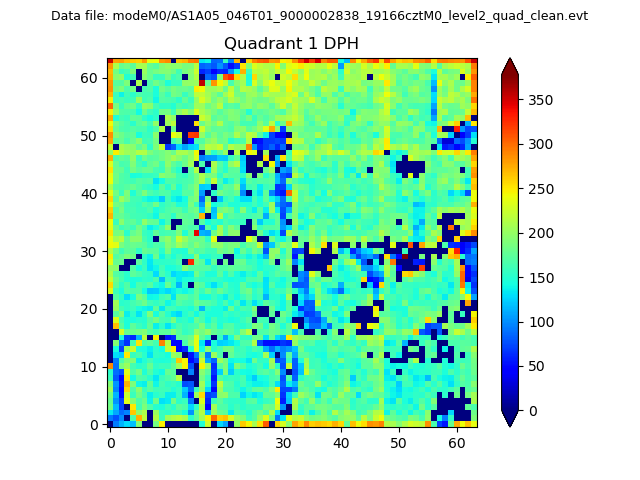 |
Quadrant B |
|---|---|---|---|
| Quadrant D | 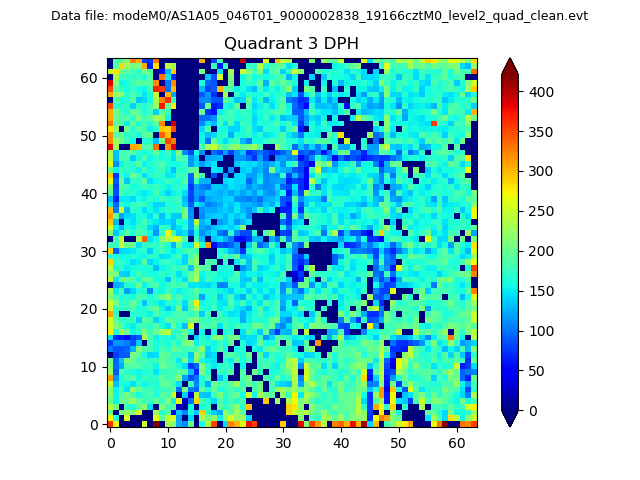 |
 |
Quadrant C |
| Plot type | Count rate plots | Images |
|---|---|---|
| Comparison with Poisson distribution Blue bars denote a histogram of data divided into 1 sec bins. Red curve is a Poisson curve with rate = median count rate of data. |
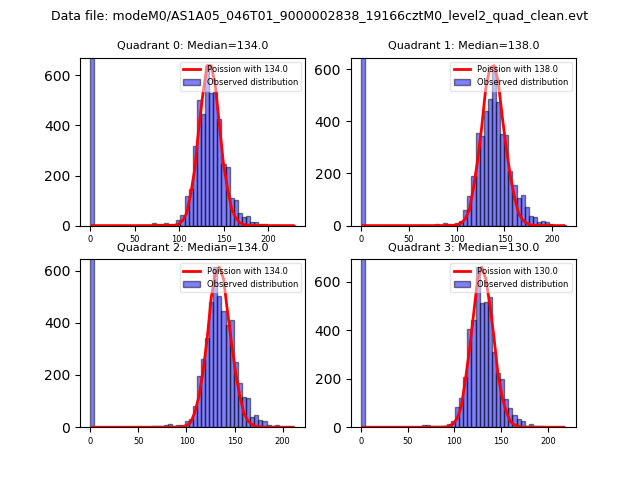 |
 |
| Quadrant-wise count rates Data is divided into 100 sec bins |
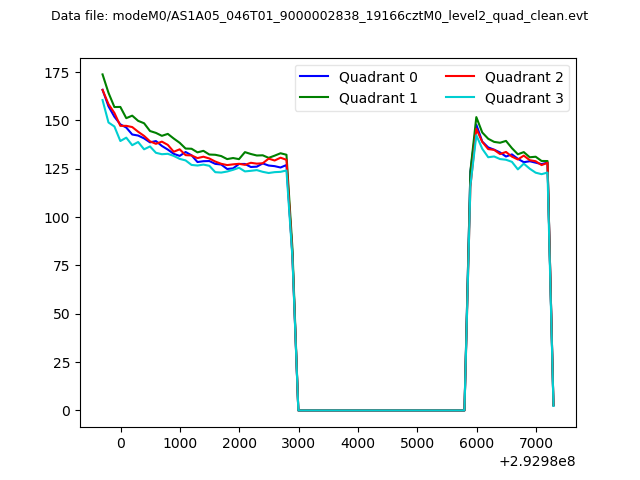 |
|
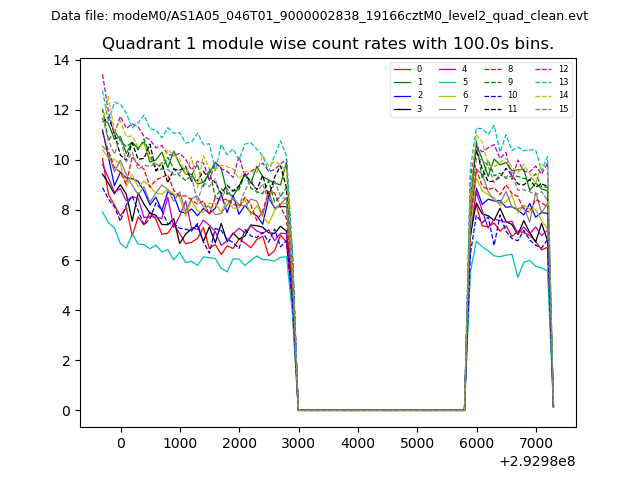
| Module-wise count rates for Quadrant A Data is divided into 100 sec bins |
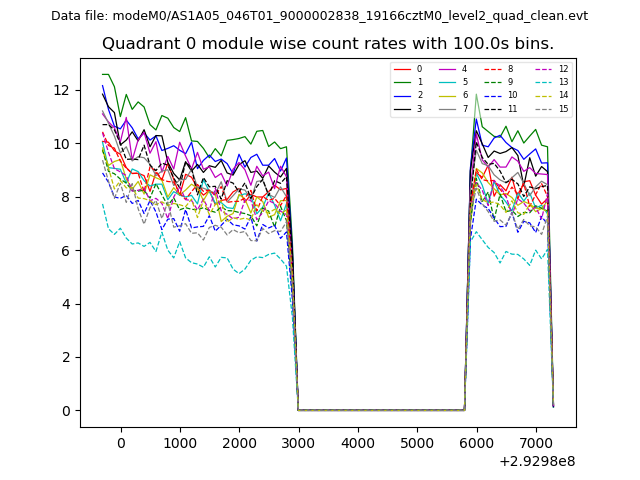 |
 |
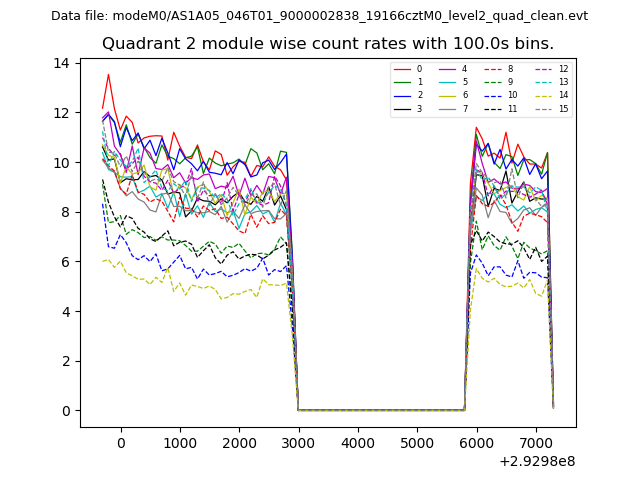
| Module-wise count rates for Quadrant B Data is divided into 100 sec bins |
 |
 |
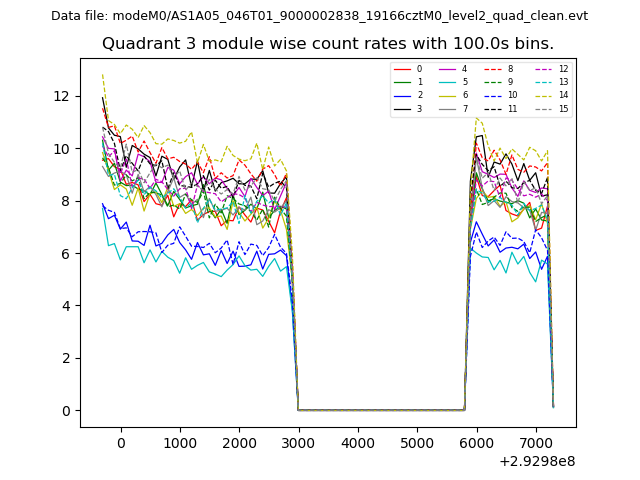
| Module-wise count rates for Quadrant C Data is divided into 100 sec bins |
 |
 |
| Module-wise count rates for Quadrant D Data is divided into 100 sec bins |
 |
 |
| Parameter | Plot |
|---|---|
| CZT HV Monitor | 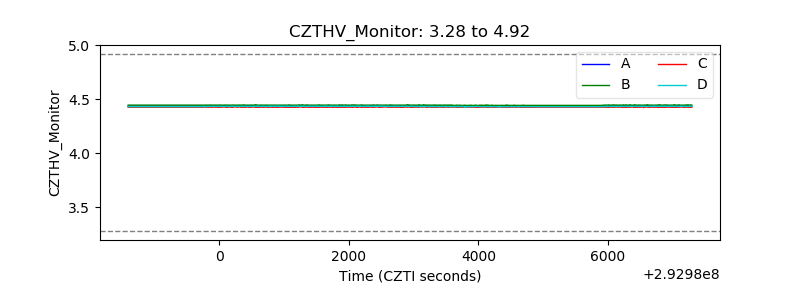 |
| D_VDD | 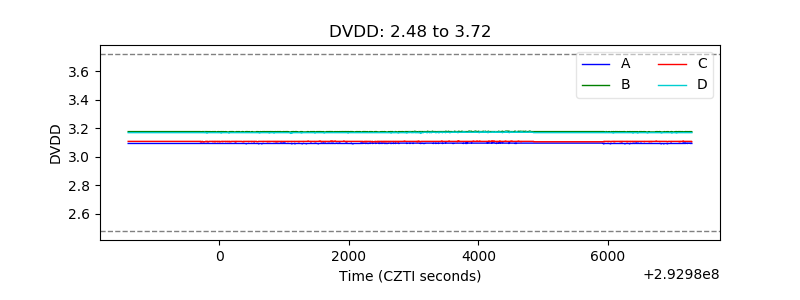 |
| Temperature 1 | 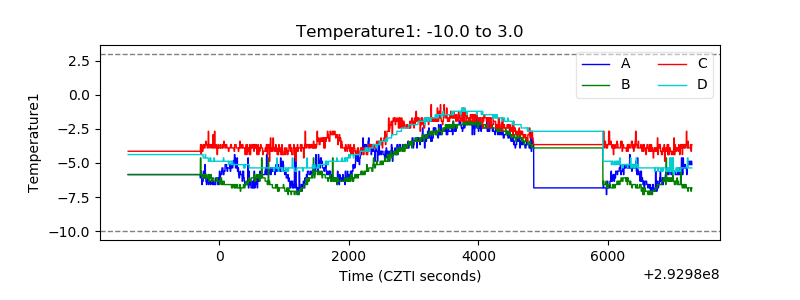 |
| Veto HV Monitor | 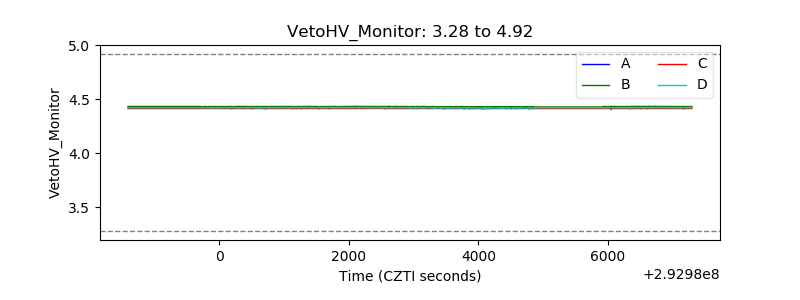 |
| Veto LLD | 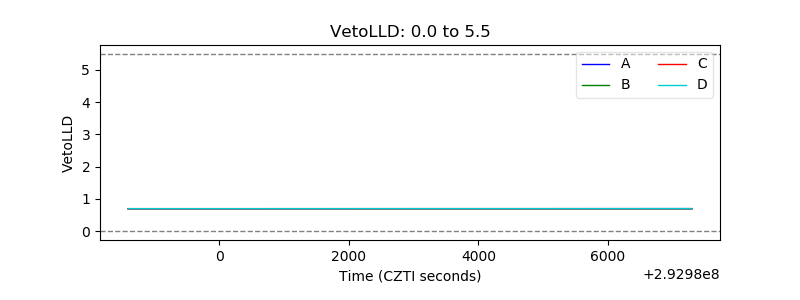 |
| Alpha Counter | 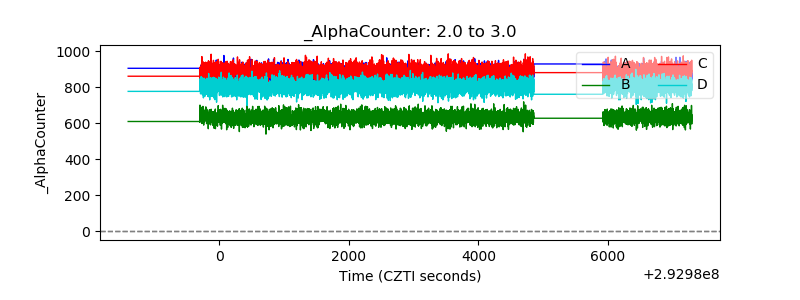 |
| _CPM_Rate | 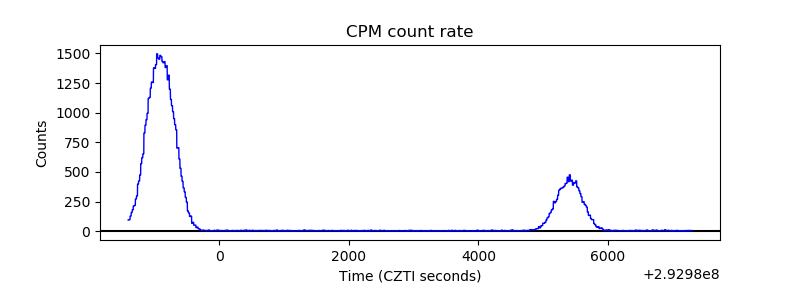 |
| CZT Counter | 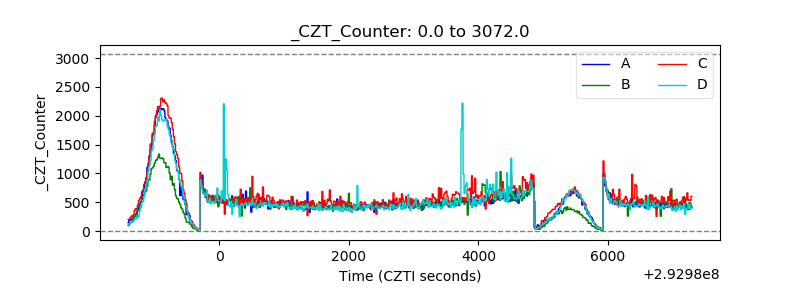 |
| +2.5 Volts monitor | 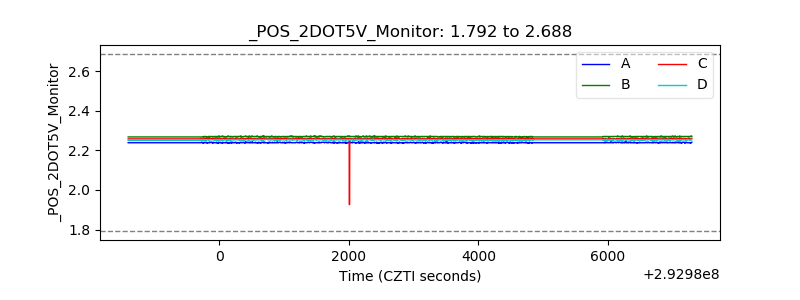 |
| +5 Volts monitor | 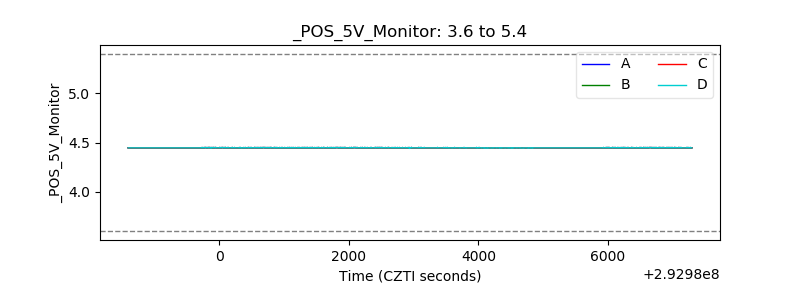 |
| _ROLL_ROT | 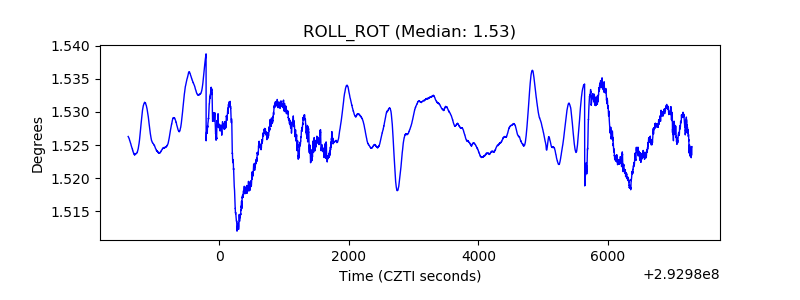 |
| _Roll_DEC | 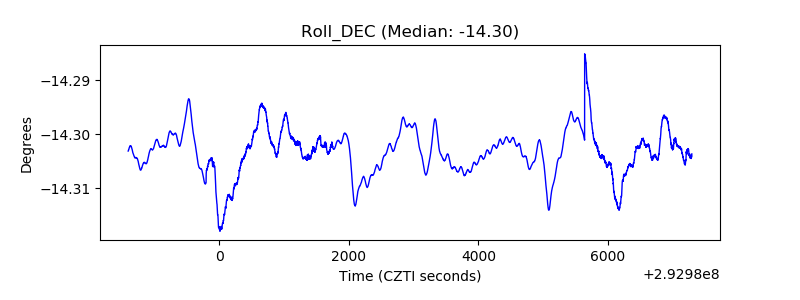 |
| _Roll_RA | 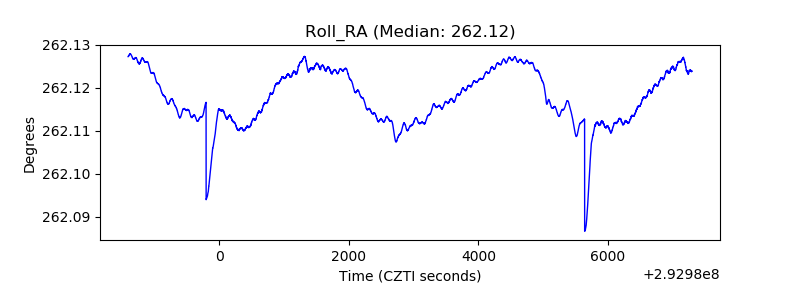 |
| Veto Counter | 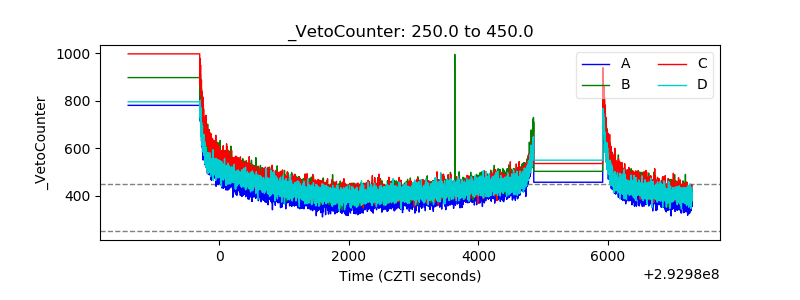 |