| Param | Original file | Final file |
|---|---|---|
| Filename | modeM0/AS1A05_046T01_9000002838_19173cztM0_level2.evt | modeM0/AS1A05_046T01_9000002838_19173cztM0_level2_quad_clean.evt |
| Size (bytes) | 2,426,267,520 | 317,505,600 |
| Size | 2.3 GB | 302.8 MB |
| Events in quadrant A | 13,378,862 | 1,976,741 |
| Events in quadrant B | 14,586,705 | 2,021,348 |
| Events in quadrant C | 17,997,351 | 1,952,788 |
| Events in quadrant D | 25,598,300 | 1,707,549 |
| Mode M0 | |||
|---|---|---|---|
| Quadrant | BADHDUFLAG | Total packets | Discarded packets |
| A | 0 | 58196 | 4 |
| B | 0 | 61407 | 4 |
| C | 0 | 71688 | 4 |
| D | 0 | 95116 | 13 |
| Mode SS | |||
|---|---|---|---|
| Quadrant | BADHDUFLAG | Total packets | Discarded packets |
| A | 0 | 580 | 0 |
| B | 0 | 580 | 0 |
| C | 0 | 580 | 0 |
| D | 0 | 580 | 0 |
| Mode M9 | |||
|---|---|---|---|
| Quadrant | BADHDUFLAG | Total packets | Discarded packets |
| A | 0 | 17 | 0 |
| B | 0 | 17 | 0 |
| C | 0 | 17 | 0 |
| D | 0 | 17 | 0 |
| Quadrant | Total seconds | Saturated seconds | Saturation percentage |
|---|---|---|---|
| A | 28437 | 469 | 1.649260% |
| B | 28438 | 671 | 2.359519% |
| C | 28437 | 1137 | 3.998312% |
| D | 28436 | 5212 | 18.328879% |
Noise dominated data is calculated using 1-second bins in cleaned event files. If a bin has >2000 counts, and if more than 50% of those come from <1% of pixels, then it is considered to be noise-dominated and hence unusable.
| Quadrant | # 1 sec bins | Bins with >0 counts | Bins with >2000 counts | High rate bins dominated by noise | Noise dominated (total time) | Noise dominated (detector-on time) | Marked lightcurve |
|---|---|---|---|---|---|---|---|
| A | 38712 | 28443 | 0 | 0 | 0.00% | 0.00% | 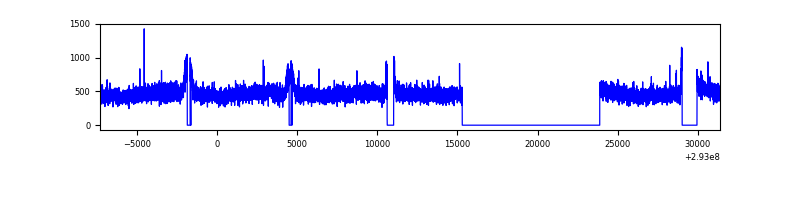 |
| B | 38713 | 28444 | 99 | 99 | 0.26% | 0.35% | 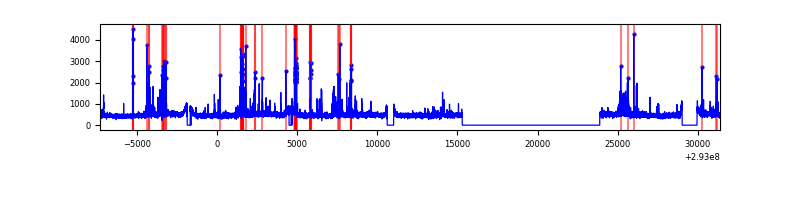 |
| C | 38712 | 28444 | 200 | 200 | 0.52% | 0.70% | 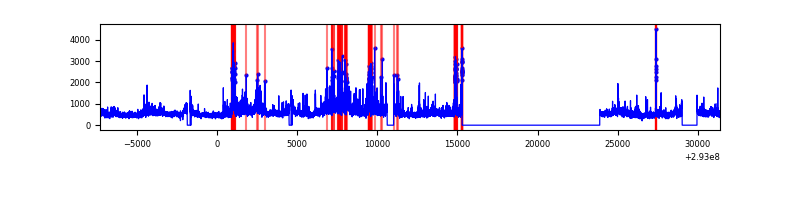 |
| D | 38712 | 28442 | 4256 | 4256 | 10.99% | 14.96% | 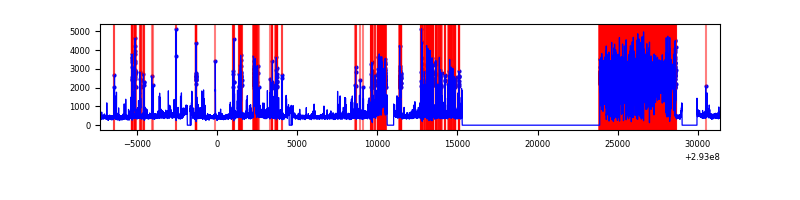 |
Top three noisy pixels from each quadrant. If the there are fewer than three noisy pixels in the level2.evt file, extra rows are filled as -1
| Pixel properties | Quadrant properties | ||||||
|---|---|---|---|---|---|---|---|
| Quadrant | DetID | PixID | Counts | Sigma | Mean | Median | Sigma |
| A | 11 | 47 | 89431 | 124.08 | 3430 | 3352 | 693.7 |
| A | 11 | 29 | 61928 | 84.43 | 3430 | 3352 | 693.7 |
| A | 13 | 254 | 38160 | 50.17 | 3430 | 3352 | 693.7 |
| B | 7 | 220 | 368153 | 558.66 | 3421 | 3328 | 653.0 |
| B | 3 | 112 | 166049 | 249.17 | 3421 | 3328 | 653.0 |
| B | 10 | 245 | 165477 | 248.3 | 3421 | 3328 | 653.0 |
| C | 3 | 233 | 4630660 | 6030.86 | 3294 | 3316 | 767.3 |
| C | 14 | 238 | 509379 | 659.56 | 3294 | 3316 | 767.3 |
| C | 13 | 61 | 23083 | 25.76 | 3294 | 3316 | 767.3 |
| D | 10 | 66 | 11073967 | 14900.09 | 3093 | 3010 | 743.0 |
| D | 11 | 176 | 1654986 | 2223.35 | 3093 | 3010 | 743.0 |
| D | 1 | 52 | 879622 | 1179.81 | 3093 | 3010 | 743.0 |
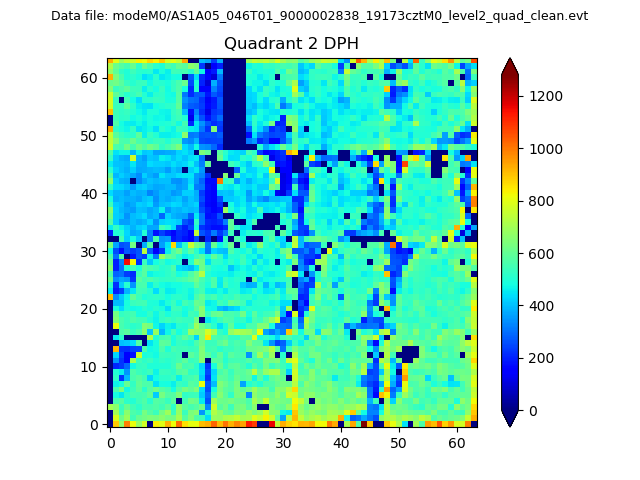
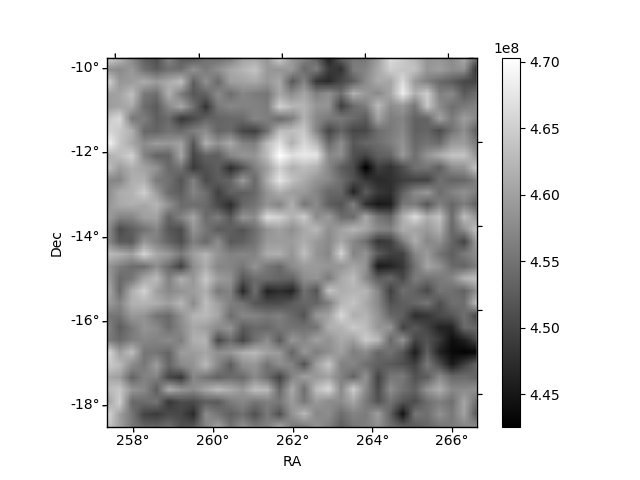
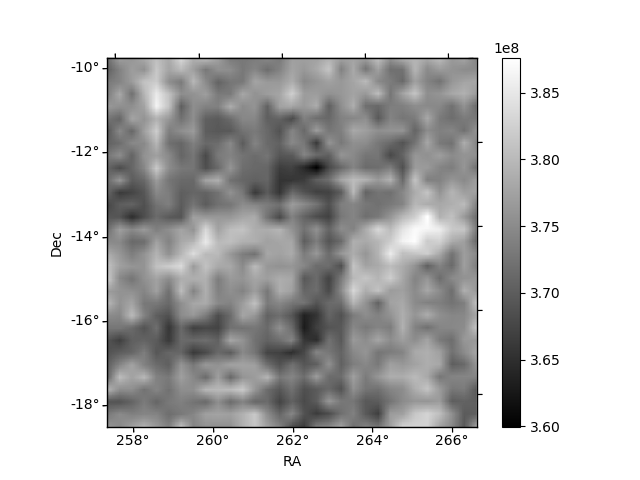
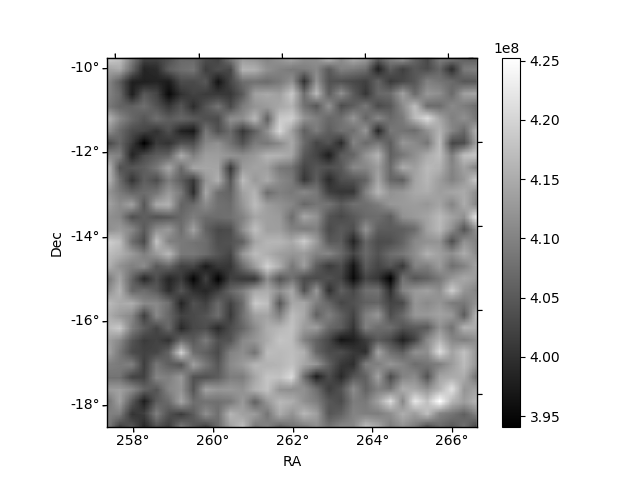
Histogram calculated using DETX and DETY for each event in the final _common_clean file
| Quadrant A | 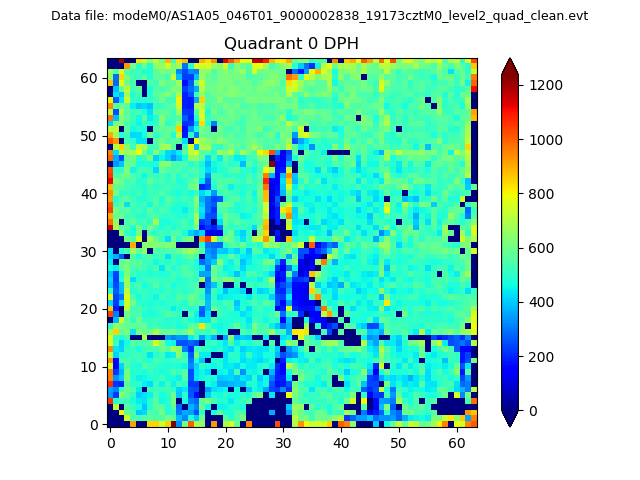 |
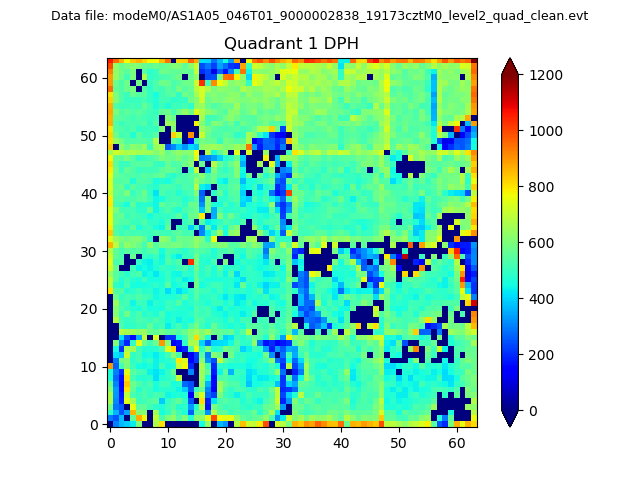 |
Quadrant B |
|---|---|---|---|
| Quadrant D | 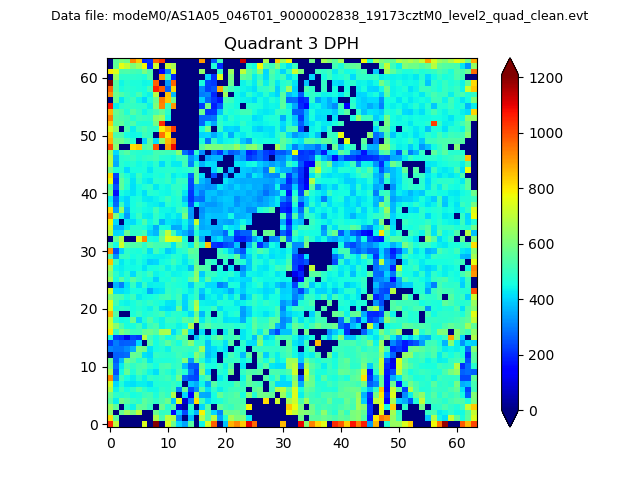 |
 |
Quadrant C |
| Plot type | Count rate plots | Images |
|---|---|---|
| Comparison with Poisson distribution Blue bars denote a histogram of data divided into 1 sec bins. Red curve is a Poisson curve with rate = median count rate of data. |
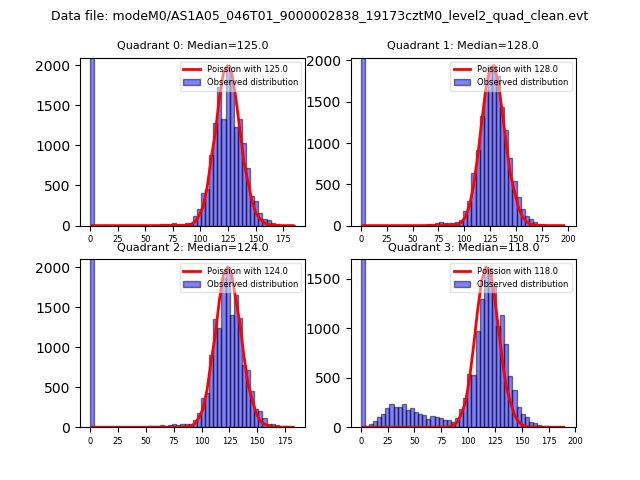 |
 |
| Quadrant-wise count rates Data is divided into 100 sec bins |
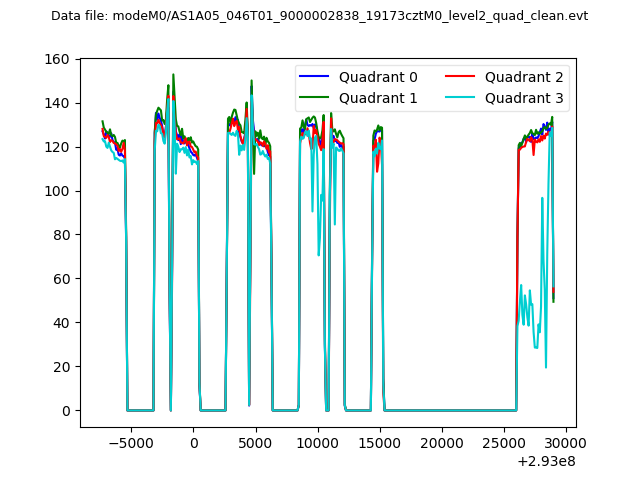 |
|
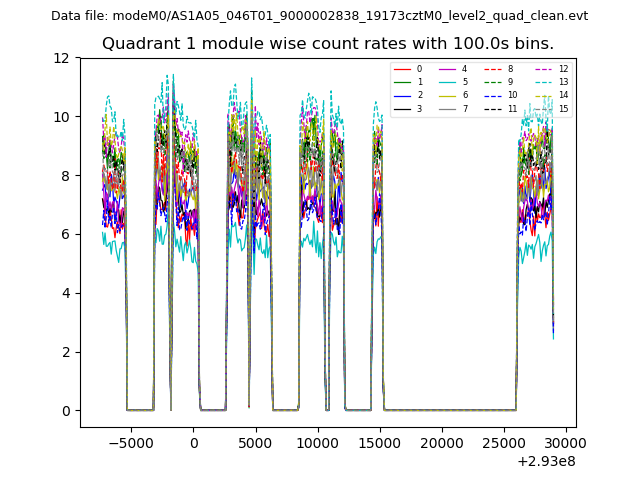
| Module-wise count rates for Quadrant A Data is divided into 100 sec bins |
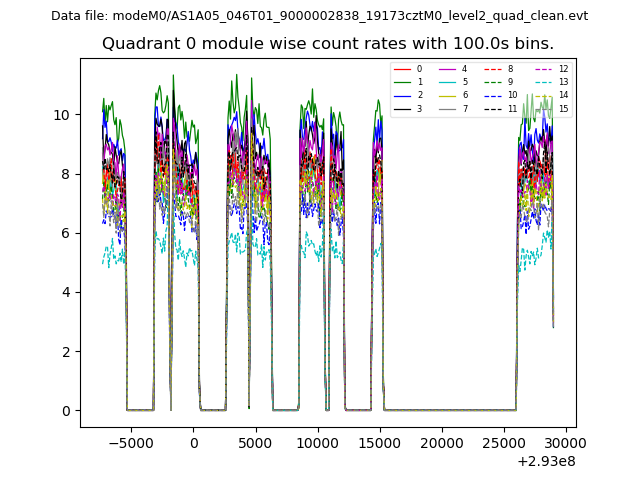 |
 |
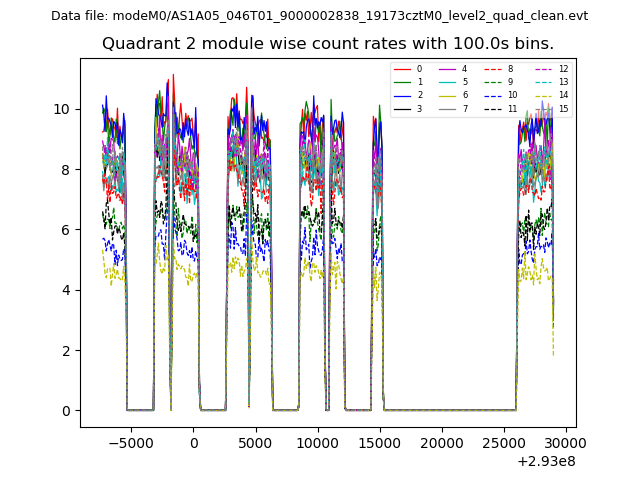
| Module-wise count rates for Quadrant B Data is divided into 100 sec bins |
 |
 |
| Module-wise count rates for Quadrant C Data is divided into 100 sec bins |
 |
 |
| Module-wise count rates for Quadrant D Data is divided into 100 sec bins |
 |
 |
| Parameter | Plot |
|---|---|
| CZT HV Monitor | 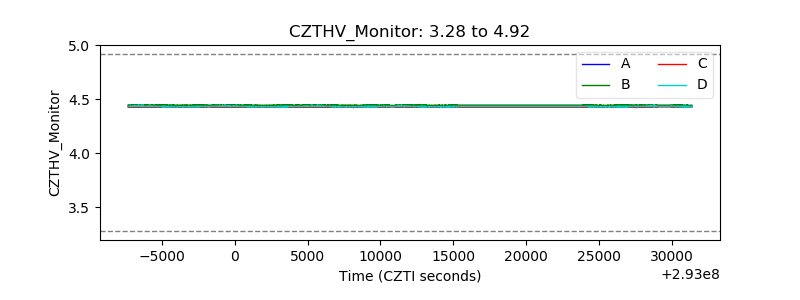 |
| D_VDD | 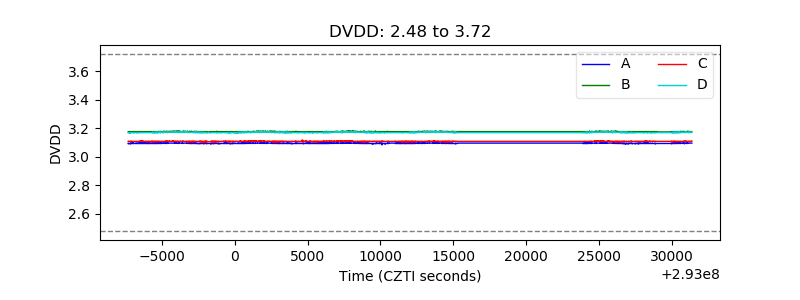 |
| Temperature 1 | 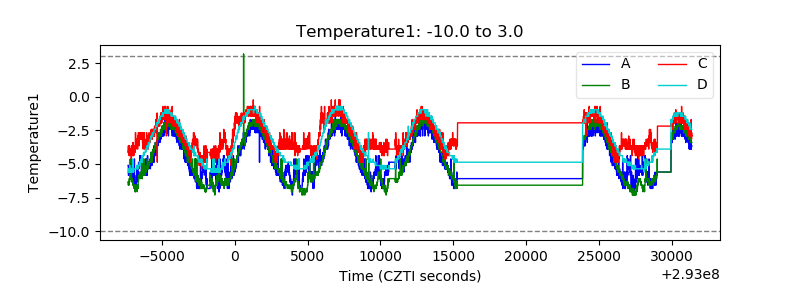 |
| Veto HV Monitor | 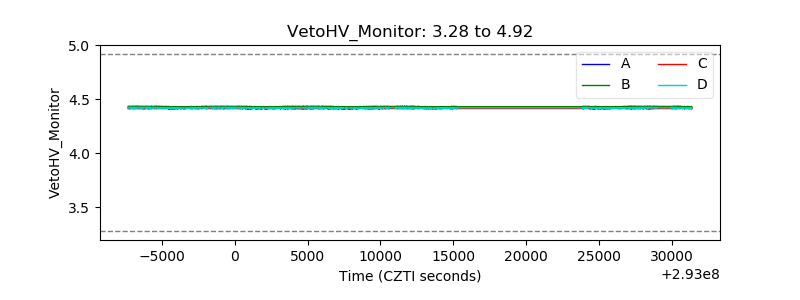 |
| Veto LLD | 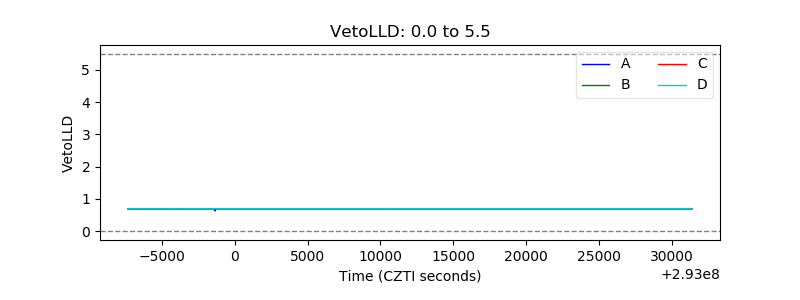 |
| Alpha Counter | 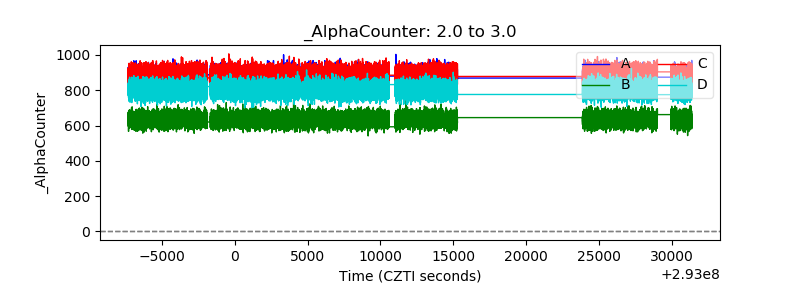 |
| _CPM_Rate | 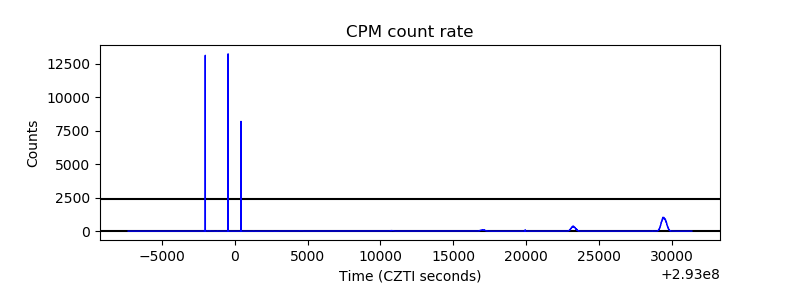 |
| CZT Counter | 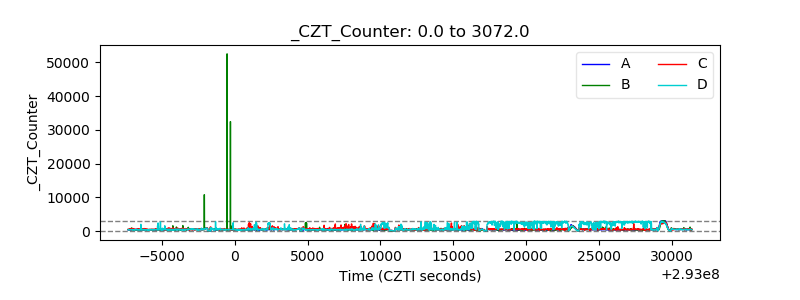 |
| +2.5 Volts monitor |  |
| +5 Volts monitor | 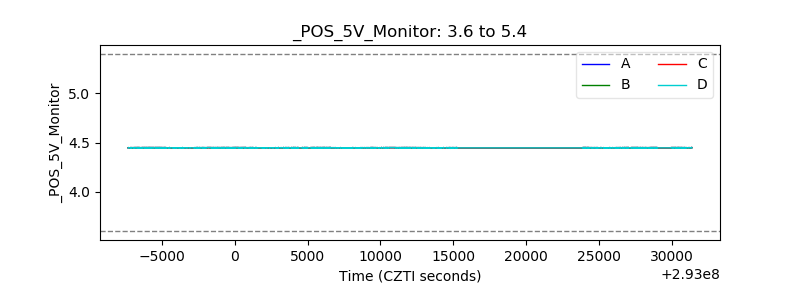 |
| _ROLL_ROT |  |
| _Roll_DEC | 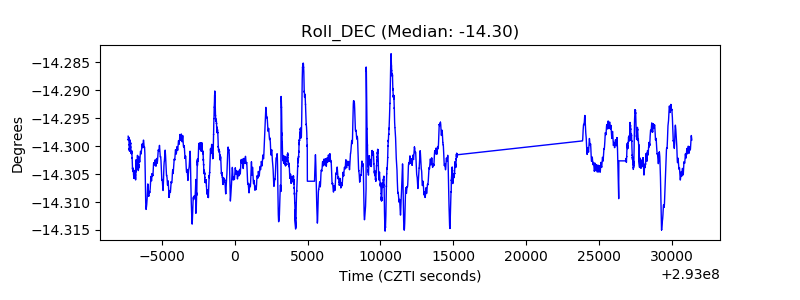 |
| _Roll_RA |  |
| Veto Counter | 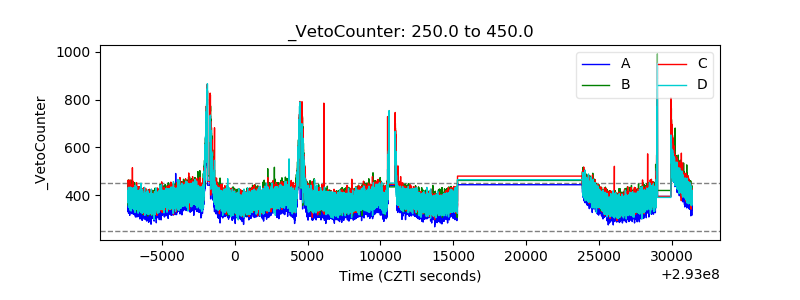 |