| Param | Original file | Final file |
|---|---|---|
| Filename | modeM0/AS1A05_046T01_9000002838_19174cztM0_level2.evt | modeM0/AS1A05_046T01_9000002838_19174cztM0_level2_quad_clean.evt |
| Size (bytes) | 473,947,200 | 68,575,680 |
| Size | 452.0 MB | 65.4 MB |
| Events in quadrant A | 3,238,867 | 407,240 |
| Events in quadrant B | 3,409,986 | 414,038 |
| Events in quadrant C | 3,649,849 | 403,850 |
| Events in quadrant D | 3,610,146 | 394,623 |
| Mode M0 | |||
|---|---|---|---|
| Quadrant | BADHDUFLAG | Total packets | Discarded packets |
| A | 0 | 13874 | 2 |
| B | 0 | 14339 | 2 |
| C | 0 | 14987 | 2 |
| D | 0 | 15205 | 2 |
| Mode SS | |||
|---|---|---|---|
| Quadrant | BADHDUFLAG | Total packets | Discarded packets |
| A | 0 | 132 | 0 |
| B | 0 | 132 | 0 |
| C | 0 | 132 | 0 |
| D | 0 | 132 | 0 |
| Mode M9 | |||
|---|---|---|---|
| Quadrant | BADHDUFLAG | Total packets | Discarded packets |
| A | 0 | 17 | 0 |
| B | 0 | 18 | 0 |
| C | 0 | 18 | 0 |
| D | 0 | 18 | 0 |
| Quadrant | Total seconds | Saturated seconds | Saturation percentage |
|---|---|---|---|
| A | 6549 | 71 | 1.084135% |
| B | 6549 | 87 | 1.328447% |
| C | 6549 | 119 | 1.817071% |
| D | 6549 | 119 | 1.817071% |
Noise dominated data is calculated using 1-second bins in cleaned event files. If a bin has >2000 counts, and if more than 50% of those come from <1% of pixels, then it is considered to be noise-dominated and hence unusable.
| Quadrant | # 1 sec bins | Bins with >0 counts | Bins with >2000 counts | High rate bins dominated by noise | Noise dominated (total time) | Noise dominated (detector-on time) | Marked lightcurve |
|---|---|---|---|---|---|---|---|
| A | 7594 | 6549 | 0 | 0 | 0.00% | 0.00% | 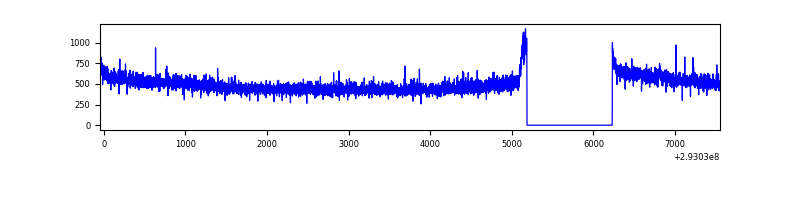 |
| B | 7594 | 6549 | 7 | 7 | 0.09% | 0.11% | 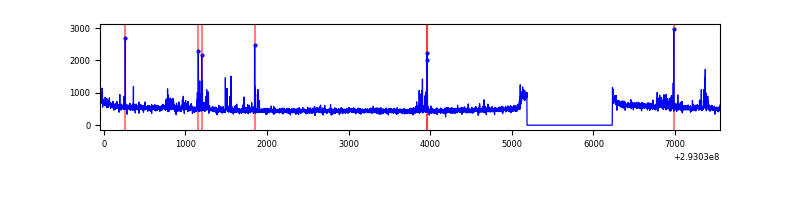 |
| C | 7594 | 6549 | 3 | 3 | 0.04% | 0.05% | 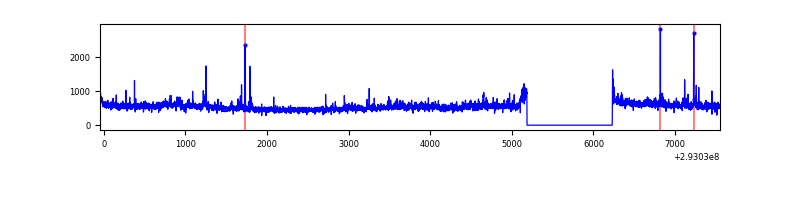 |
| D | 7594 | 6549 | 50 | 50 | 0.66% | 0.76% | 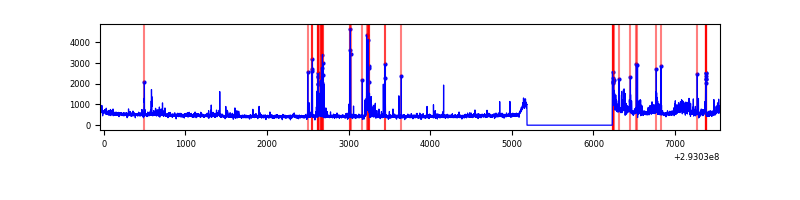 |
Top three noisy pixels from each quadrant. If the there are fewer than three noisy pixels in the level2.evt file, extra rows are filled as -1
| Pixel properties | Quadrant properties | ||||||
|---|---|---|---|---|---|---|---|
| Quadrant | DetID | PixID | Counts | Sigma | Mean | Median | Sigma |
| A | 11 | 47 | 15385 | 86.82 | 831 | 814 | 167.8 |
| A | 11 | 29 | 14697 | 82.72 | 831 | 814 | 167.8 |
| A | 13 | 254 | 8877 | 48.04 | 831 | 814 | 167.8 |
| B | 0 | 190 | 55105 | 342.67 | 828 | 806 | 158.5 |
| B | 4 | 171 | 34335 | 211.6 | 828 | 806 | 158.5 |
| B | 7 | 220 | 27149 | 166.25 | 828 | 806 | 158.5 |
| C | 3 | 233 | 396212 | 2123.86 | 798 | 803 | 186.2 |
| C | 14 | 238 | 124362 | 663.67 | 798 | 803 | 186.2 |
| C | 0 | 207 | 19757 | 101.81 | 798 | 803 | 186.2 |
| D | 1 | 52 | 238358 | 1192.26 | 811 | 788 | 199.3 |
| D | 11 | 176 | 230242 | 1151.53 | 811 | 788 | 199.3 |
| D | 10 | 66 | 50723 | 250.6 | 811 | 788 | 199.3 |
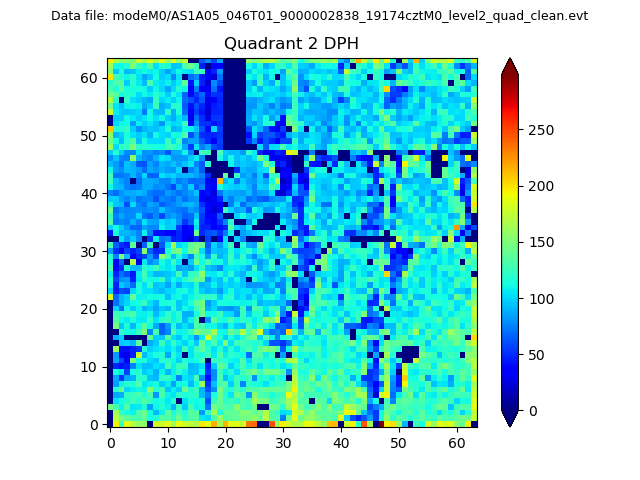
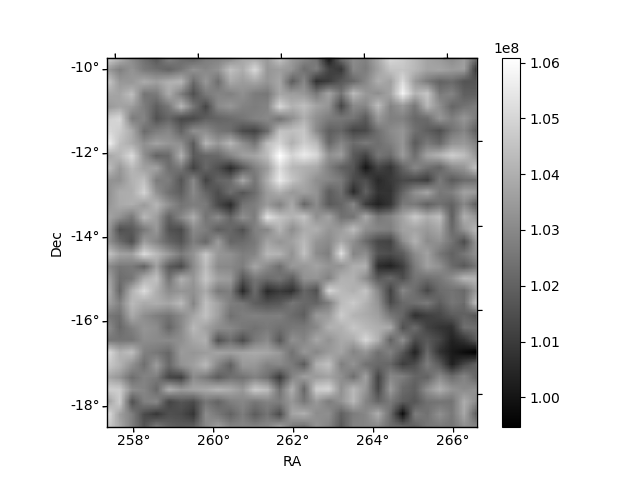
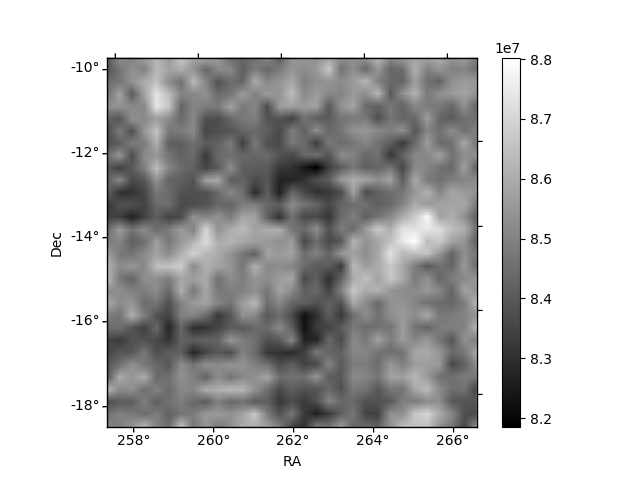
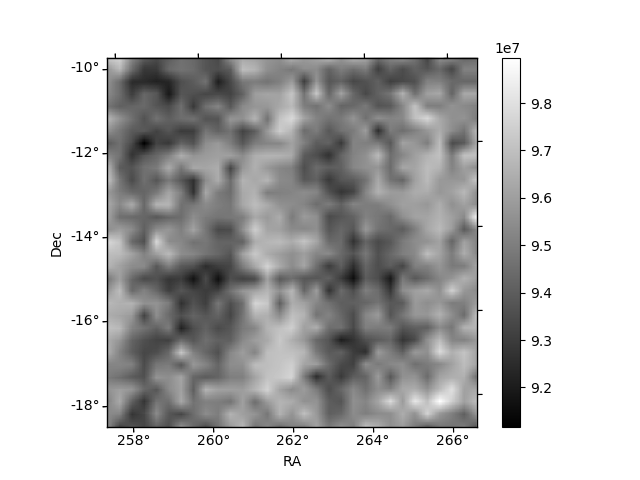
Histogram calculated using DETX and DETY for each event in the final _common_clean file
| Quadrant A | 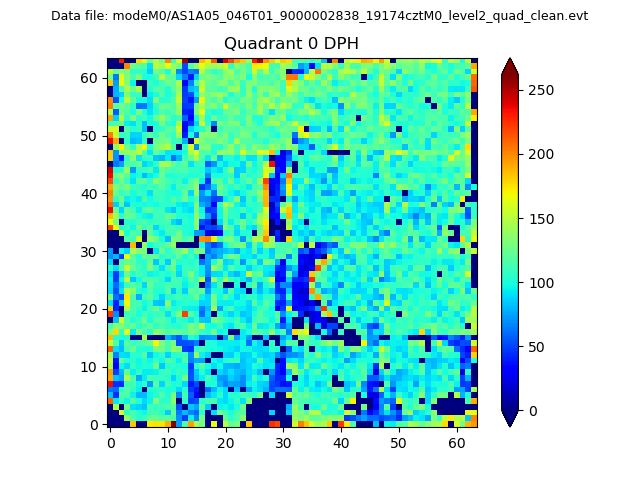 |
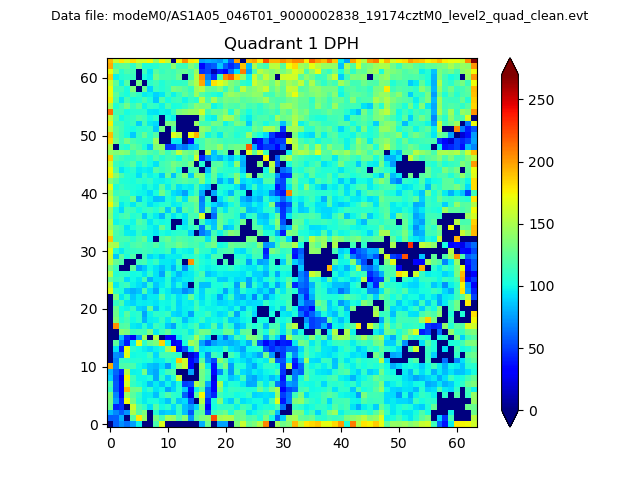 |
Quadrant B |
|---|---|---|---|
| Quadrant D | 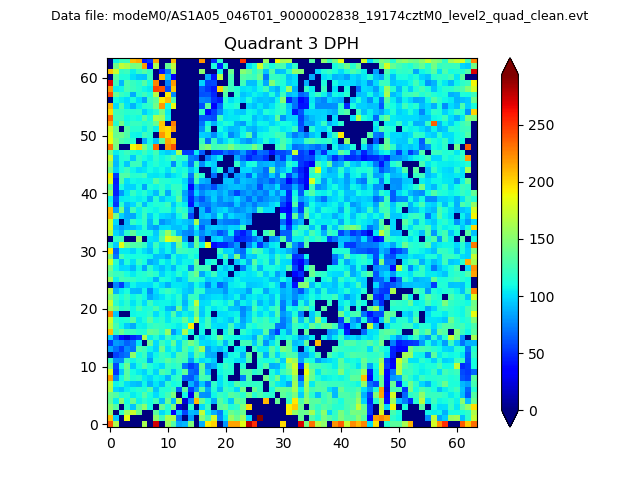 |
 |
Quadrant C |
| Plot type | Count rate plots | Images |
|---|---|---|
| Comparison with Poisson distribution Blue bars denote a histogram of data divided into 1 sec bins. Red curve is a Poisson curve with rate = median count rate of data. |
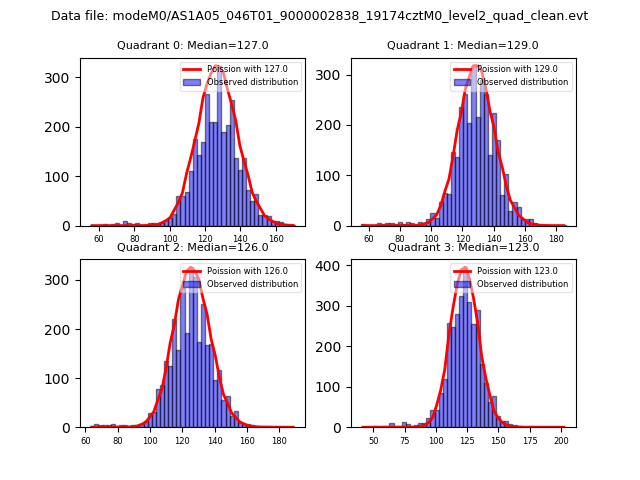 |
 |
| Quadrant-wise count rates Data is divided into 100 sec bins |
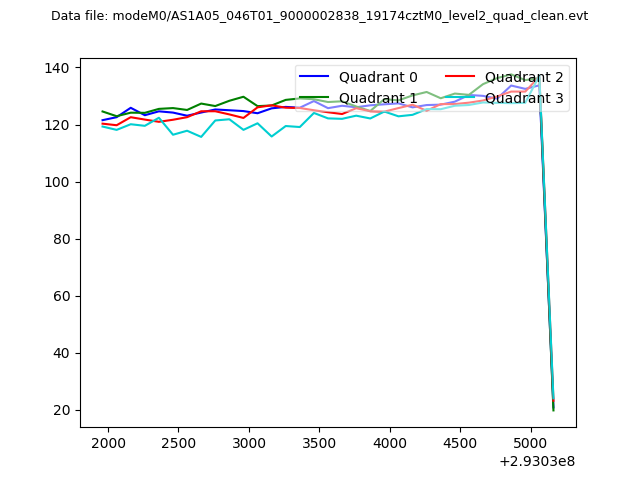 |
|
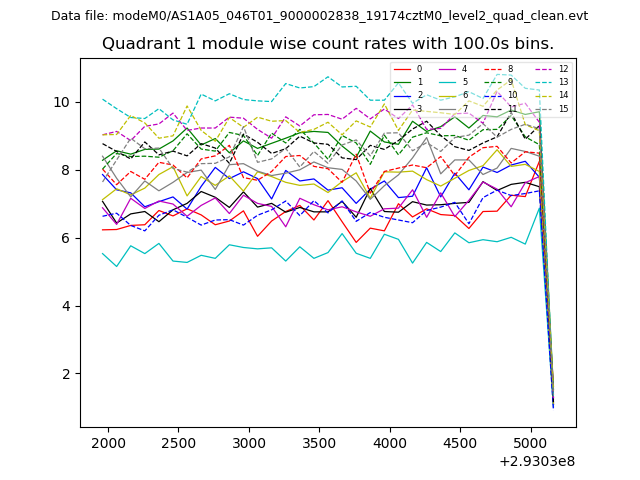
| Module-wise count rates for Quadrant A Data is divided into 100 sec bins |
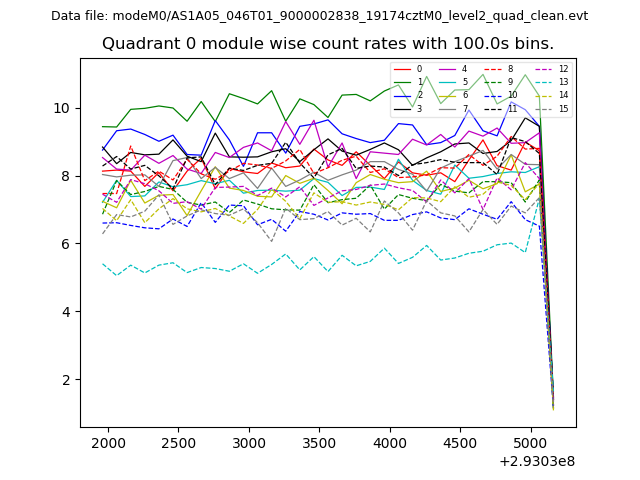 |
 |
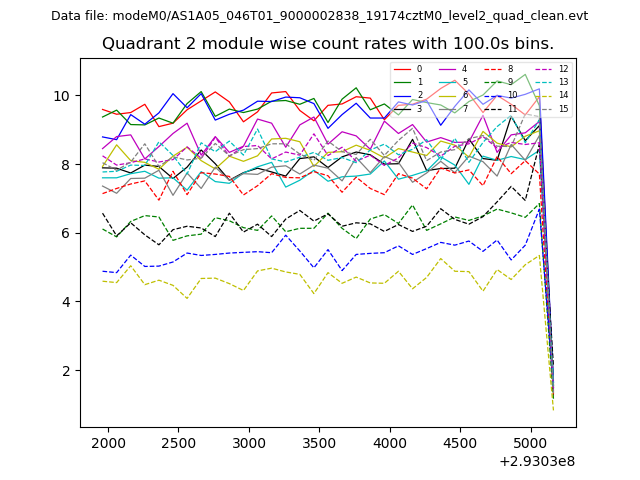
| Module-wise count rates for Quadrant B Data is divided into 100 sec bins |
 |
 |
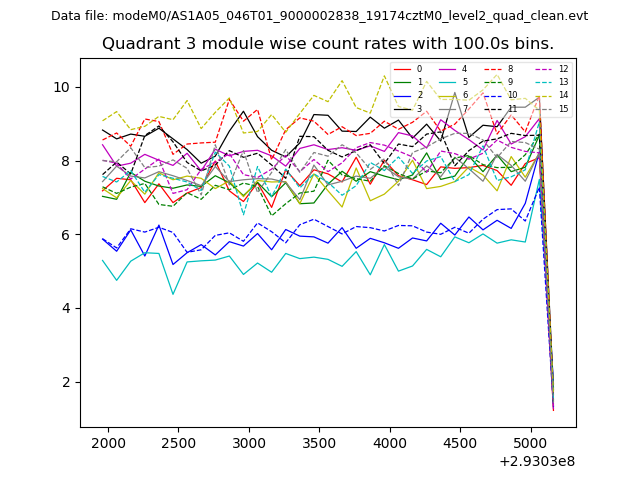
| Module-wise count rates for Quadrant C Data is divided into 100 sec bins |
 |
 |
| Module-wise count rates for Quadrant D Data is divided into 100 sec bins |
 |
 |
| Parameter | Plot |
|---|---|
| CZT HV Monitor | 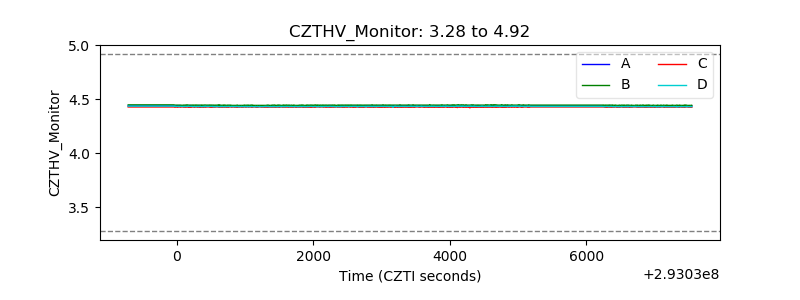 |
| D_VDD | 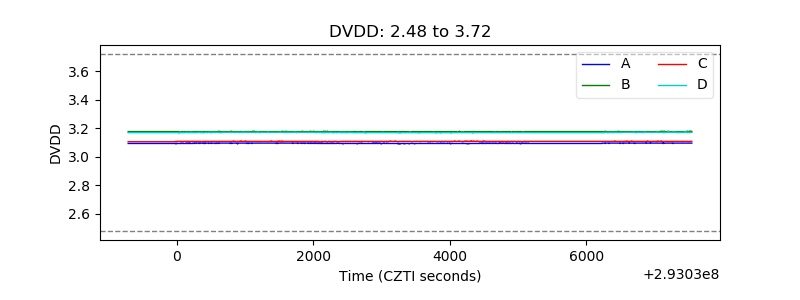 |
| Temperature 1 | 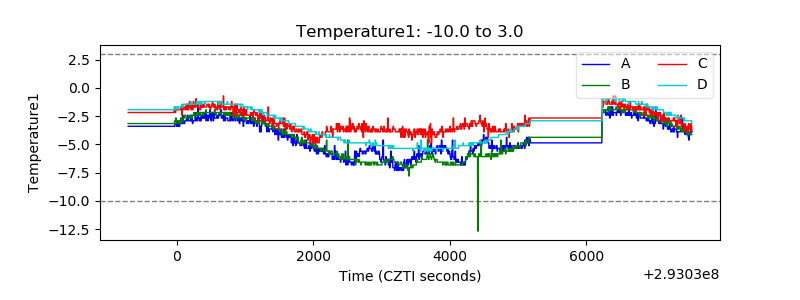 |
| Veto HV Monitor | 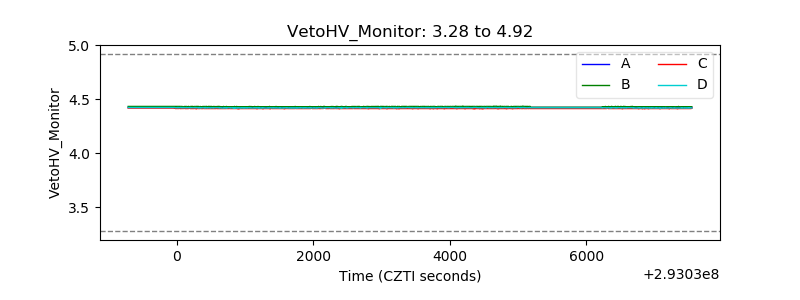 |
| Veto LLD | 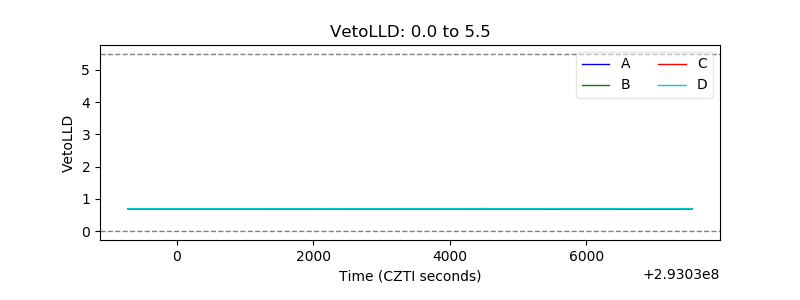 |
| Alpha Counter | 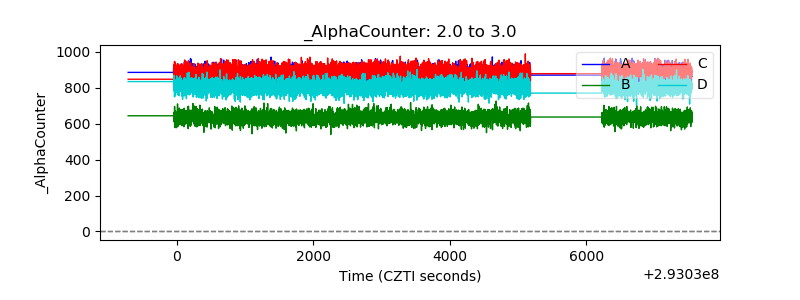 |
| _CPM_Rate | 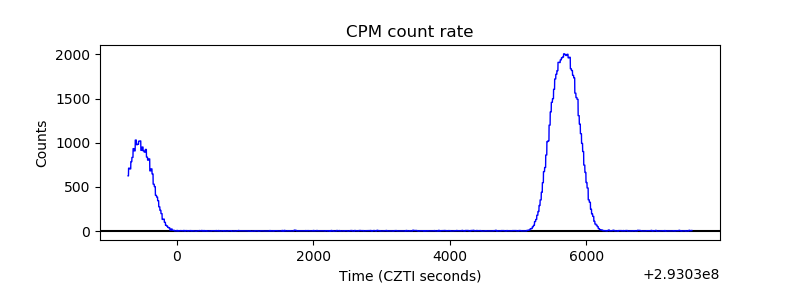 |
| CZT Counter | 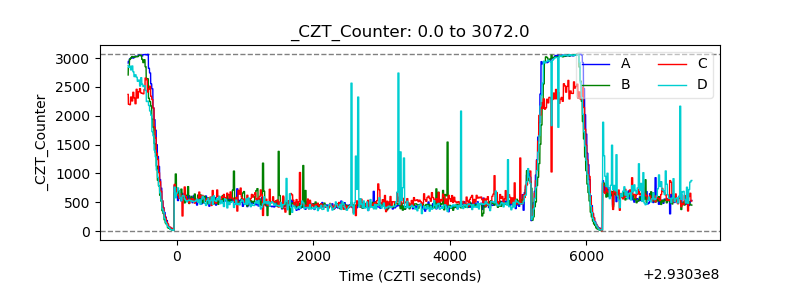 |
| +2.5 Volts monitor |  |
| +5 Volts monitor | 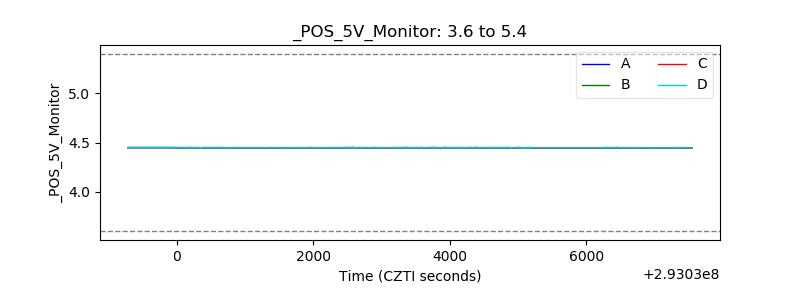 |
| _ROLL_ROT | 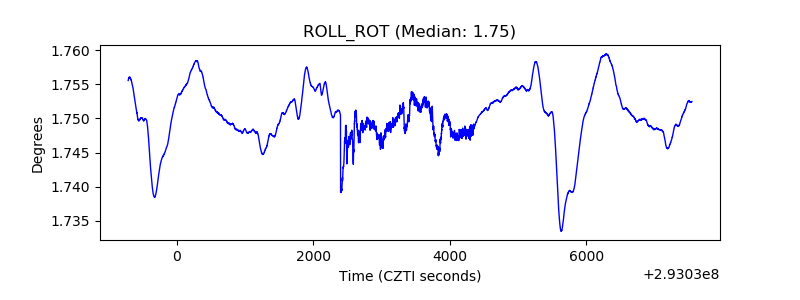 |
| _Roll_DEC | 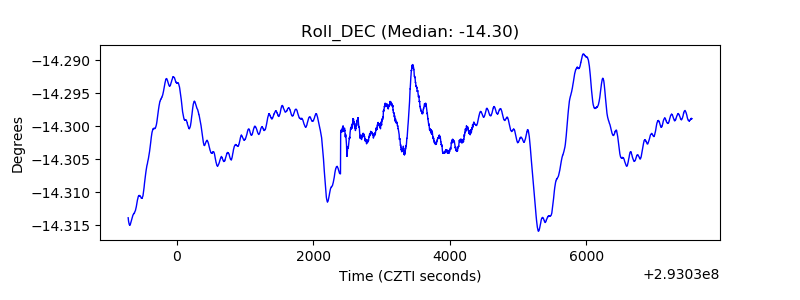 |
| _Roll_RA | 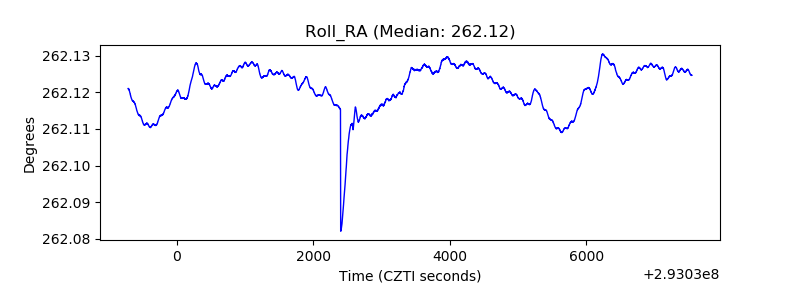 |
| Veto Counter | 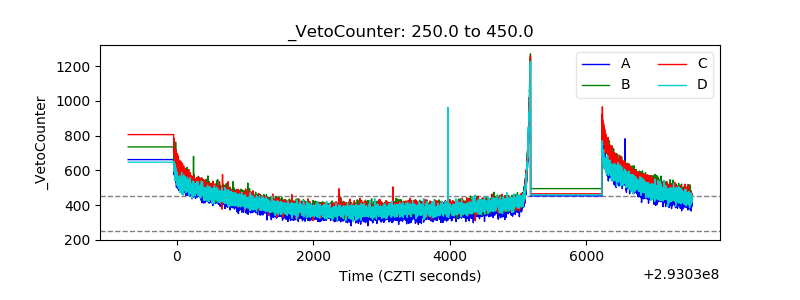 |