| Param | Original file | Final file |
|---|---|---|
| Filename | modeM0/AS1A05_046T01_9000002838_19176cztM0_level2.evt | modeM0/AS1A05_046T01_9000002838_19176cztM0_level2_quad_clean.evt |
| Size (bytes) | 490,461,120 | 75,548,160 |
| Size | 467.7 MB | 72.0 MB |
| Events in quadrant A | 3,228,848 | 467,201 |
| Events in quadrant B | 3,394,351 | 474,784 |
| Events in quadrant C | 3,595,798 | 459,491 |
| Events in quadrant D | 4,208,949 | 448,095 |
| Mode M0 | |||
|---|---|---|---|
| Quadrant | BADHDUFLAG | Total packets | Discarded packets |
| A | 0 | 13671 | 2 |
| B | 0 | 14124 | 2 |
| C | 0 | 14809 | 2 |
| D | 0 | 16799 | 2 |
| Mode SS | |||
|---|---|---|---|
| Quadrant | BADHDUFLAG | Total packets | Discarded packets |
| A | 0 | 126 | 0 |
| B | 0 | 126 | 0 |
| C | 0 | 126 | 0 |
| D | 0 | 126 | 0 |
| Mode M9 | |||
|---|---|---|---|
| Quadrant | BADHDUFLAG | Total packets | Discarded packets |
| A | 0 | 19 | 0 |
| B | 0 | 20 | 0 |
| C | 0 | 20 | 0 |
| D | 0 | 20 | 0 |
| Quadrant | Total seconds | Saturated seconds | Saturation percentage |
|---|---|---|---|
| A | 6280 | 65 | 1.035032% |
| B | 6280 | 107 | 1.703822% |
| C | 6280 | 113 | 1.799363% |
| D | 6280 | 182 | 2.898089% |
Noise dominated data is calculated using 1-second bins in cleaned event files. If a bin has >2000 counts, and if more than 50% of those come from <1% of pixels, then it is considered to be noise-dominated and hence unusable.
| Quadrant | # 1 sec bins | Bins with >0 counts | Bins with >2000 counts | High rate bins dominated by noise | Noise dominated (total time) | Noise dominated (detector-on time) | Marked lightcurve |
|---|---|---|---|---|---|---|---|
| A | 7450 | 6280 | 0 | 0 | 0.00% | 0.00% | 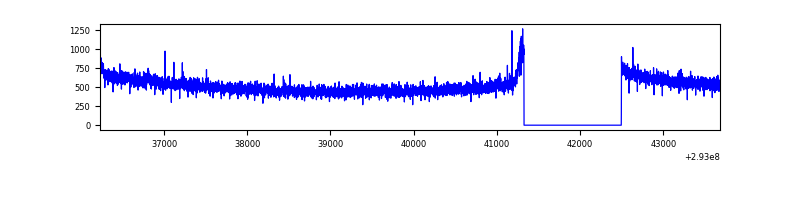 |
| B | 7450 | 6280 | 8 | 8 | 0.11% | 0.13% | 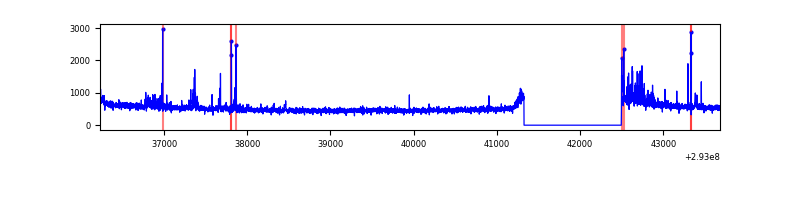 |
| C | 7450 | 6280 | 6 | 6 | 0.08% | 0.10% | 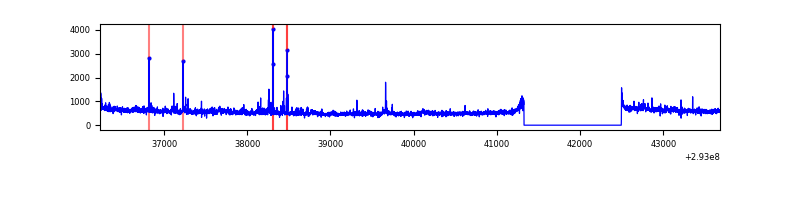 |
| D | 7450 | 6280 | 111 | 111 | 1.49% | 1.77% | 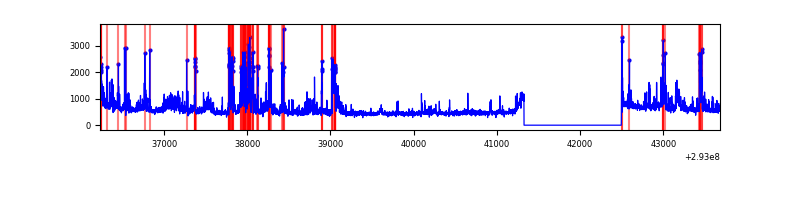 |
Top three noisy pixels from each quadrant. If the there are fewer than three noisy pixels in the level2.evt file, extra rows are filled as -1
| Pixel properties | Quadrant properties | ||||||
|---|---|---|---|---|---|---|---|
| Quadrant | DetID | PixID | Counts | Sigma | Mean | Median | Sigma |
| A | 11 | 47 | 21304 | 122.89 | 824 | 805 | 166.8 |
| A | 11 | 29 | 19863 | 114.25 | 824 | 805 | 166.8 |
| A | 8 | 205 | 14271 | 80.73 | 824 | 805 | 166.8 |
| B | 7 | 220 | 103310 | 659.88 | 823 | 803 | 155.3 |
| B | 4 | 171 | 25950 | 161.88 | 823 | 803 | 155.3 |
| B | 0 | 190 | 20749 | 128.4 | 823 | 803 | 155.3 |
| C | 3 | 233 | 371304 | 2010.37 | 792 | 800 | 184.3 |
| C | 14 | 238 | 123926 | 668.09 | 792 | 800 | 184.3 |
| C | 0 | 207 | 12402 | 62.95 | 792 | 800 | 184.3 |
| D | 1 | 52 | 794377 | 4132.72 | 798 | 777 | 192.0 |
| D | 10 | 66 | 304761 | 1583.01 | 798 | 777 | 192.0 |
| D | 9 | 68 | 55024 | 282.49 | 798 | 777 | 192.0 |
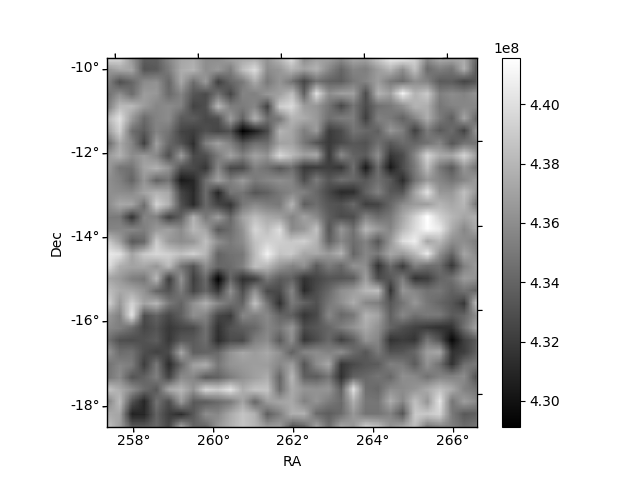
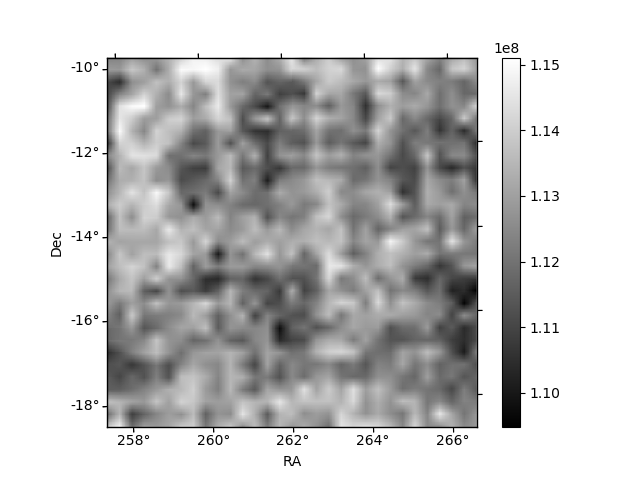
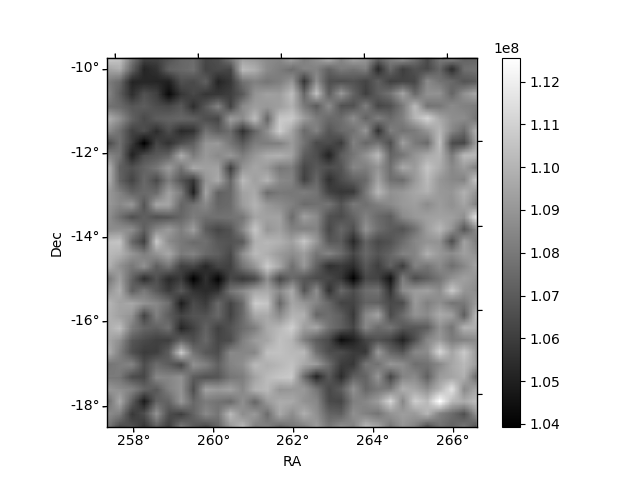
Histogram calculated using DETX and DETY for each event in the final _common_clean file
| Quadrant A | 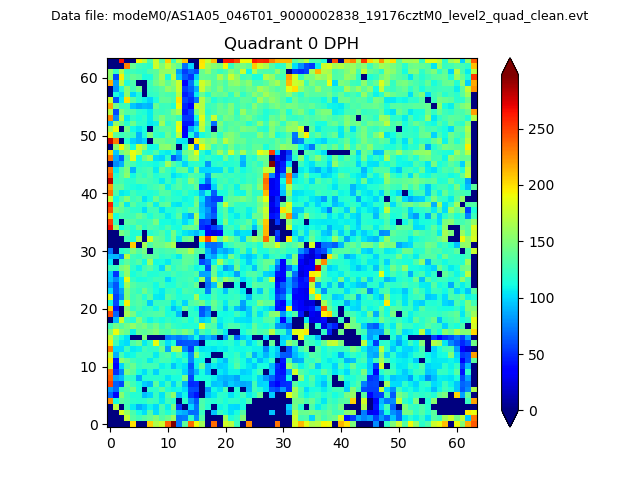 |
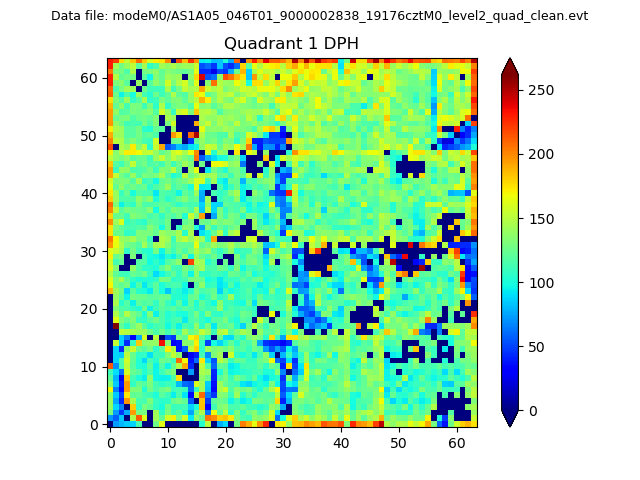 |
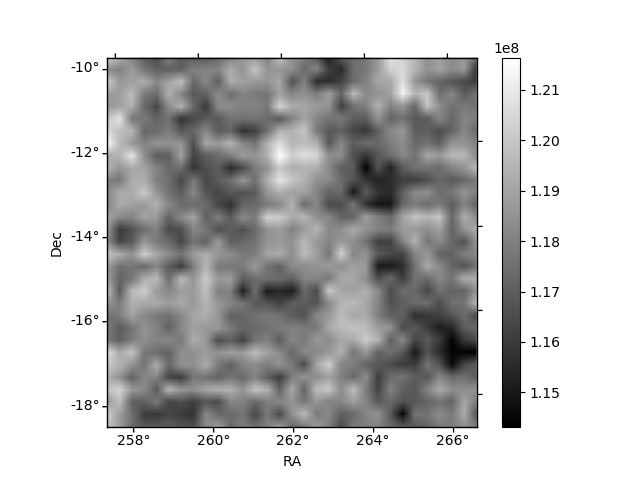
Quadrant B |
|---|---|---|---|
| Quadrant D | 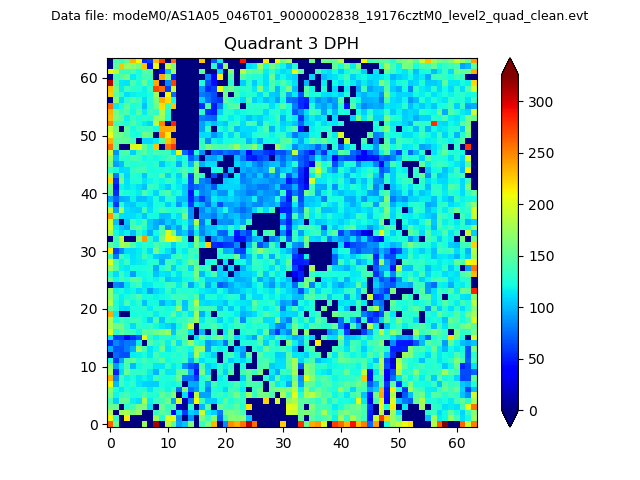 |
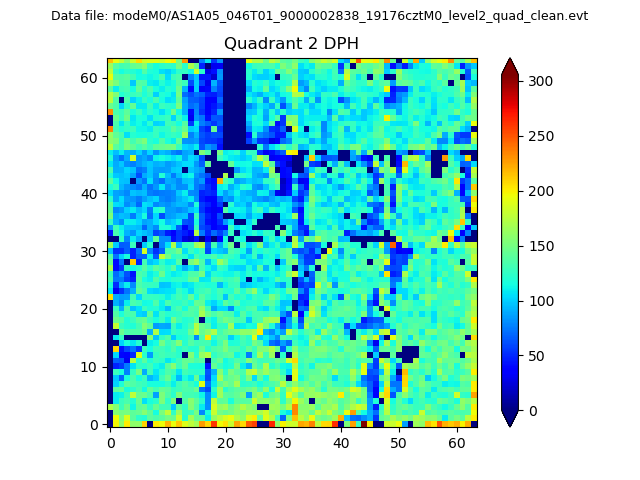 |
Quadrant C |
| Plot type | Count rate plots | Images |
|---|---|---|
| Comparison with Poisson distribution Blue bars denote a histogram of data divided into 1 sec bins. Red curve is a Poisson curve with rate = median count rate of data. |
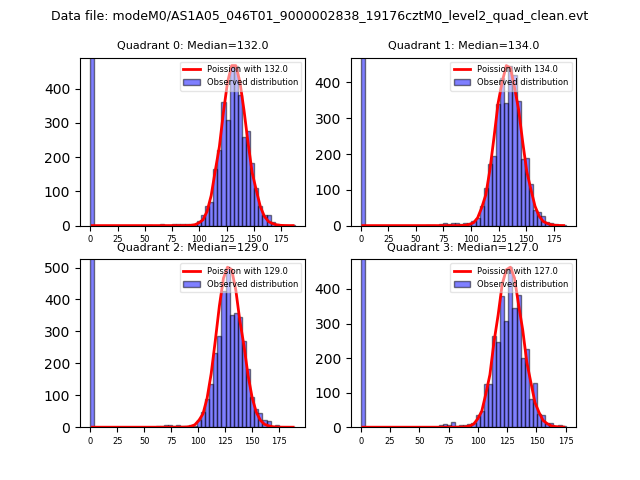 |
 |
| Quadrant-wise count rates Data is divided into 100 sec bins |
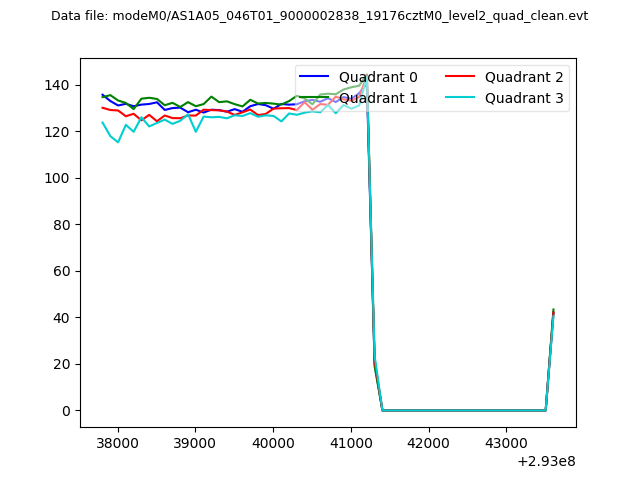 |
|
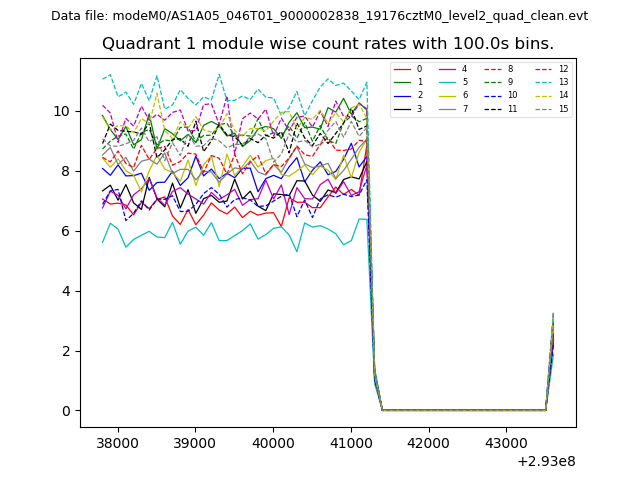
| Module-wise count rates for Quadrant A Data is divided into 100 sec bins |
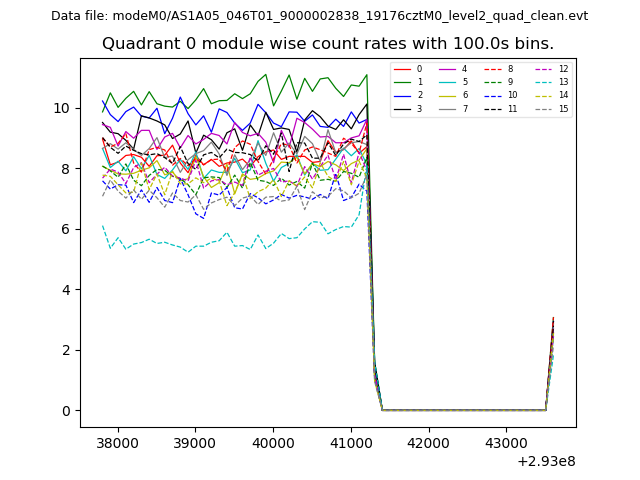 |
 |
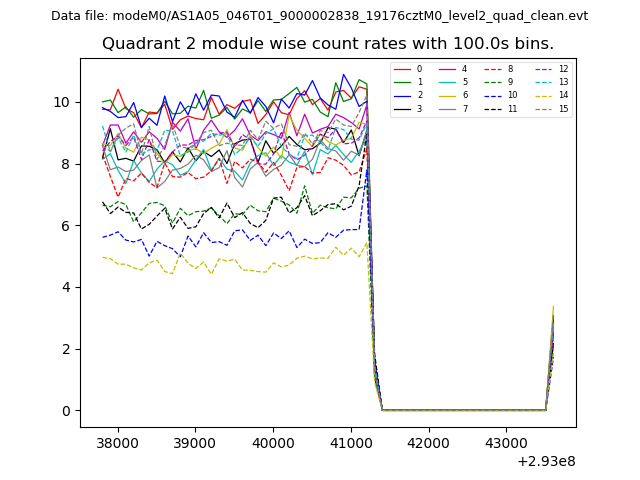
| Module-wise count rates for Quadrant B Data is divided into 100 sec bins |
 |
 |
| Module-wise count rates for Quadrant C Data is divided into 100 sec bins |
 |
 |
| Module-wise count rates for Quadrant D Data is divided into 100 sec bins |
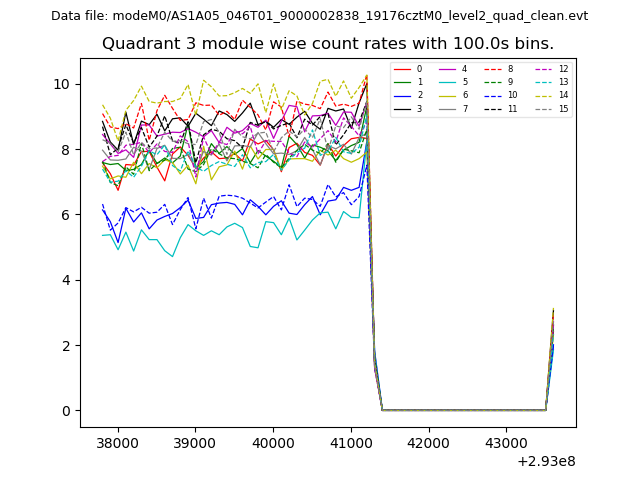 |
 |
| Parameter | Plot |
|---|---|
| CZT HV Monitor | 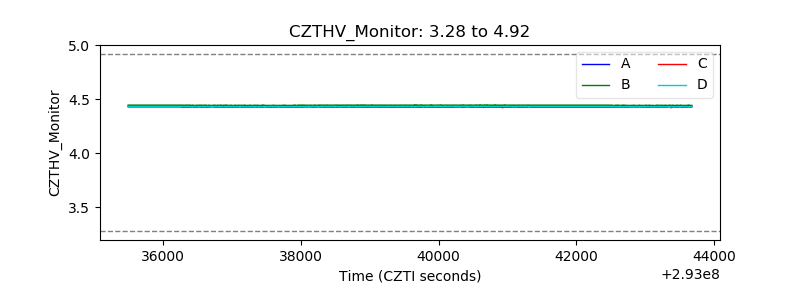 |
| D_VDD | 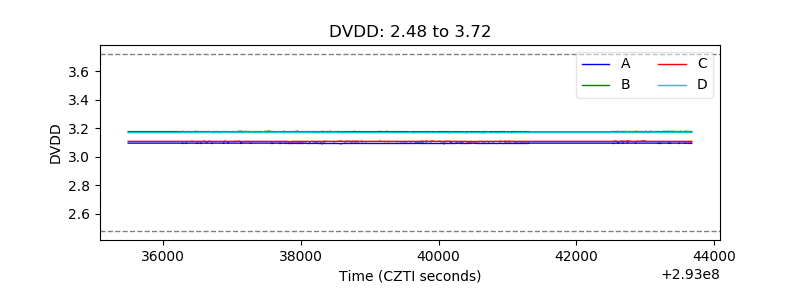 |
| Temperature 1 | 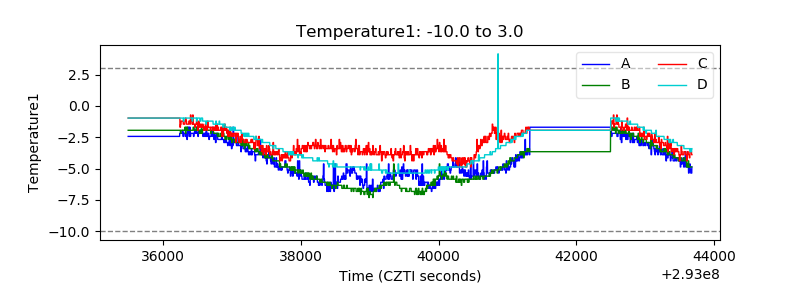 |
| Veto HV Monitor | 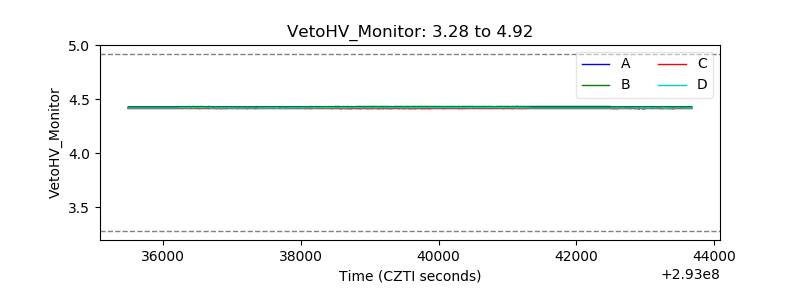 |
| Veto LLD |  |
| Alpha Counter | 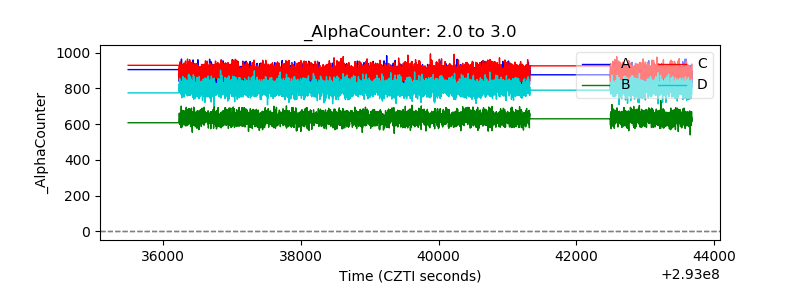 |
| _CPM_Rate | 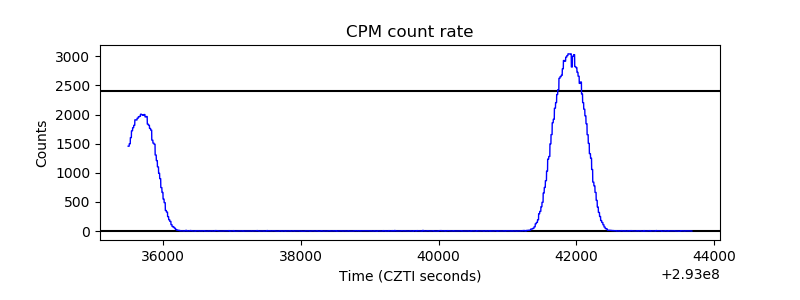 |
| CZT Counter | 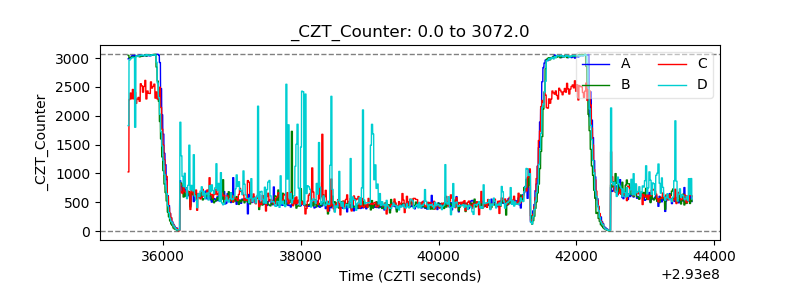 |
| +2.5 Volts monitor |  |
| +5 Volts monitor |  |
| _ROLL_ROT | 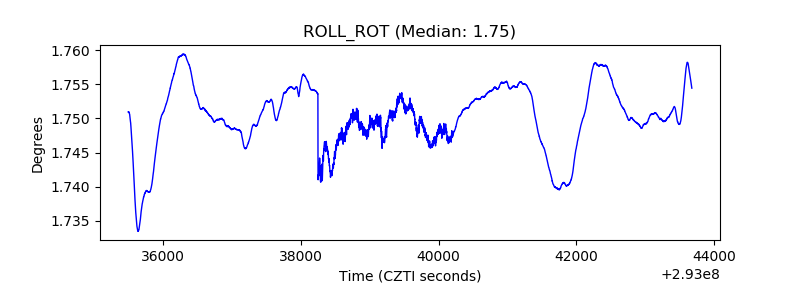 |
| _Roll_DEC | 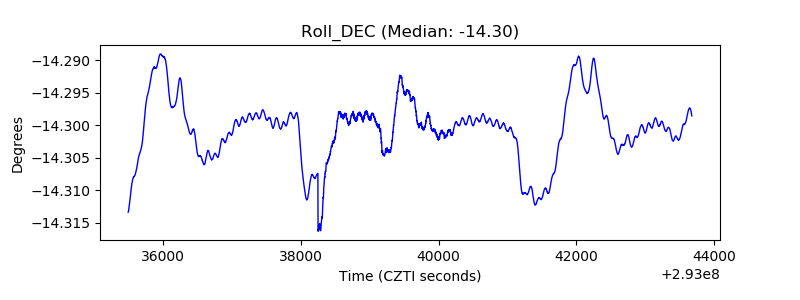 |
| _Roll_RA | 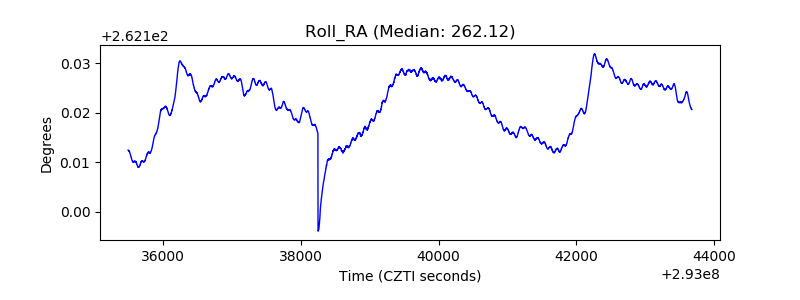 |
| Veto Counter | 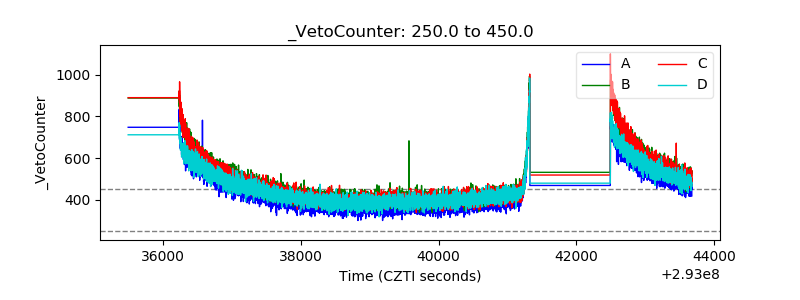 |