| Param | Original file | Final file |
|---|---|---|
| Filename | modeM0/AS1A05_046T01_9000002838_19178cztM0_level2.evt | modeM0/AS1A05_046T01_9000002838_19178cztM0_level2_quad_clean.evt |
| Size (bytes) | 474,920,640 | 101,661,120 |
| Size | 452.9 MB | 97.0 MB |
| Events in quadrant A | 3,209,654 | 663,994 |
| Events in quadrant B | 3,340,145 | 692,994 |
| Events in quadrant C | 3,681,404 | 658,404 |
| Events in quadrant D | 3,734,388 | 633,889 |
| Mode M0 | |||
|---|---|---|---|
| Quadrant | BADHDUFLAG | Total packets | Discarded packets |
| A | 0 | 13415 | 1 |
| B | 0 | 13777 | 2 |
| C | 0 | 14915 | 1 |
| D | 0 | 15219 | 1 |
| Mode SS | |||
|---|---|---|---|
| Quadrant | BADHDUFLAG | Total packets | Discarded packets |
| A | 0 | 126 | 0 |
| B | 0 | 126 | 0 |
| C | 0 | 126 | 0 |
| D | 0 | 126 | 0 |
| Mode M9 | |||
|---|---|---|---|
| Quadrant | BADHDUFLAG | Total packets | Discarded packets |
| A | 0 | 13 | 0 |
| B | 0 | 13 | 0 |
| C | 0 | 13 | 0 |
| D | 0 | 13 | 0 |
| Quadrant | Total seconds | Saturated seconds | Saturation percentage |
|---|---|---|---|
| A | 6151 | 46 | 0.747846% |
| B | 6150 | 70 | 1.138211% |
| C | 6150 | 93 | 1.512195% |
| D | 6150 | 118 | 1.918699% |
Noise dominated data is calculated using 1-second bins in cleaned event files. If a bin has >2000 counts, and if more than 50% of those come from <1% of pixels, then it is considered to be noise-dominated and hence unusable.
| Quadrant | # 1 sec bins | Bins with >0 counts | Bins with >2000 counts | High rate bins dominated by noise | Noise dominated (total time) | Noise dominated (detector-on time) | Marked lightcurve |
|---|---|---|---|---|---|---|---|
| A | 7481 | 6152 | 0 | 0 | 0.00% | 0.00% | 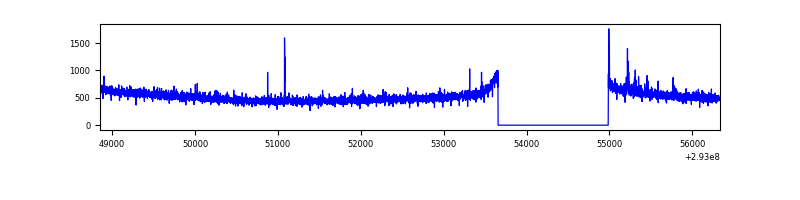 |
| B | 7480 | 6151 | 8 | 8 | 0.11% | 0.13% | 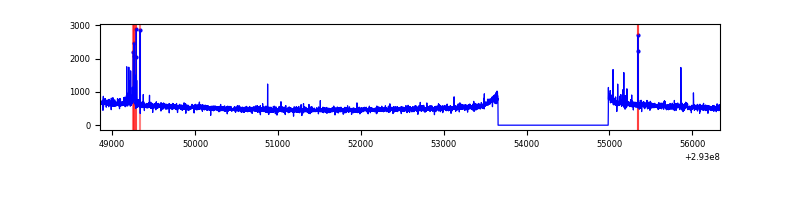 |
| C | 7480 | 6151 | 0 | 0 | 0.00% | 0.00% | 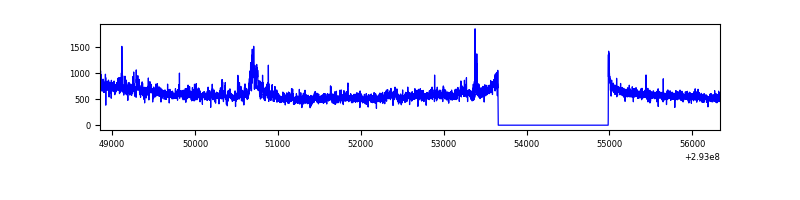 |
| D | 7479 | 6150 | 53 | 53 | 0.71% | 0.86% | 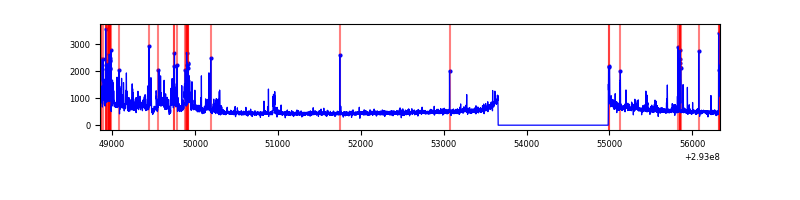 |
Top three noisy pixels from each quadrant. If the there are fewer than three noisy pixels in the level2.evt file, extra rows are filled as -1
| Pixel properties | Quadrant properties | ||||||
|---|---|---|---|---|---|---|---|
| Quadrant | DetID | PixID | Counts | Sigma | Mean | Median | Sigma |
| A | 14 | 235 | 34340 | 203.21 | 821 | 805 | 165.0 |
| A | 13 | 254 | 8514 | 46.71 | 821 | 805 | 165.0 |
| A | 0 | 226 | 7292 | 39.31 | 821 | 805 | 165.0 |
| B | 6 | 36 | 44895 | 287.27 | 830 | 813 | 153.5 |
| B | 12 | 111 | 17889 | 111.28 | 830 | 813 | 153.5 |
| B | 11 | 111 | 15535 | 95.94 | 830 | 813 | 153.5 |
| C | 3 | 233 | 436893 | 2355.57 | 797 | 805 | 185.1 |
| C | 14 | 238 | 125609 | 674.14 | 797 | 805 | 185.1 |
| C | 0 | 207 | 11367 | 57.05 | 797 | 805 | 185.1 |
| D | 10 | 66 | 487655 | 2539.87 | 797 | 775 | 191.7 |
| D | 1 | 52 | 116678 | 604.62 | 797 | 775 | 191.7 |
| D | 11 | 176 | 83630 | 432.22 | 797 | 775 | 191.7 |
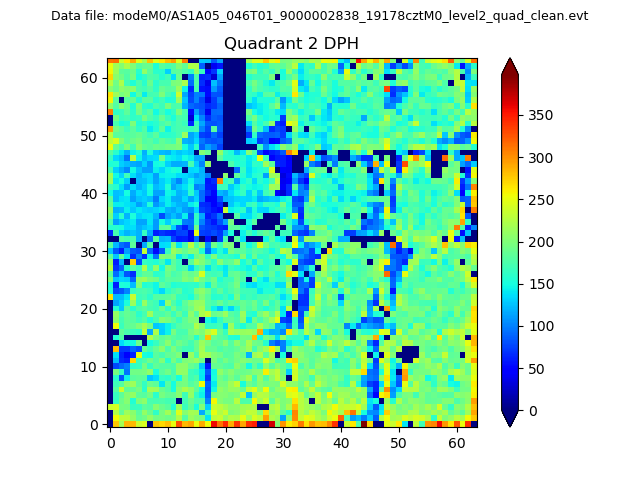
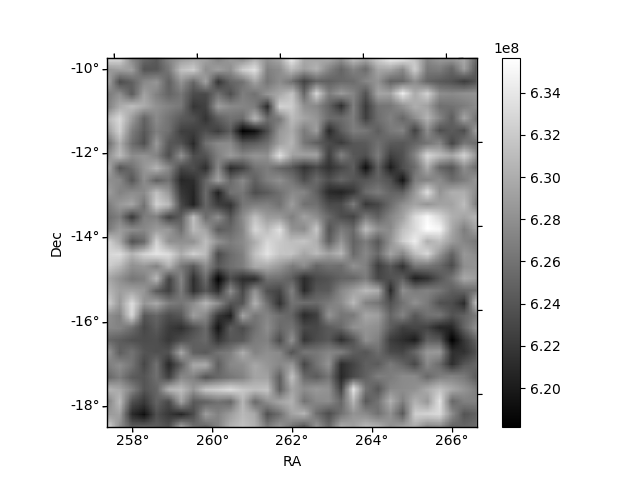
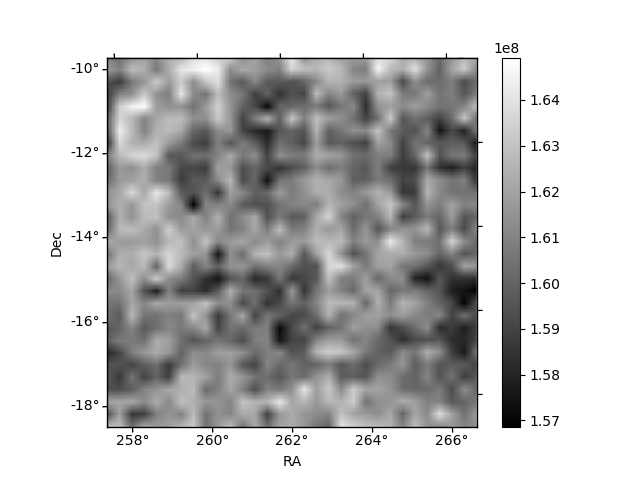
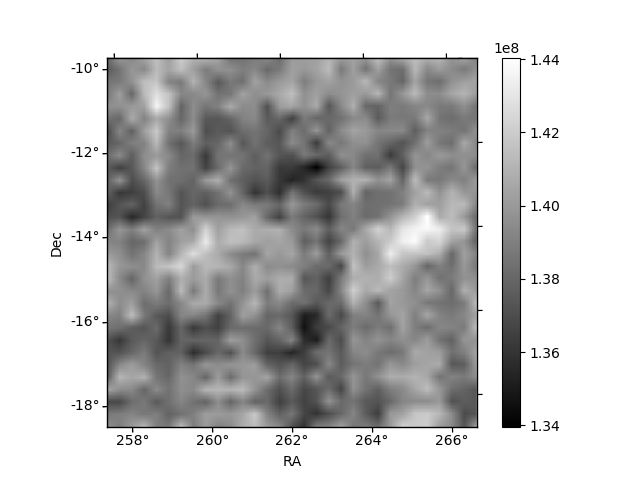
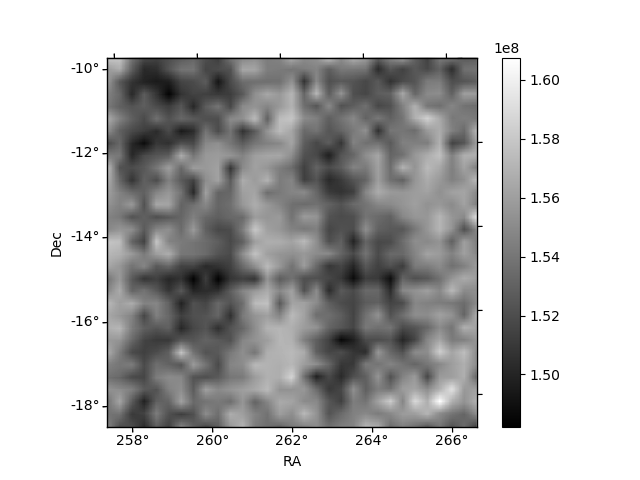
Histogram calculated using DETX and DETY for each event in the final _common_clean file
| Quadrant A | 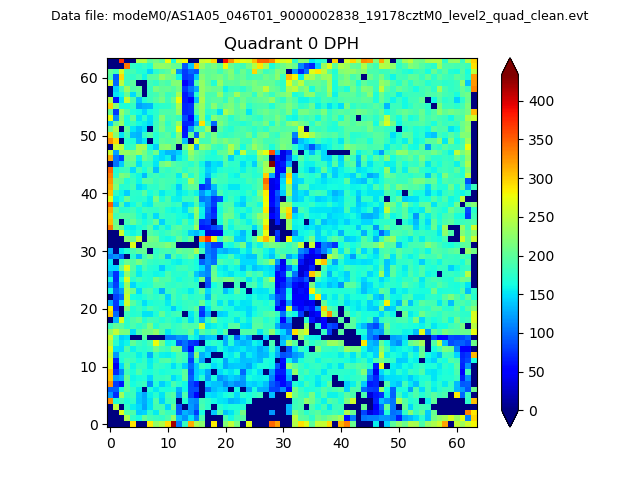 |
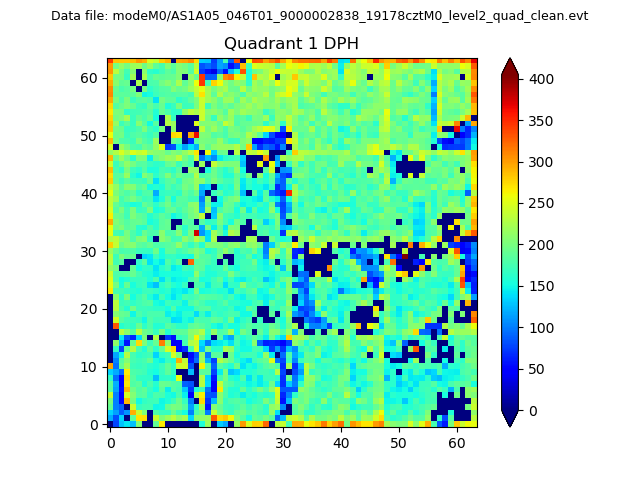 |
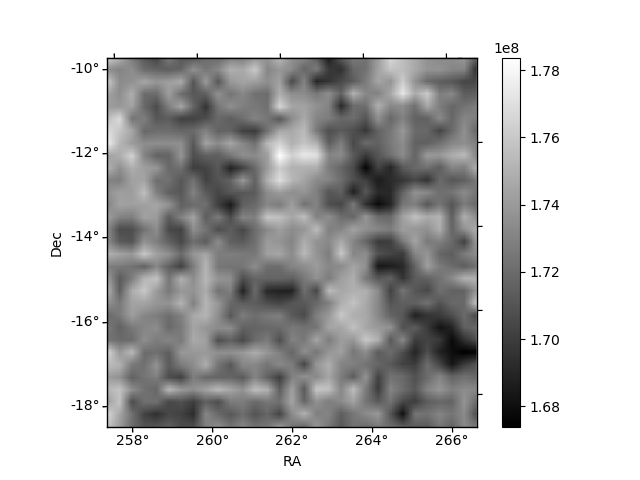
Quadrant B |
|---|---|---|---|
| Quadrant D | 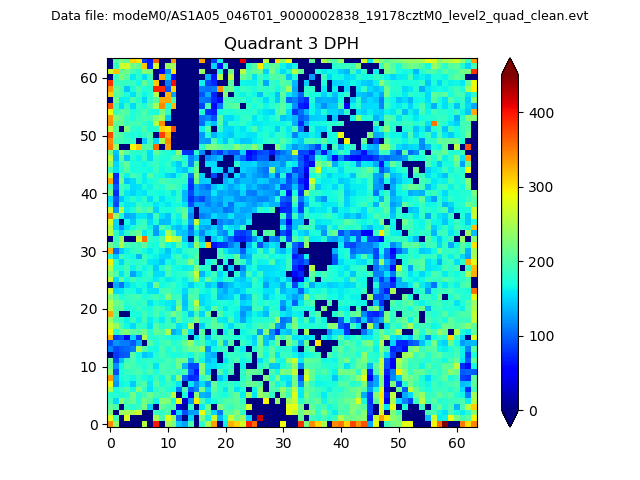 |
 |
Quadrant C |
| Plot type | Count rate plots | Images |
|---|---|---|
| Comparison with Poisson distribution Blue bars denote a histogram of data divided into 1 sec bins. Red curve is a Poisson curve with rate = median count rate of data. |
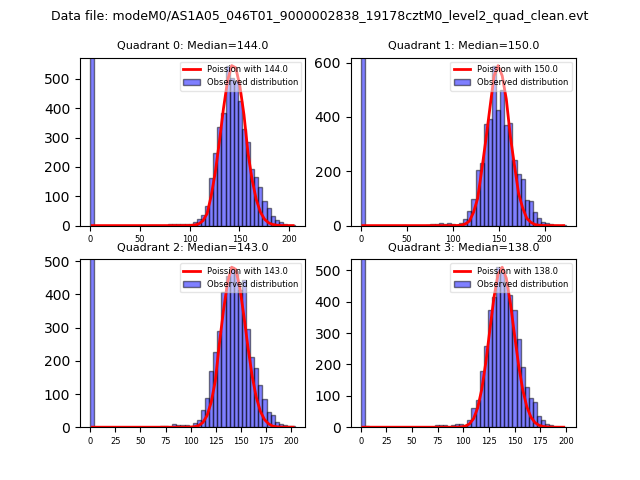 |
 |
| Quadrant-wise count rates Data is divided into 100 sec bins |
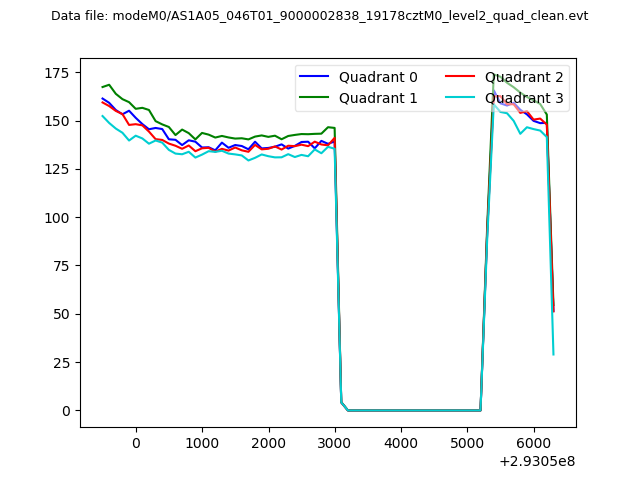 |
|
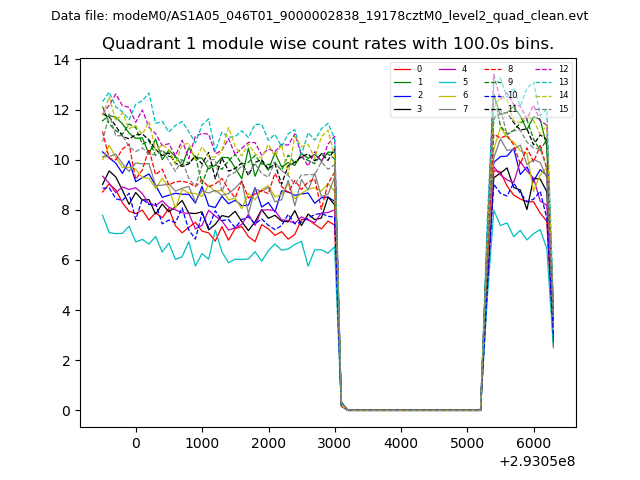
| Module-wise count rates for Quadrant A Data is divided into 100 sec bins |
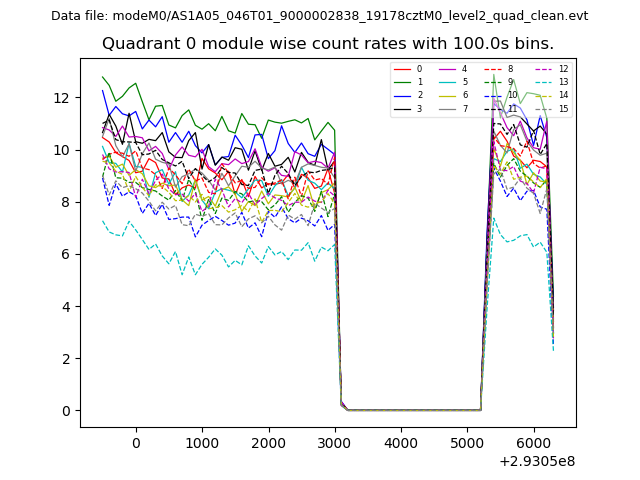 |
 |
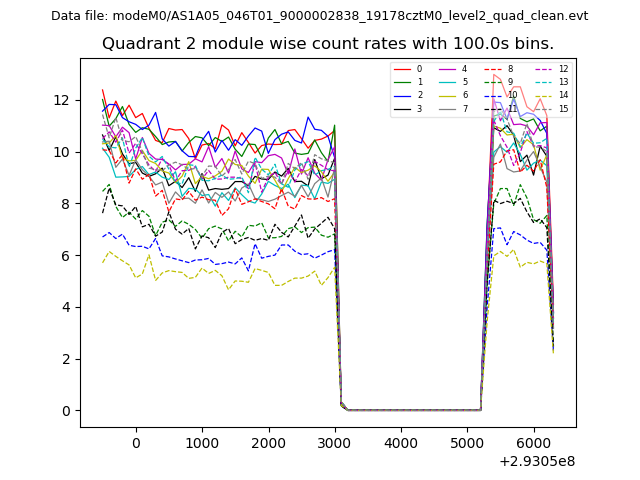
| Module-wise count rates for Quadrant B Data is divided into 100 sec bins |
 |
 |
| Module-wise count rates for Quadrant C Data is divided into 100 sec bins |
 |
 |
| Module-wise count rates for Quadrant D Data is divided into 100 sec bins |
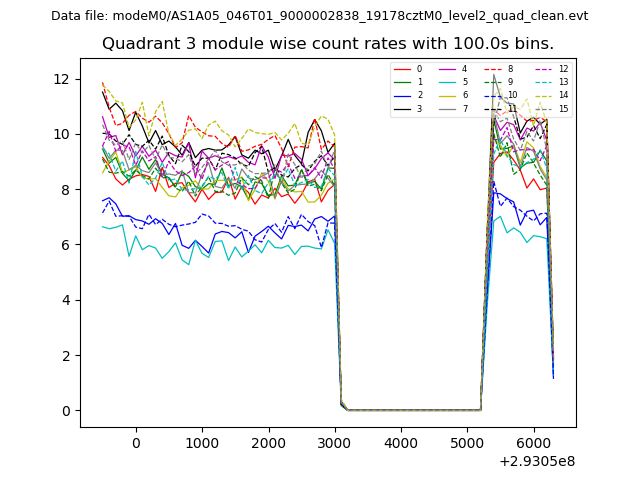 |
 |
| Parameter | Plot |
|---|---|
| CZT HV Monitor | 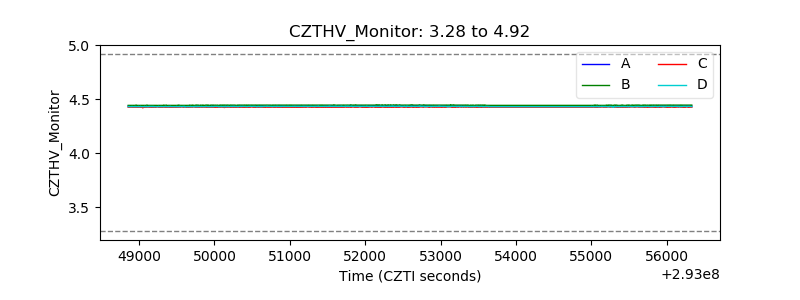 |
| D_VDD | 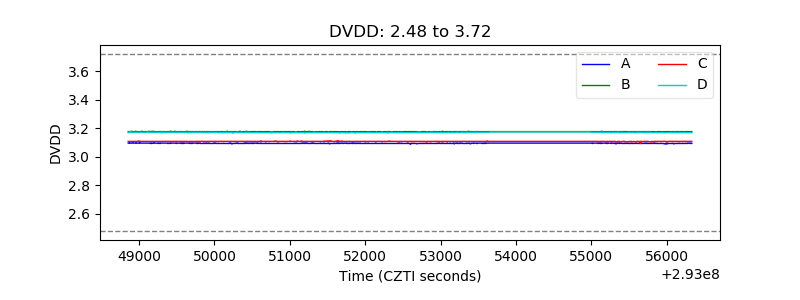 |
| Temperature 1 | 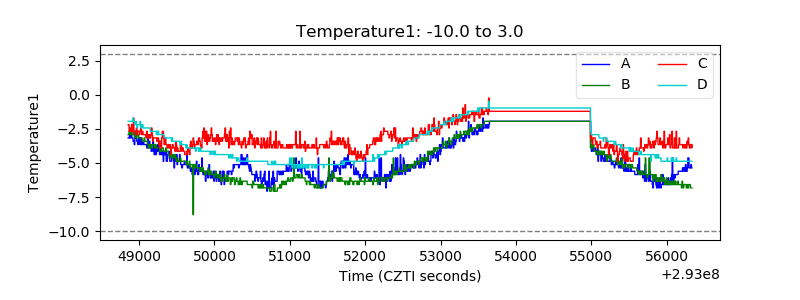 |
| Veto HV Monitor | 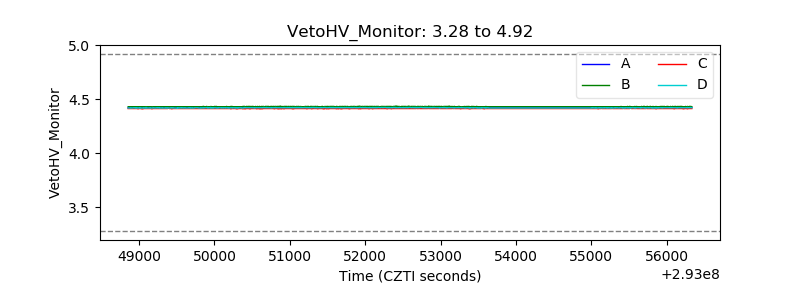 |
| Veto LLD | 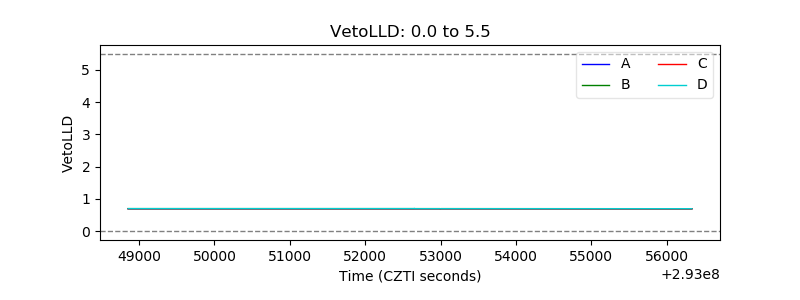 |
| Alpha Counter | 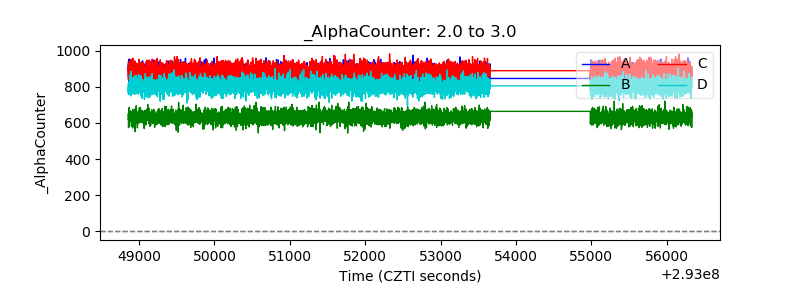 |
| _CPM_Rate | 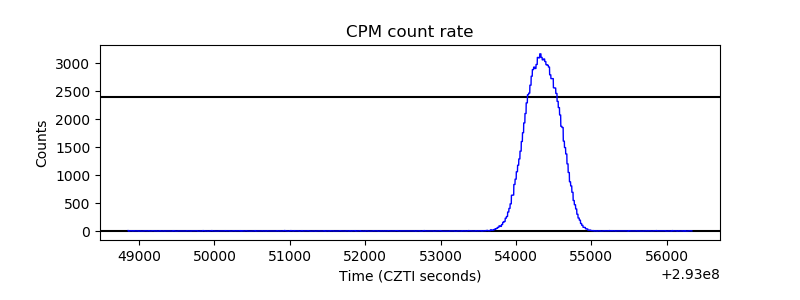 |
| CZT Counter |  |
| +2.5 Volts monitor |  |
| +5 Volts monitor | 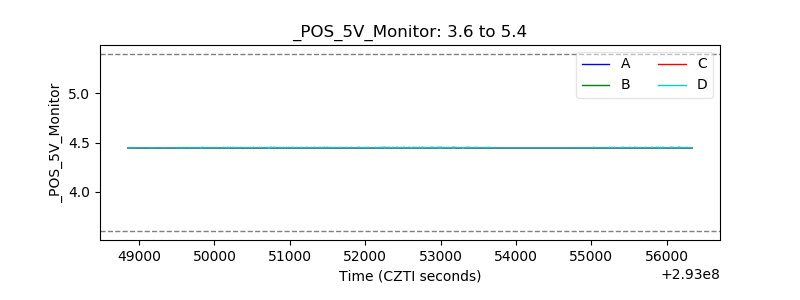 |
| _ROLL_ROT | 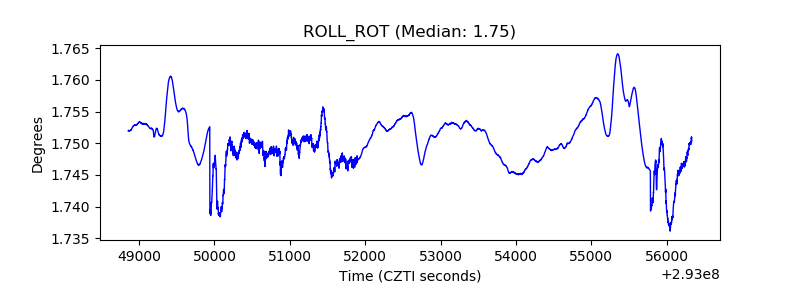 |
| _Roll_DEC | 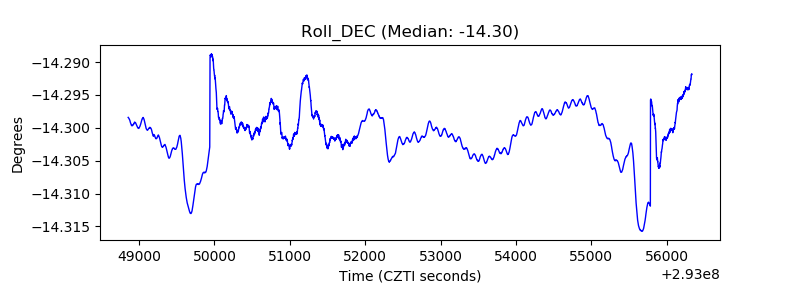 |
| _Roll_RA |  |
| Veto Counter | 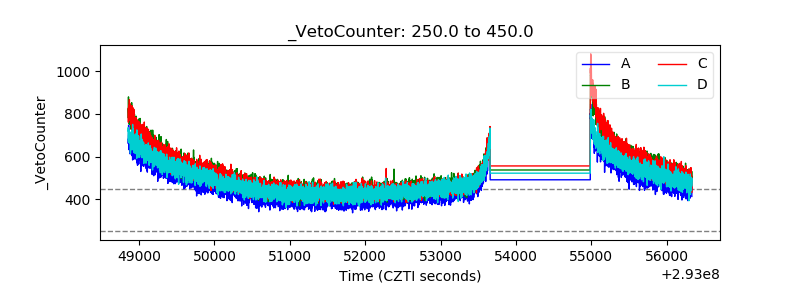 |