| Param | Original file | Final file |
|---|---|---|
| Filename | modeM0/AS1A05_046T01_9000002838_19179cztM0_level2.evt | modeM0/AS1A05_046T01_9000002838_19179cztM0_level2_quad_clean.evt |
| Size (bytes) | 491,728,320 | 107,233,920 |
| Size | 468.9 MB | 102.3 MB |
| Events in quadrant A | 3,430,300 | 695,915 |
| Events in quadrant B | 3,532,982 | 727,770 |
| Events in quadrant C | 3,712,225 | 698,394 |
| Events in quadrant D | 3,764,852 | 661,791 |
| Mode M0 | |||
|---|---|---|---|
| Quadrant | BADHDUFLAG | Total packets | Discarded packets |
| A | 0 | 14362 | 2 |
| B | 0 | 14640 | 2 |
| C | 0 | 15045 | 2 |
| D | 0 | 15622 | 2 |
| Mode SS | |||
|---|---|---|---|
| Quadrant | BADHDUFLAG | Total packets | Discarded packets |
| A | 0 | 138 | 0 |
| B | 0 | 138 | 0 |
| C | 0 | 138 | 0 |
| D | 0 | 138 | 0 |
| Mode M9 | |||
|---|---|---|---|
| Quadrant | BADHDUFLAG | Total packets | Discarded packets |
| A | 0 | 26 | 0 |
| B | 0 | 26 | 0 |
| C | 0 | 26 | 0 |
| D | 0 | 26 | 0 |
| Quadrant | Total seconds | Saturated seconds | Saturation percentage |
|---|---|---|---|
| A | 6648 | 104 | 1.564380% |
| B | 6648 | 129 | 1.940433% |
| C | 6648 | 154 | 2.316486% |
| D | 6649 | 138 | 2.075500% |
Noise dominated data is calculated using 1-second bins in cleaned event files. If a bin has >2000 counts, and if more than 50% of those come from <1% of pixels, then it is considered to be noise-dominated and hence unusable.
| Quadrant | # 1 sec bins | Bins with >0 counts | Bins with >2000 counts | High rate bins dominated by noise | Noise dominated (total time) | Noise dominated (detector-on time) | Marked lightcurve |
|---|---|---|---|---|---|---|---|
| A | 9298 | 6650 | 0 | 0 | 0.00% | 0.00% | 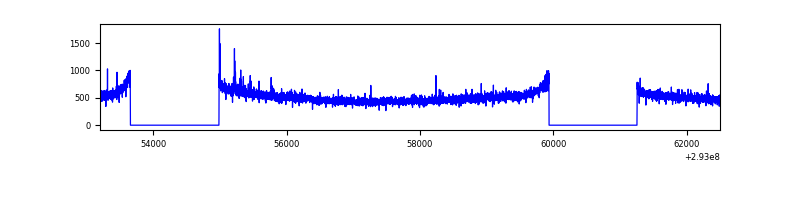 |
| B | 9298 | 6650 | 2 | 2 | 0.02% | 0.03% | 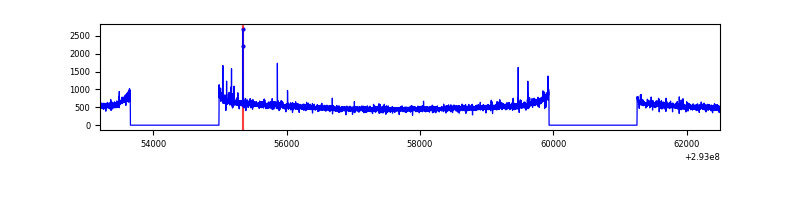 |
| C | 9298 | 6650 | 1 | 1 | 0.01% | 0.02% | 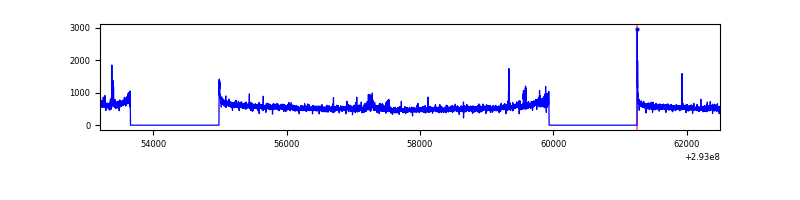 |
| D | 9299 | 6651 | 64 | 64 | 0.69% | 0.96% | 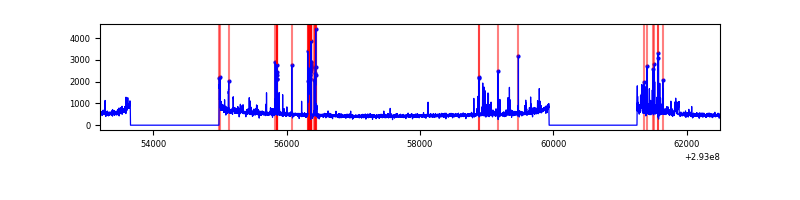 |
Top three noisy pixels from each quadrant. If the there are fewer than three noisy pixels in the level2.evt file, extra rows are filled as -1
| Pixel properties | Quadrant properties | ||||||
|---|---|---|---|---|---|---|---|
| Quadrant | DetID | PixID | Counts | Sigma | Mean | Median | Sigma |
| A | 14 | 235 | 26373 | 144.13 | 881 | 863 | 177.0 |
| A | 13 | 254 | 9225 | 47.24 | 881 | 863 | 177.0 |
| A | 0 | 226 | 7792 | 39.15 | 881 | 863 | 177.0 |
| B | 12 | 111 | 19749 | 112.35 | 892 | 870 | 168.0 |
| B | 11 | 111 | 17118 | 96.69 | 892 | 870 | 168.0 |
| B | 14 | 111 | 14774 | 82.74 | 892 | 870 | 168.0 |
| C | 3 | 233 | 204339 | 1015.8 | 861 | 869 | 200.3 |
| C | 14 | 238 | 134123 | 665.25 | 861 | 869 | 200.3 |
| C | 0 | 207 | 18867 | 89.85 | 861 | 869 | 200.3 |
| D | 11 | 176 | 293853 | 1418.91 | 858 | 837 | 206.5 |
| D | 1 | 52 | 150185 | 723.21 | 858 | 837 | 206.5 |
| D | 9 | 68 | 65627 | 313.74 | 858 | 837 | 206.5 |
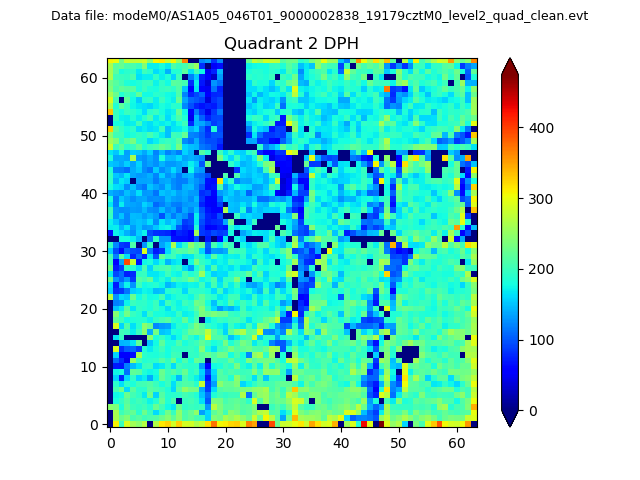
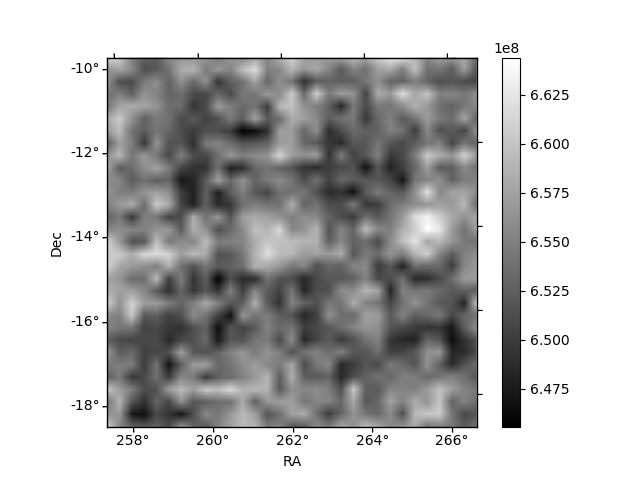
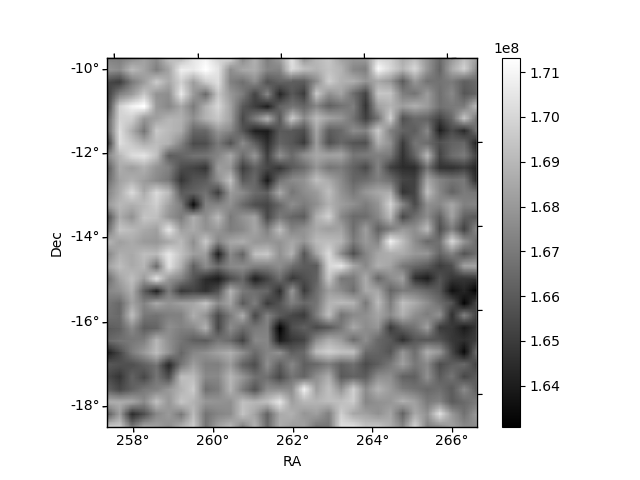
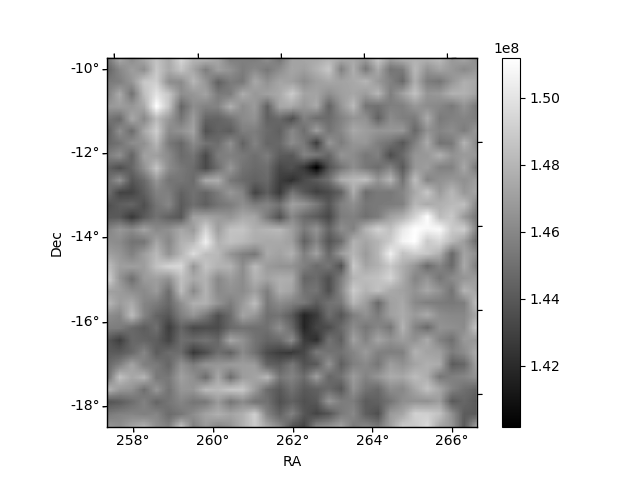
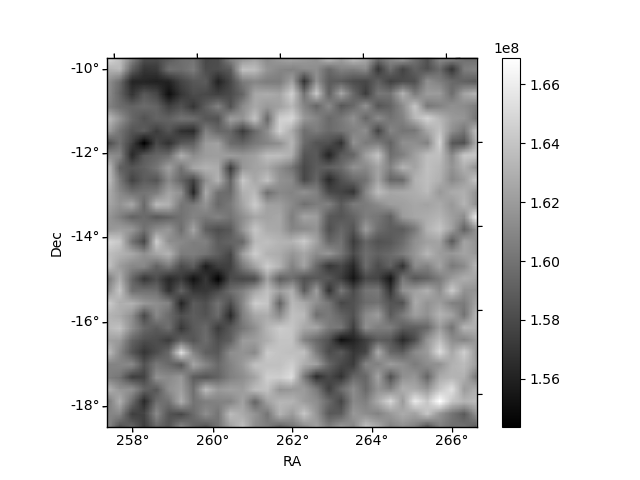
Histogram calculated using DETX and DETY for each event in the final _common_clean file
| Quadrant A | 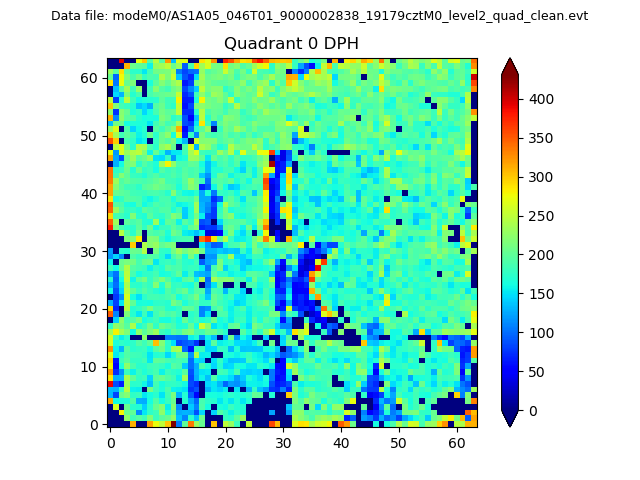 |
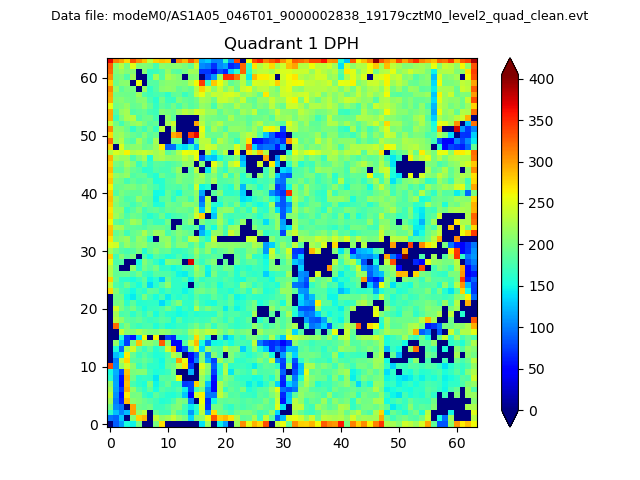 |
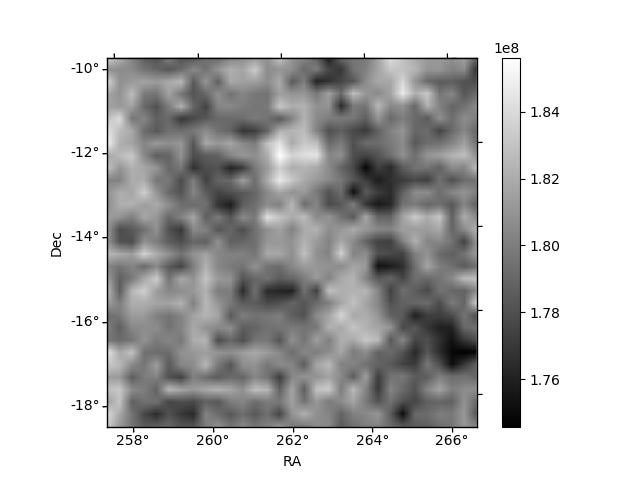
Quadrant B |
|---|---|---|---|
| Quadrant D | 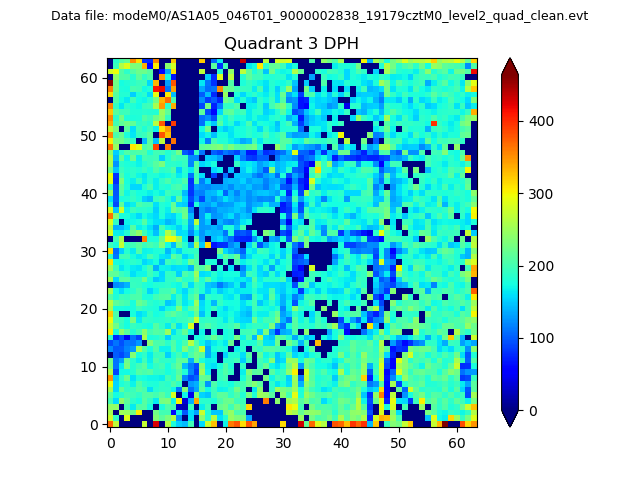 |
 |
Quadrant C |
| Plot type | Count rate plots | Images |
|---|---|---|
| Comparison with Poisson distribution Blue bars denote a histogram of data divided into 1 sec bins. Red curve is a Poisson curve with rate = median count rate of data. |
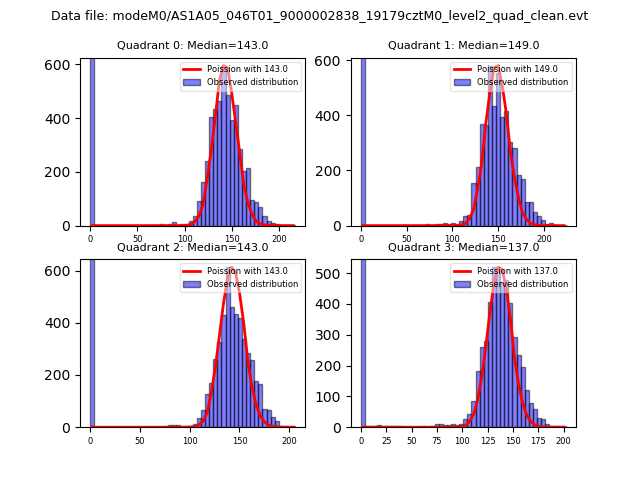 |
 |
| Quadrant-wise count rates Data is divided into 100 sec bins |
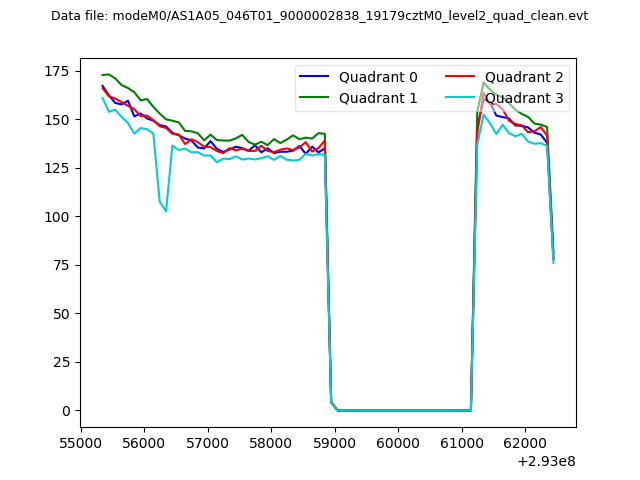 |
|
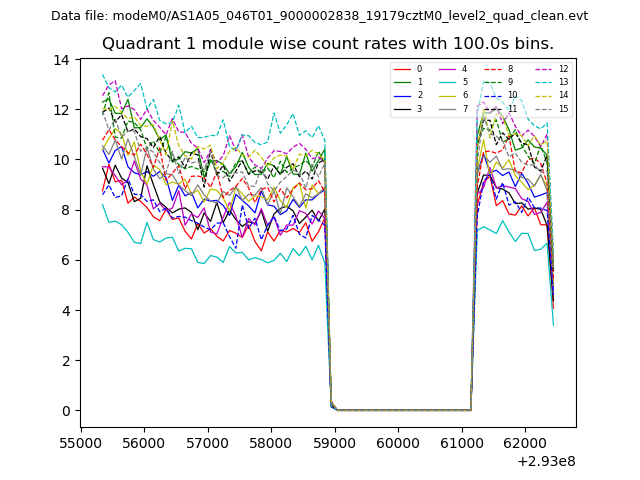
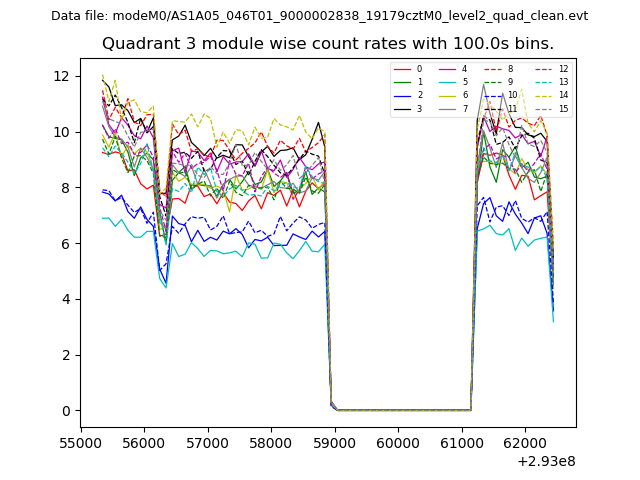
| Module-wise count rates for Quadrant A Data is divided into 100 sec bins |
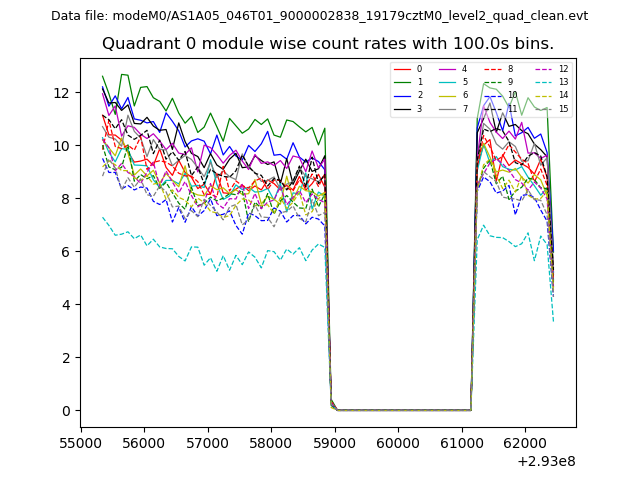 |
 |
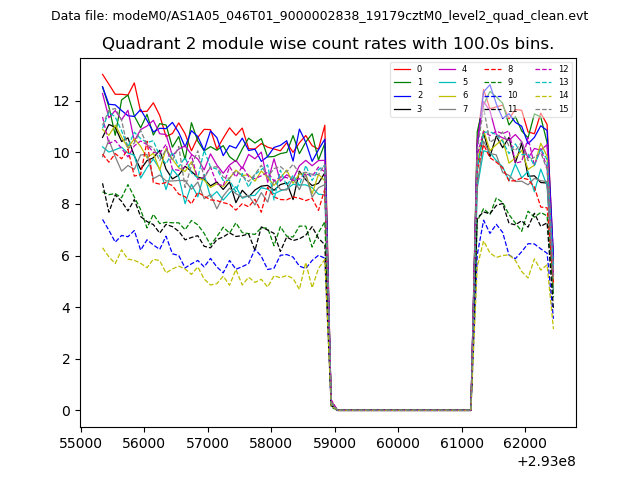
| Module-wise count rates for Quadrant B Data is divided into 100 sec bins |
 |
 |
| Module-wise count rates for Quadrant C Data is divided into 100 sec bins |
 |
 |
| Module-wise count rates for Quadrant D Data is divided into 100 sec bins |
 |
 |
| Parameter | Plot |
|---|---|
| CZT HV Monitor | 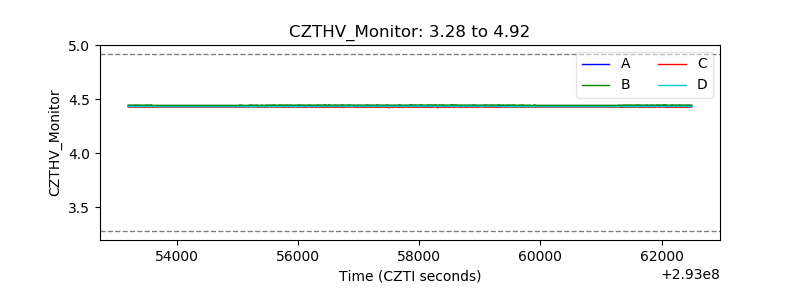 |
| D_VDD | 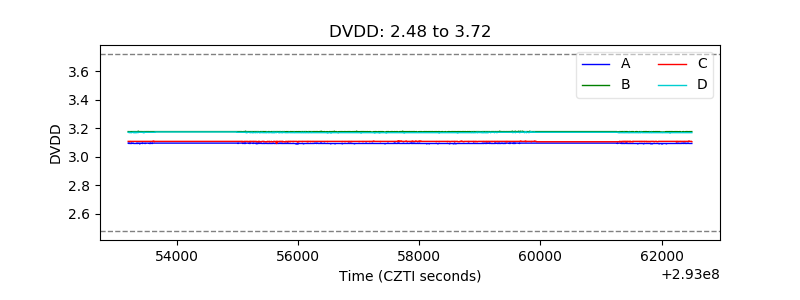 |
| Temperature 1 | 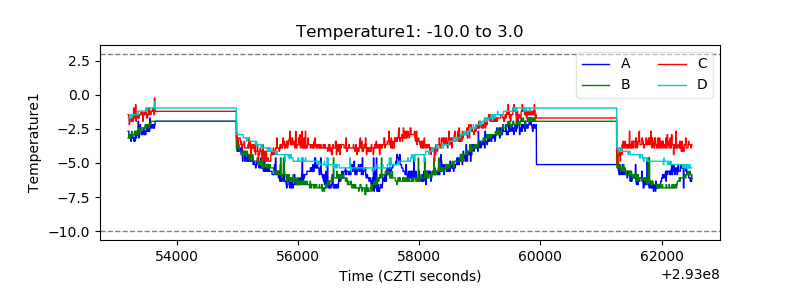 |
| Veto HV Monitor | 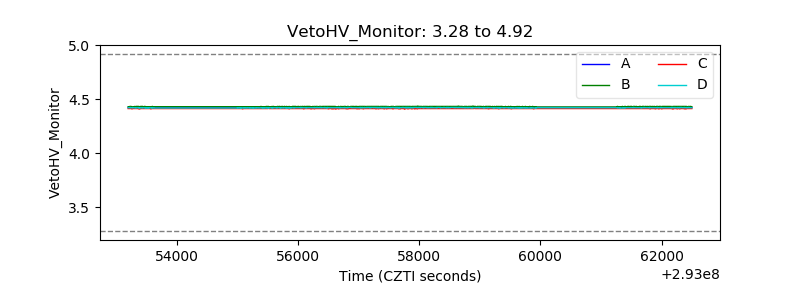 |
| Veto LLD | 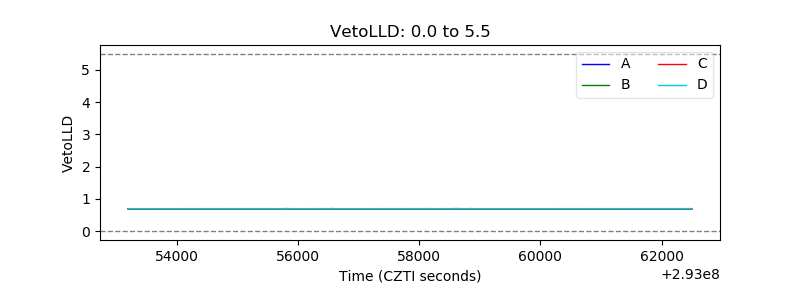 |
| Alpha Counter | 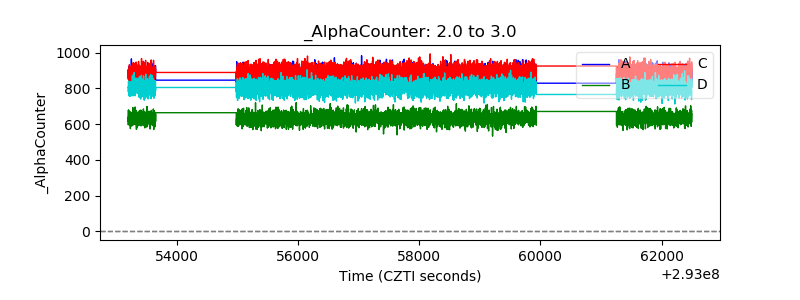 |
| _CPM_Rate | 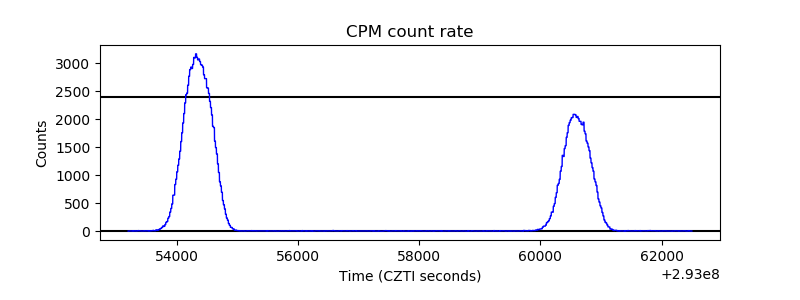 |
| CZT Counter | 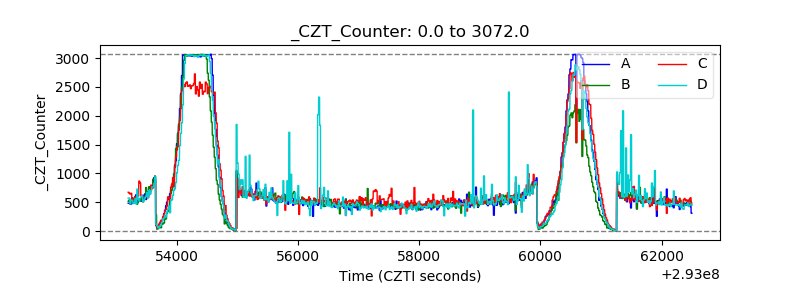 |
| +2.5 Volts monitor |  |
| +5 Volts monitor |  |
| _ROLL_ROT | 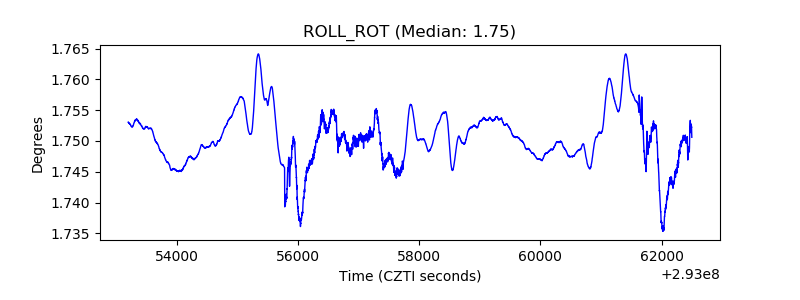 |
| _Roll_DEC |  |
| _Roll_RA | 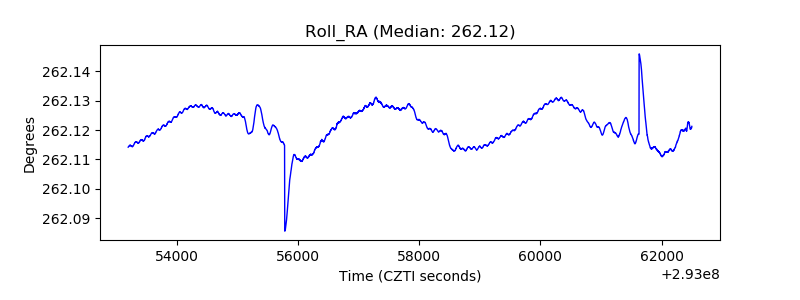 |
| Veto Counter | 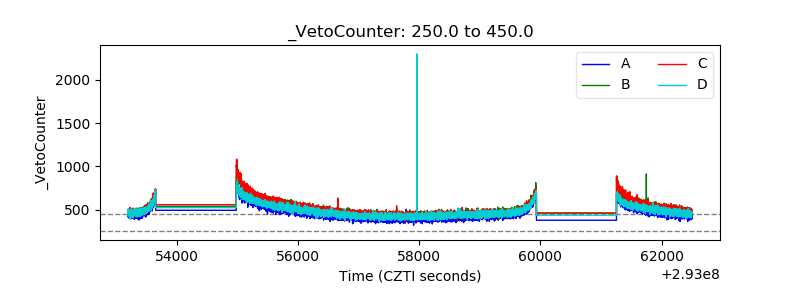 |