| Param | Original file | Final file |
|---|---|---|
| Filename | modeM0/AS1A05_046T01_9000002838_19180cztM0_level2.evt | modeM0/AS1A05_046T01_9000002838_19180cztM0_level2_quad_clean.evt |
| Size (bytes) | 451,984,320 | 102,499,200 |
| Size | 431.0 MB | 97.8 MB |
| Events in quadrant A | 3,070,207 | 662,825 |
| Events in quadrant B | 3,299,305 | 691,822 |
| Events in quadrant C | 3,382,120 | 668,896 |
| Events in quadrant D | 3,508,428 | 640,747 |
| Mode M0 | |||
|---|---|---|---|
| Quadrant | BADHDUFLAG | Total packets | Discarded packets |
| A | 0 | 13139 | 2 |
| B | 0 | 13756 | 2 |
| C | 0 | 13805 | 2 |
| D | 0 | 14761 | 2 |
| Mode SS | |||
|---|---|---|---|
| Quadrant | BADHDUFLAG | Total packets | Discarded packets |
| A | 0 | 128 | 0 |
| B | 0 | 128 | 0 |
| C | 0 | 128 | 0 |
| D | 0 | 128 | 0 |
| Mode M9 | |||
|---|---|---|---|
| Quadrant | BADHDUFLAG | Total packets | Discarded packets |
| A | 0 | 20 | 0 |
| B | 0 | 21 | 0 |
| C | 0 | 21 | 0 |
| D | 0 | 21 | 0 |
| Quadrant | Total seconds | Saturated seconds | Saturation percentage |
|---|---|---|---|
| A | 6305 | 21 | 0.333069% |
| B | 6305 | 101 | 1.601903% |
| C | 6305 | 82 | 1.300555% |
| D | 6305 | 82 | 1.300555% |
Noise dominated data is calculated using 1-second bins in cleaned event files. If a bin has >2000 counts, and if more than 50% of those come from <1% of pixels, then it is considered to be noise-dominated and hence unusable.
| Quadrant | # 1 sec bins | Bins with >0 counts | Bins with >2000 counts | High rate bins dominated by noise | Noise dominated (total time) | Noise dominated (detector-on time) | Marked lightcurve |
|---|---|---|---|---|---|---|---|
| A | 7495 | 6306 | 0 | 0 | 0.00% | 0.00% | 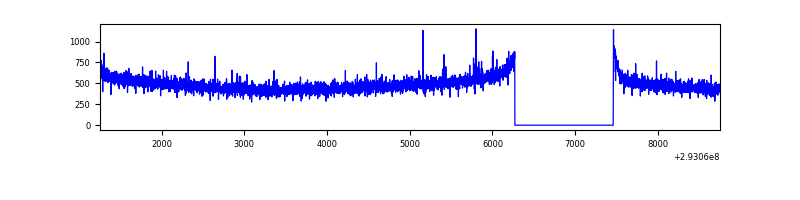 |
| B | 7495 | 6306 | 20 | 20 | 0.27% | 0.32% | 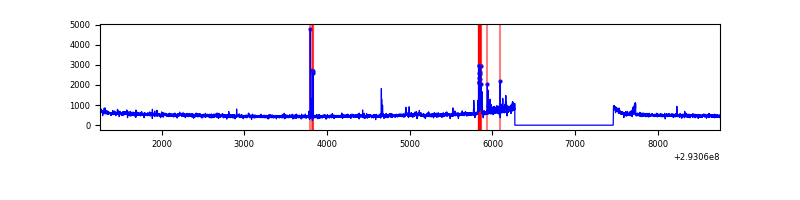 |
| C | 7495 | 6306 | 4 | 4 | 0.05% | 0.06% | 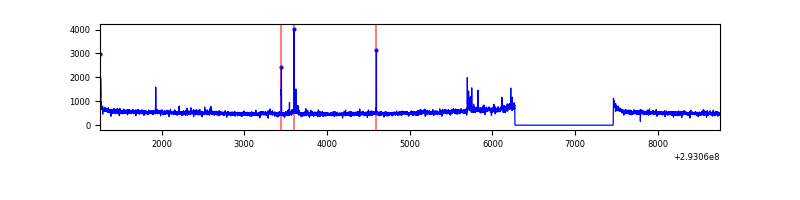 |
| D | 7495 | 6306 | 37 | 37 | 0.49% | 0.59% | 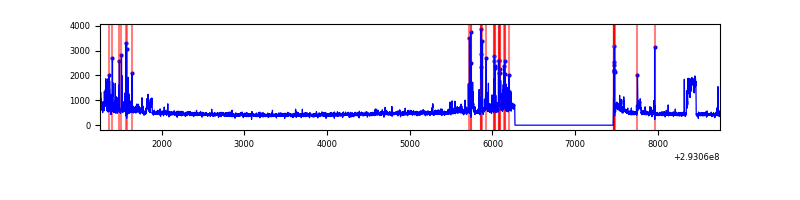 |
Top three noisy pixels from each quadrant. If the there are fewer than three noisy pixels in the level2.evt file, extra rows are filled as -1
| Pixel properties | Quadrant properties | ||||||
|---|---|---|---|---|---|---|---|
| Quadrant | DetID | PixID | Counts | Sigma | Mean | Median | Sigma |
| A | 11 | 29 | 7785 | 43.85 | 793 | 776 | 159.9 |
| A | 13 | 254 | 7474 | 41.9 | 793 | 776 | 159.9 |
| A | 0 | 226 | 6802 | 37.7 | 793 | 776 | 159.9 |
| B | 7 | 220 | 91306 | 596.93 | 802 | 781 | 151.7 |
| B | 3 | 64 | 26406 | 168.97 | 802 | 781 | 151.7 |
| B | 0 | 189 | 25289 | 161.61 | 802 | 781 | 151.7 |
| C | 3 | 233 | 210032 | 1147.91 | 777 | 782 | 182.3 |
| C | 14 | 238 | 119988 | 653.94 | 777 | 782 | 182.3 |
| C | 0 | 207 | 22911 | 121.4 | 777 | 782 | 182.3 |
| D | 11 | 176 | 311619 | 1641.32 | 778 | 758 | 189.4 |
| D | 1 | 52 | 191917 | 1009.31 | 778 | 758 | 189.4 |
| D | 9 | 68 | 69416 | 362.51 | 778 | 758 | 189.4 |
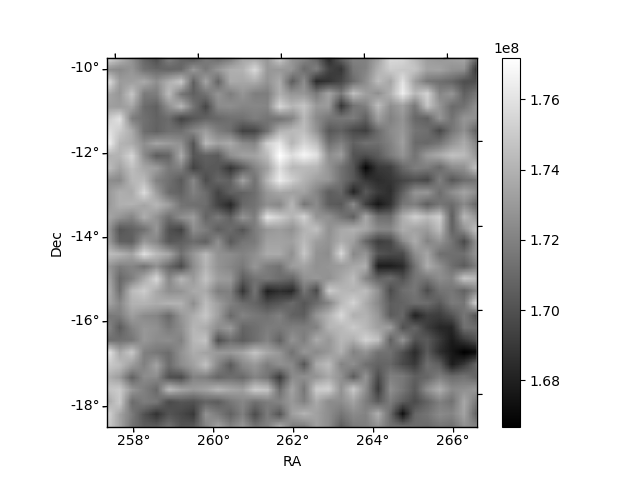
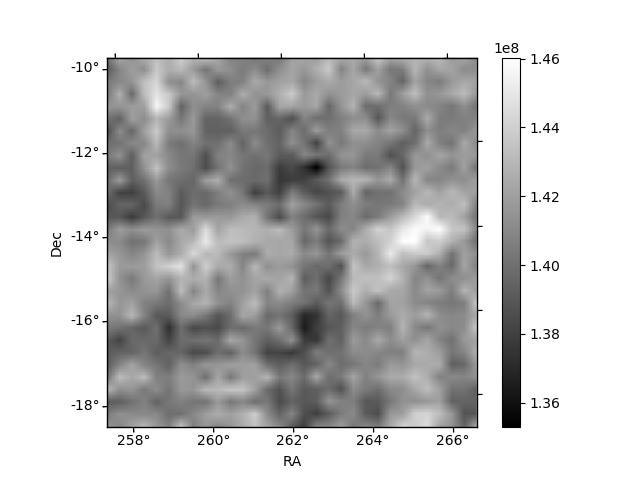
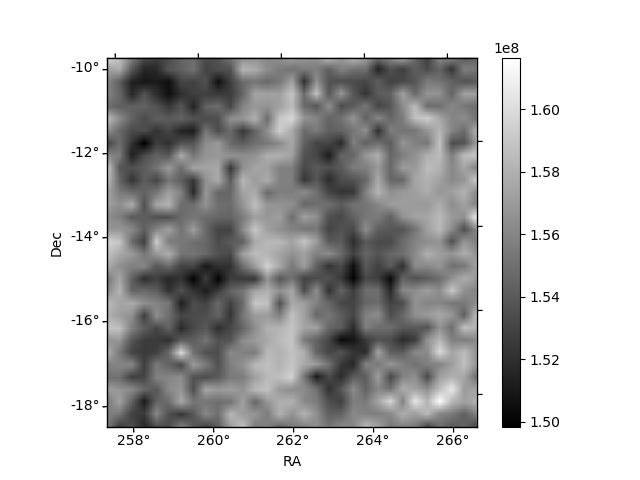
Histogram calculated using DETX and DETY for each event in the final _common_clean file
| Quadrant A | 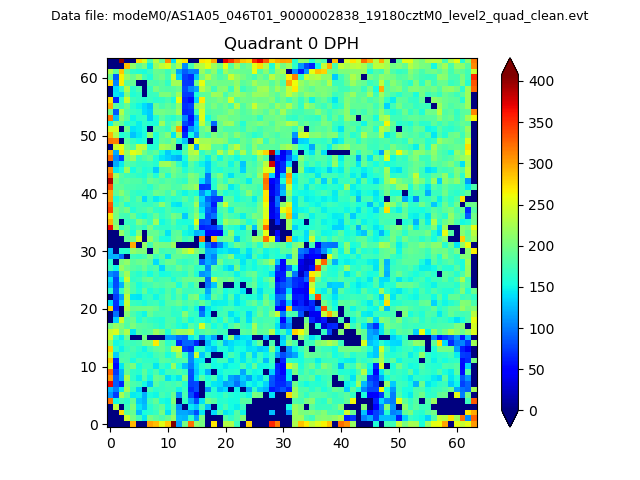 |
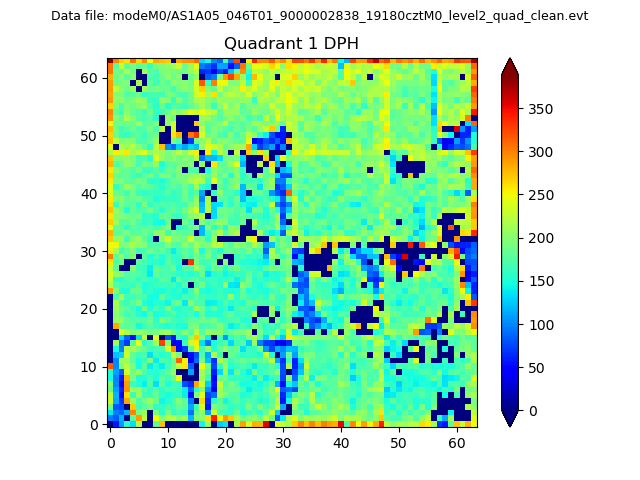 |
Quadrant B |
|---|---|---|---|
| Quadrant D | 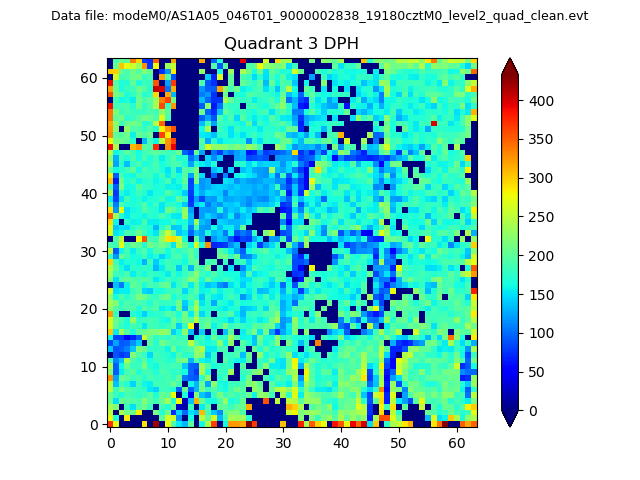 |
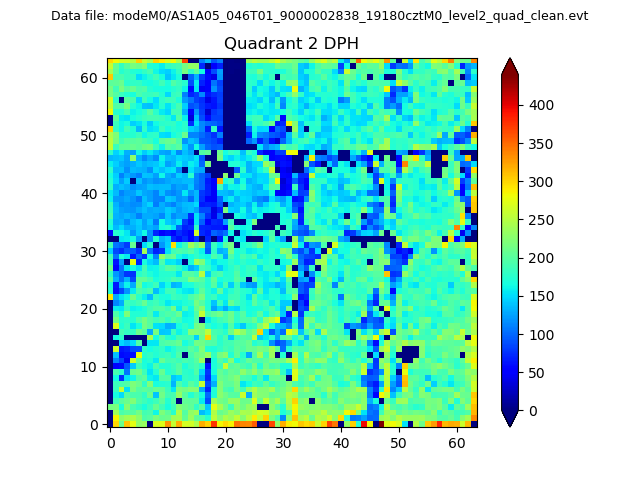 |
Quadrant C |
| Plot type | Count rate plots | Images |
|---|---|---|
| Comparison with Poisson distribution Blue bars denote a histogram of data divided into 1 sec bins. Red curve is a Poisson curve with rate = median count rate of data. |
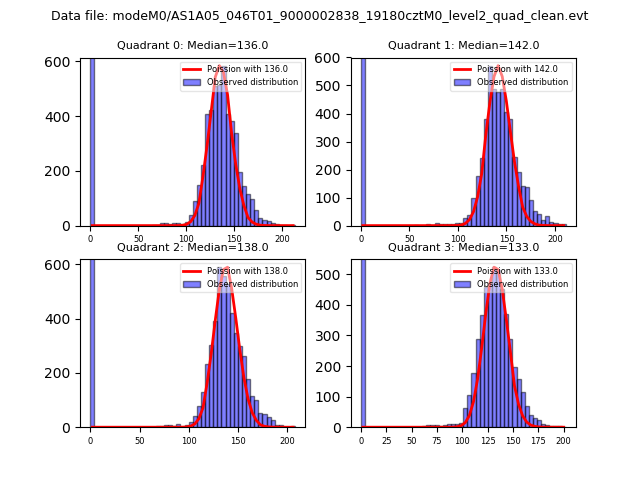 |
 |
| Quadrant-wise count rates Data is divided into 100 sec bins |
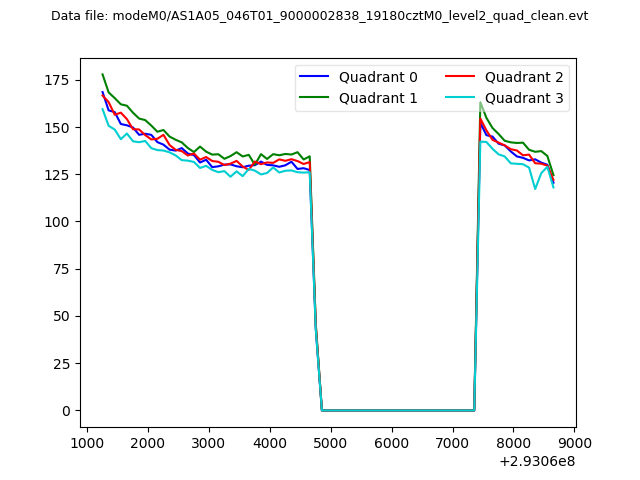 |
|
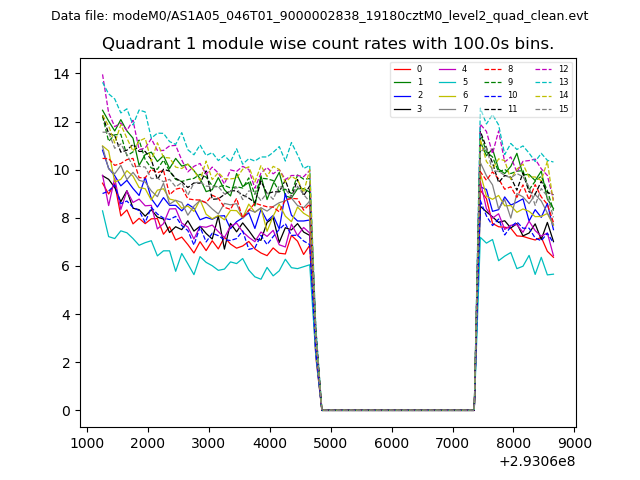
| Module-wise count rates for Quadrant A Data is divided into 100 sec bins |
 |
 |
| Module-wise count rates for Quadrant B Data is divided into 100 sec bins |
 |
 |
| Module-wise count rates for Quadrant C Data is divided into 100 sec bins |
 |
 |
| Module-wise count rates for Quadrant D Data is divided into 100 sec bins |
 |
 |
| Parameter | Plot |
|---|---|
| CZT HV Monitor | 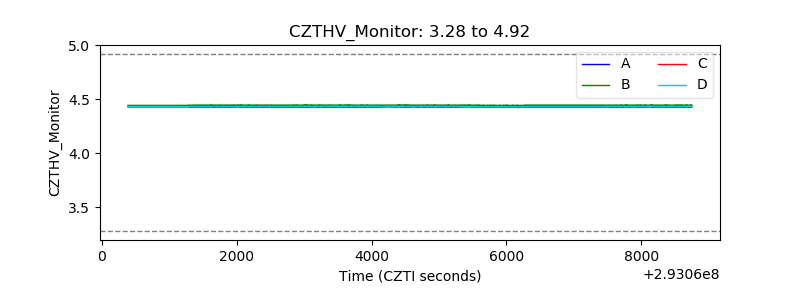 |
| D_VDD | 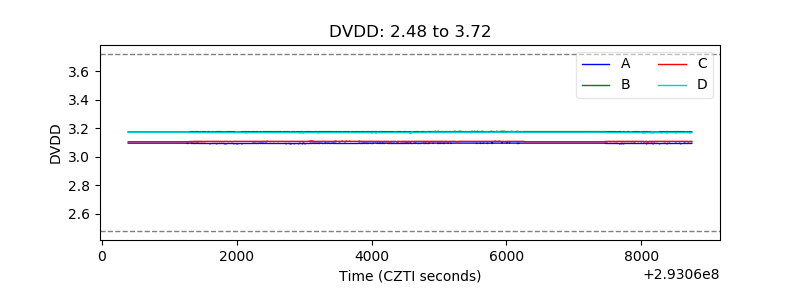 |
| Temperature 1 | 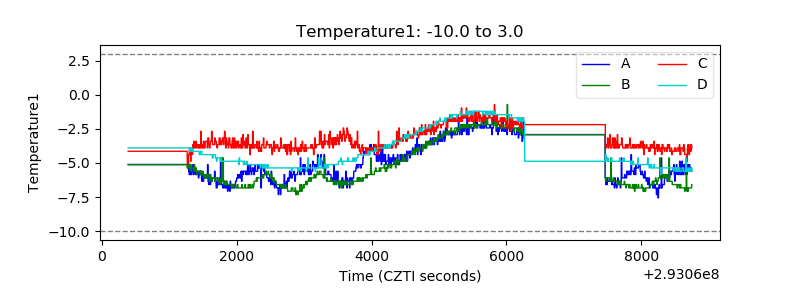 |
| Veto HV Monitor |  |
| Veto LLD | 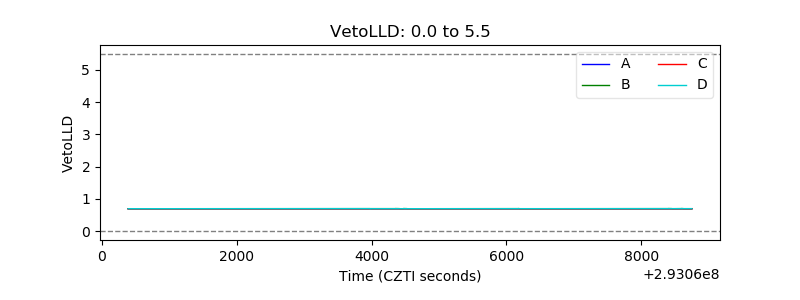 |
| Alpha Counter | 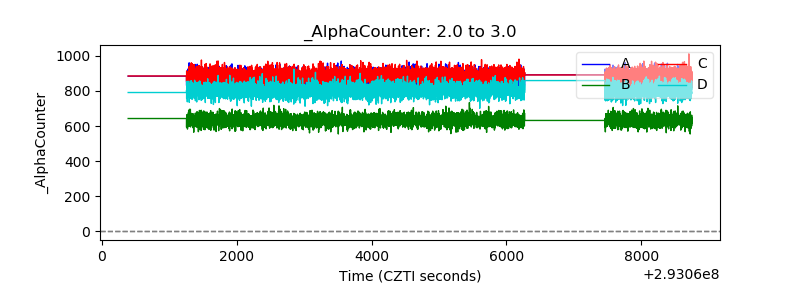 |
| _CPM_Rate | 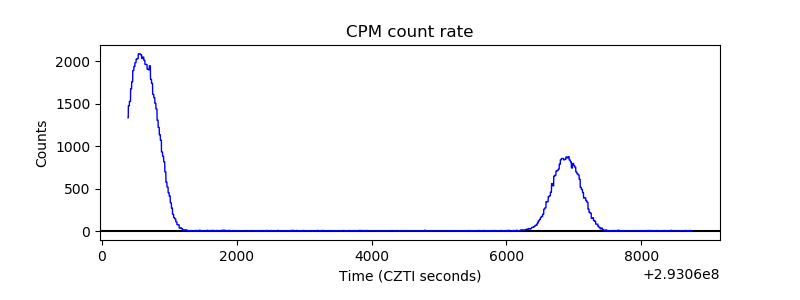 |
| CZT Counter | 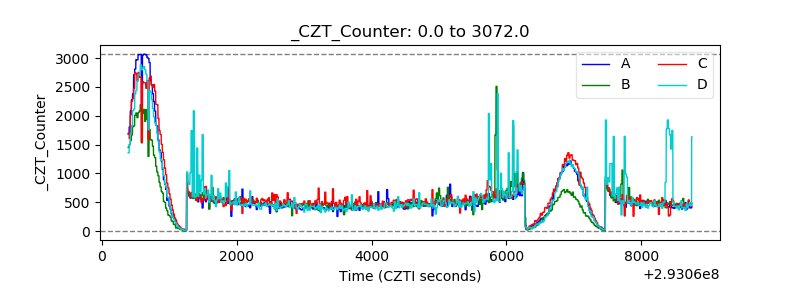 |
| +2.5 Volts monitor | 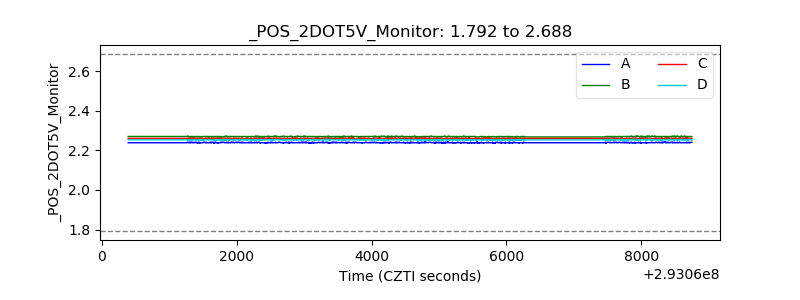 |
| +5 Volts monitor |  |
| _ROLL_ROT | 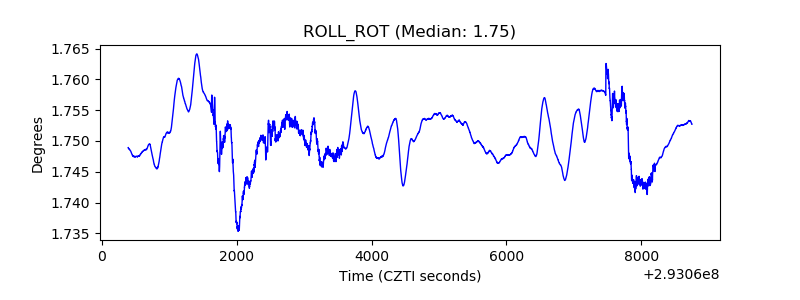 |
| _Roll_DEC |  |
| _Roll_RA | 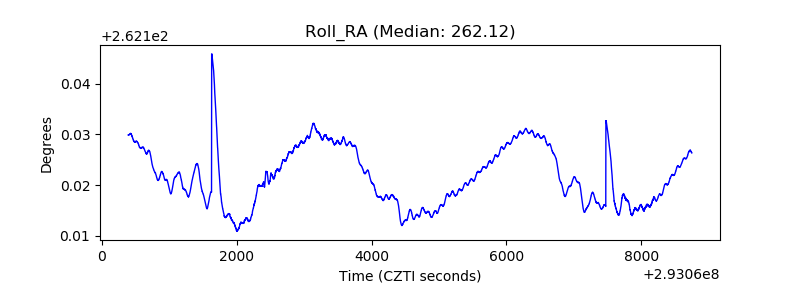 |
| Veto Counter | 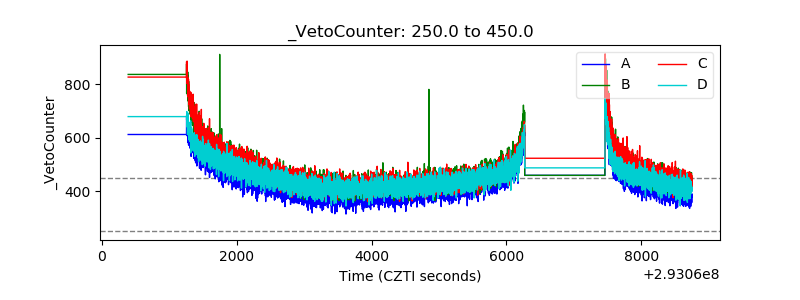 |