| Param | Original file | Final file |
|---|---|---|
| Filename | modeM0/AS1A05_046T01_9000002838_19181cztM0_level2.evt | modeM0/AS1A05_046T01_9000002838_19181cztM0_level2_quad_clean.evt |
| Size (bytes) | 475,839,360 | 92,678,400 |
| Size | 453.8 MB | 88.4 MB |
| Events in quadrant A | 3,167,669 | 585,268 |
| Events in quadrant B | 3,361,622 | 605,761 |
| Events in quadrant C | 3,432,089 | 588,499 |
| Events in quadrant D | 3,997,259 | 562,995 |
| Mode M0 | |||
|---|---|---|---|
| Quadrant | BADHDUFLAG | Total packets | Discarded packets |
| A | 0 | 13749 | 2 |
| B | 0 | 14259 | 2 |
| C | 0 | 14300 | 2 |
| D | 0 | 16533 | 2 |
| Mode SS | |||
|---|---|---|---|
| Quadrant | BADHDUFLAG | Total packets | Discarded packets |
| A | 0 | 134 | 0 |
| B | 0 | 134 | 0 |
| C | 0 | 134 | 0 |
| D | 0 | 134 | 0 |
| Mode M9 | |||
|---|---|---|---|
| Quadrant | BADHDUFLAG | Total packets | Discarded packets |
| A | 0 | 17 | 0 |
| B | 0 | 18 | 0 |
| C | 0 | 18 | 0 |
| D | 0 | 18 | 0 |
| Quadrant | Total seconds | Saturated seconds | Saturation percentage |
|---|---|---|---|
| A | 6661 | 19 | 0.285242% |
| B | 6661 | 63 | 0.945804% |
| C | 6661 | 74 | 1.110944% |
| D | 6661 | 254 | 3.813241% |
Noise dominated data is calculated using 1-second bins in cleaned event files. If a bin has >2000 counts, and if more than 50% of those come from <1% of pixels, then it is considered to be noise-dominated and hence unusable.
| Quadrant | # 1 sec bins | Bins with >0 counts | Bins with >2000 counts | High rate bins dominated by noise | Noise dominated (total time) | Noise dominated (detector-on time) | Marked lightcurve |
|---|---|---|---|---|---|---|---|
| A | 7581 | 6662 | 0 | 0 | 0.00% | 0.00% |  |
| B | 7581 | 6662 | 18 | 18 | 0.24% | 0.27% | 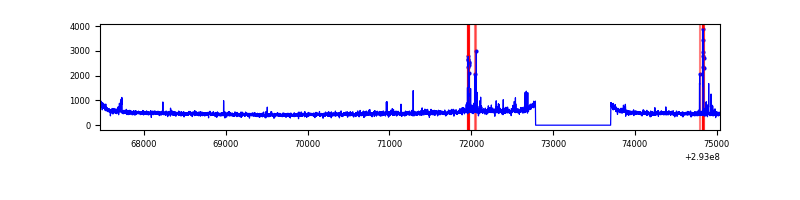 |
| C | 7581 | 6662 | 6 | 6 | 0.08% | 0.09% | 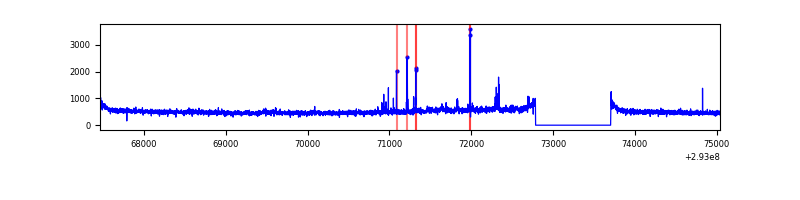 |
| D | 7581 | 6662 | 165 | 165 | 2.18% | 2.48% | 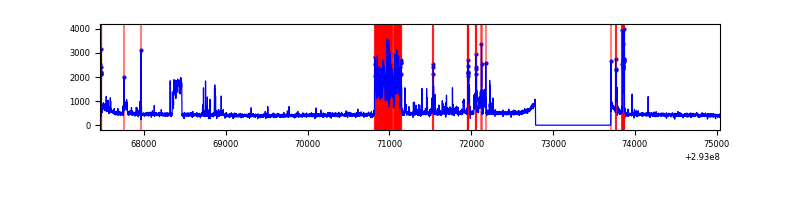 |
Top three noisy pixels from each quadrant. If the there are fewer than three noisy pixels in the level2.evt file, extra rows are filled as -1
| Pixel properties | Quadrant properties | ||||||
|---|---|---|---|---|---|---|---|
| Quadrant | DetID | PixID | Counts | Sigma | Mean | Median | Sigma |
| A | 11 | 29 | 15680 | 90.1 | 814 | 797 | 165.2 |
| A | 14 | 235 | 12260 | 69.4 | 814 | 797 | 165.2 |
| A | 13 | 254 | 8081 | 44.1 | 814 | 797 | 165.2 |
| B | 3 | 112 | 46587 | 293.62 | 819 | 799 | 155.9 |
| B | 7 | 220 | 43310 | 272.61 | 819 | 799 | 155.9 |
| B | 0 | 189 | 26957 | 167.74 | 819 | 799 | 155.9 |
| C | 3 | 233 | 156076 | 820.37 | 799 | 805 | 189.3 |
| C | 14 | 238 | 121569 | 638.06 | 799 | 805 | 189.3 |
| C | 0 | 207 | 43952 | 227.97 | 799 | 805 | 189.3 |
| D | 1 | 52 | 709128 | 3636.02 | 794 | 774 | 194.8 |
| D | 11 | 176 | 264629 | 1354.38 | 794 | 774 | 194.8 |
| D | 2 | 234 | 26052 | 129.75 | 794 | 774 | 194.8 |
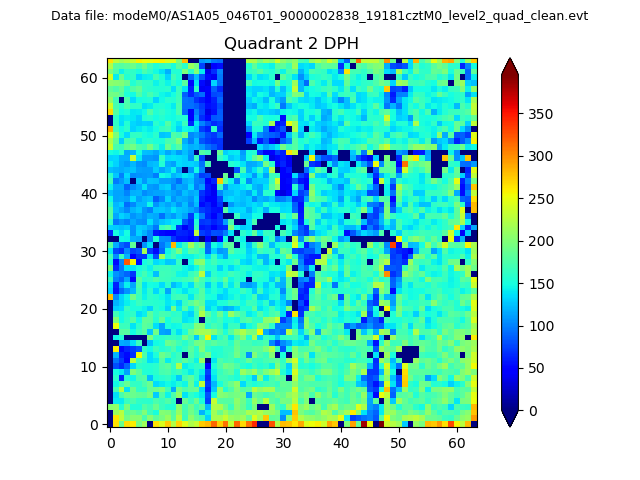
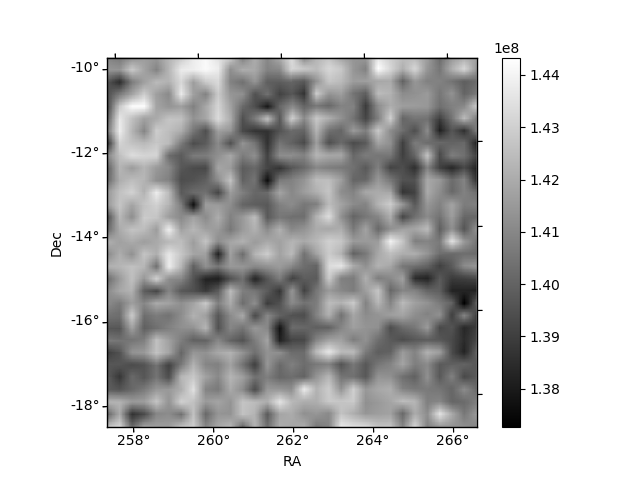
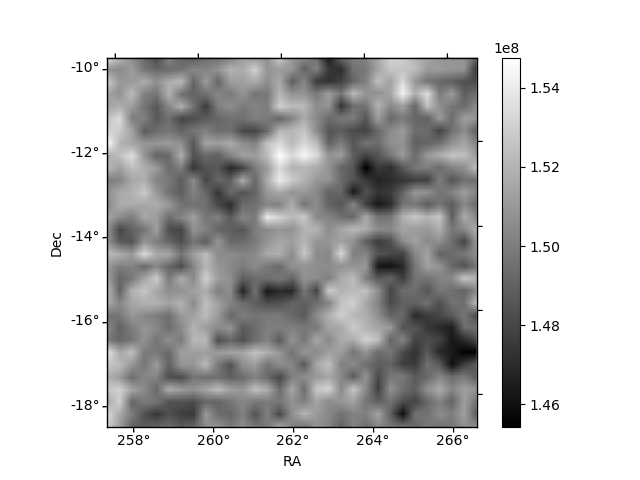
Histogram calculated using DETX and DETY for each event in the final _common_clean file
| Quadrant A | 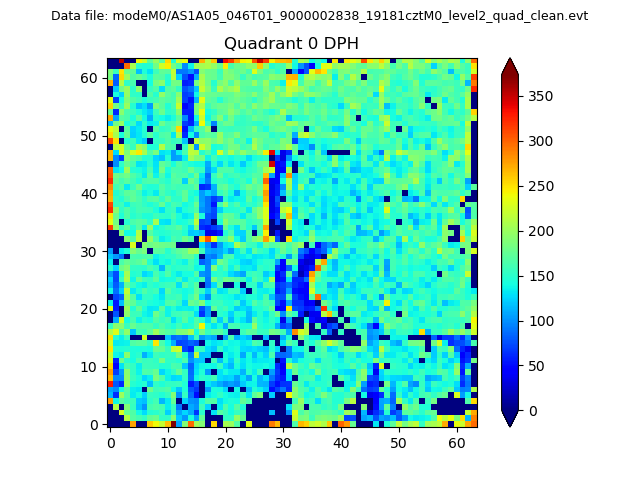 |
 |
Quadrant B |
|---|---|---|---|
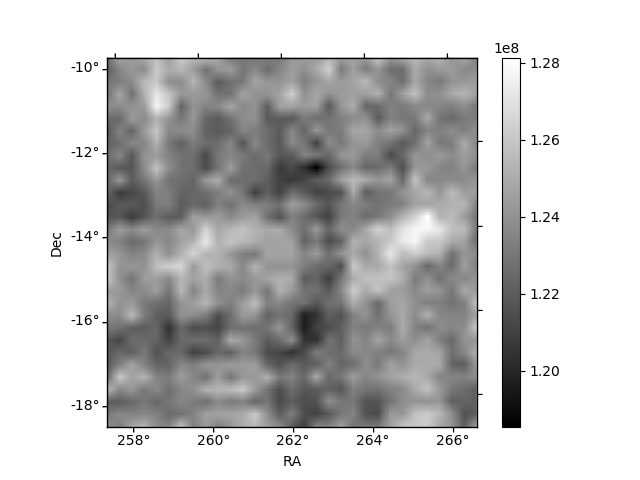
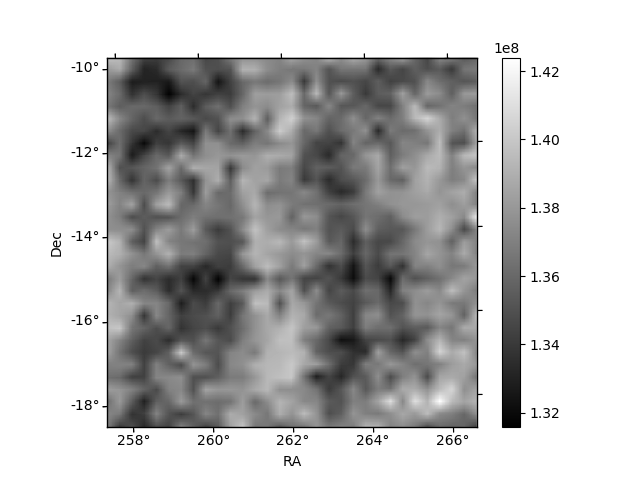
| Quadrant D | 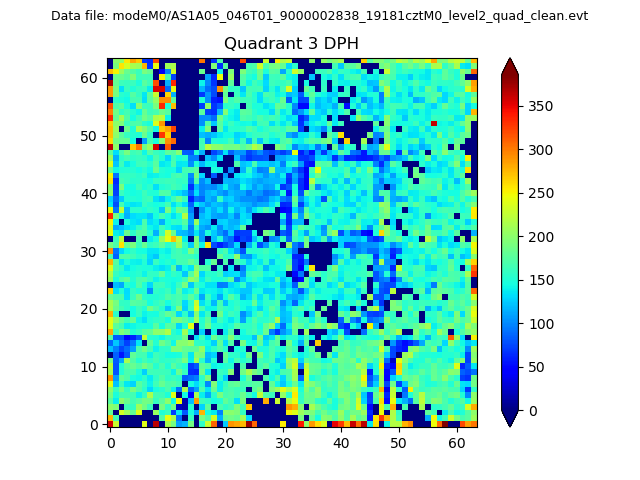 |
 |
Quadrant C |
| Plot type | Count rate plots | Images |
|---|---|---|
| Comparison with Poisson distribution Blue bars denote a histogram of data divided into 1 sec bins. Red curve is a Poisson curve with rate = median count rate of data. |
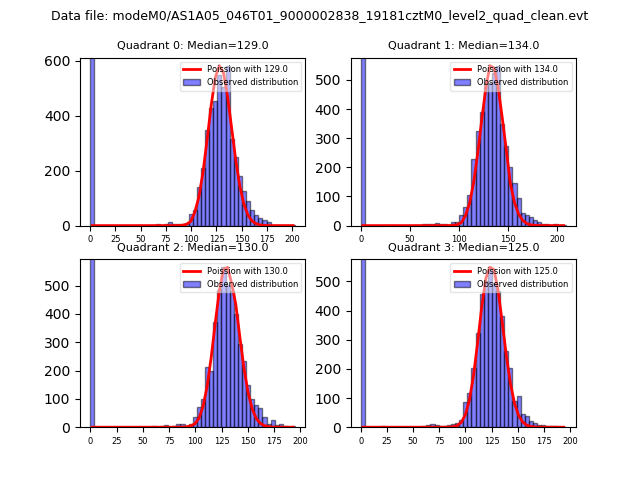 |
 |
| Quadrant-wise count rates Data is divided into 100 sec bins |
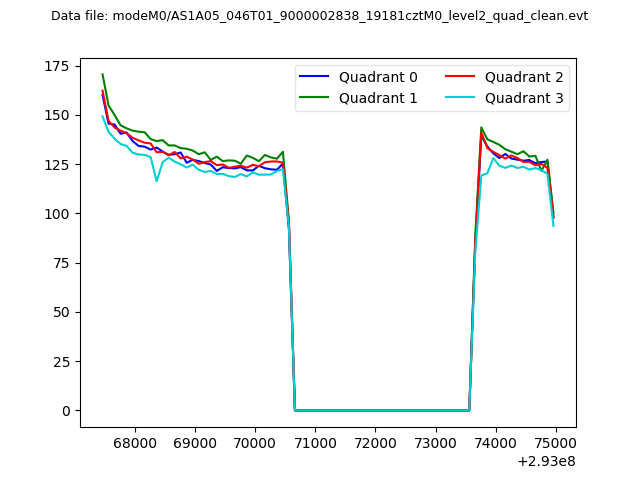 |
|
| Module-wise count rates for Quadrant A Data is divided into 100 sec bins |
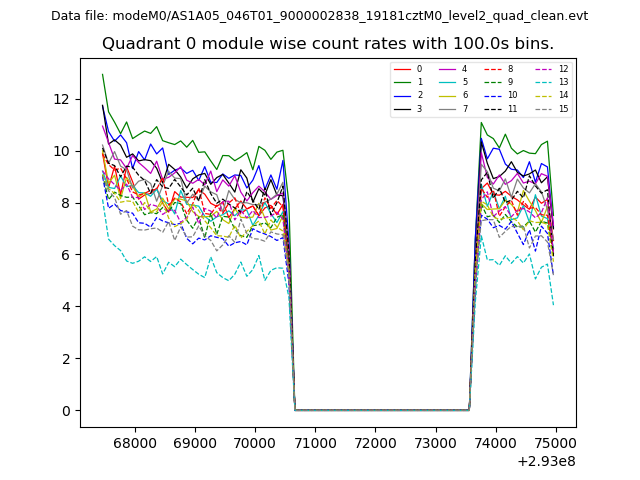 |
 |
| Module-wise count rates for Quadrant B Data is divided into 100 sec bins |
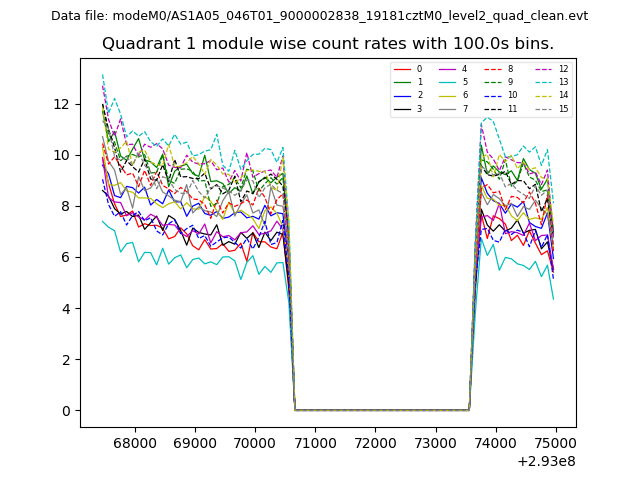 |
 |
| Module-wise count rates for Quadrant C Data is divided into 100 sec bins |
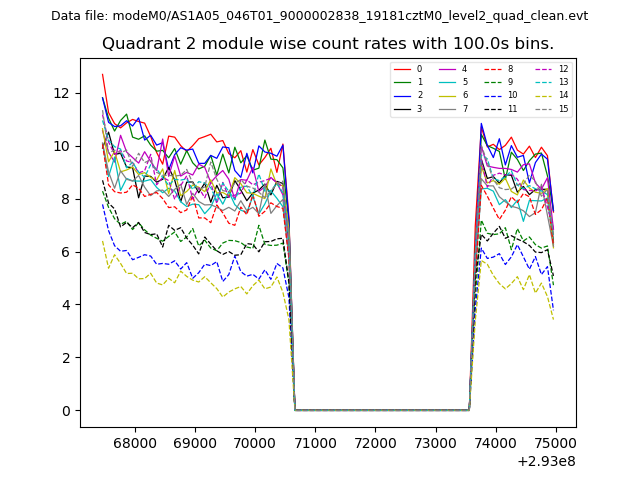 |
 |
| Module-wise count rates for Quadrant D Data is divided into 100 sec bins |
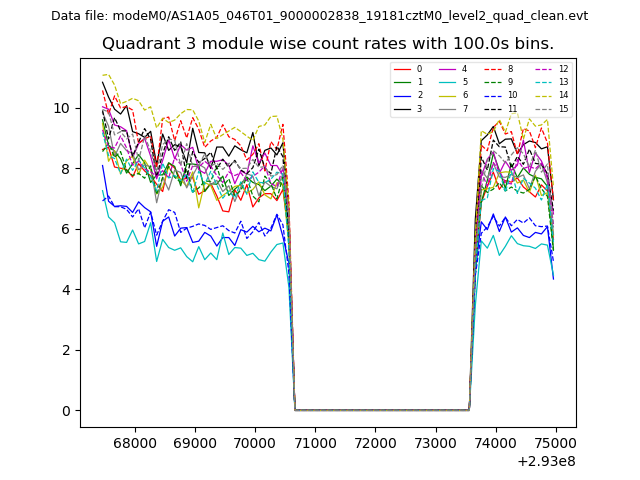 |
 |
| Parameter | Plot |
|---|---|
| CZT HV Monitor | 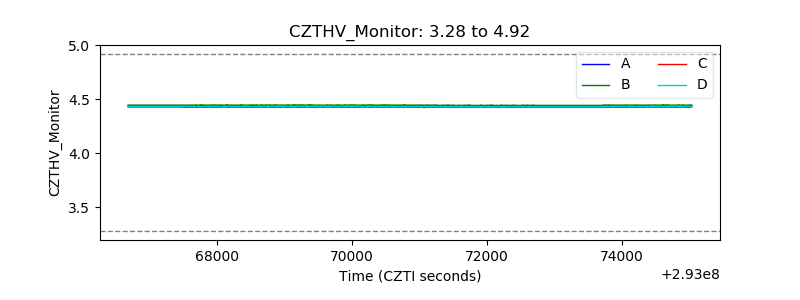 |
| D_VDD | 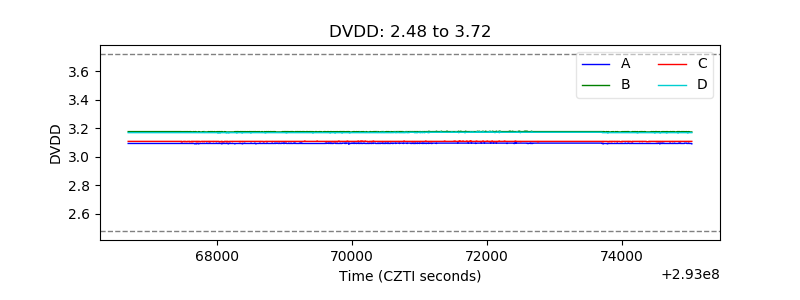 |
| Temperature 1 | 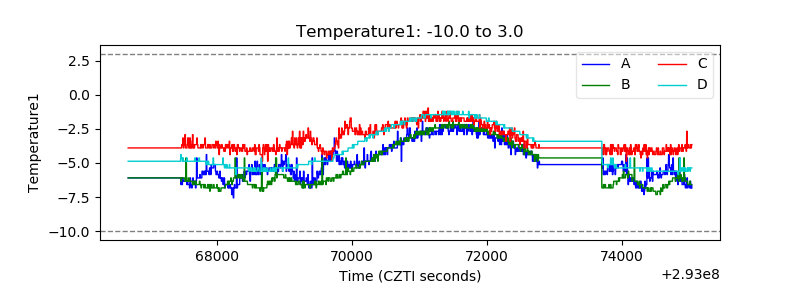 |
| Veto HV Monitor | 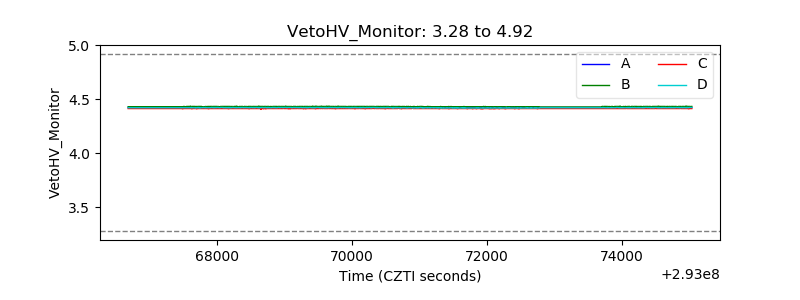 |
| Veto LLD | 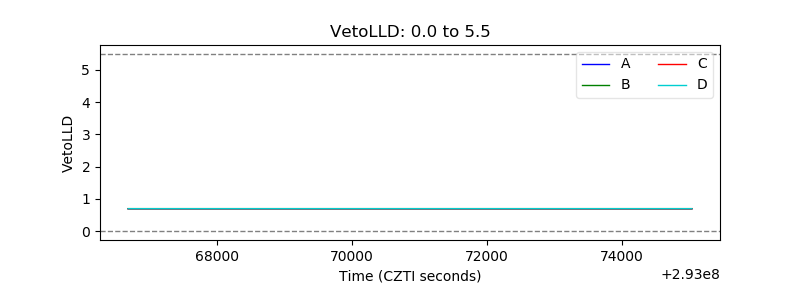 |
| Alpha Counter | 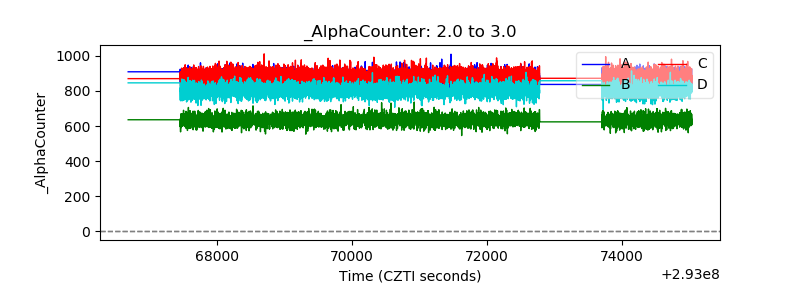 |
| _CPM_Rate | 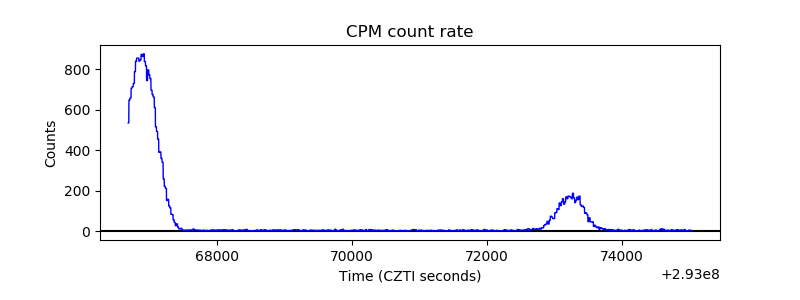 |
| CZT Counter | 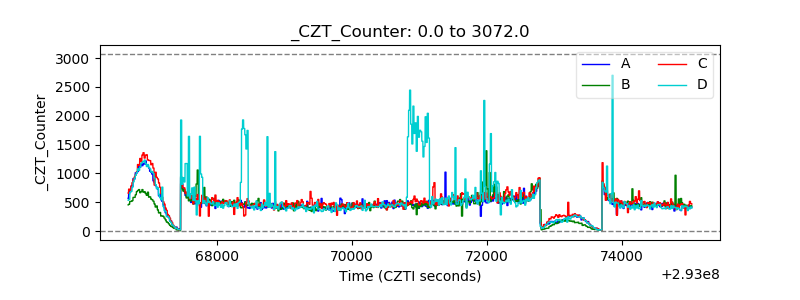 |
| +2.5 Volts monitor |  |
| +5 Volts monitor |  |
| _ROLL_ROT | 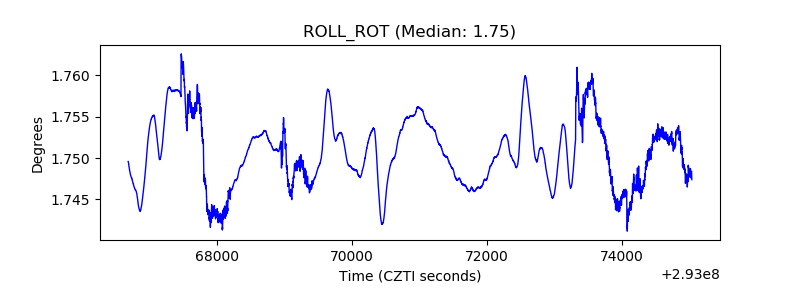 |
| _Roll_DEC |  |
| _Roll_RA |  |
| Veto Counter | 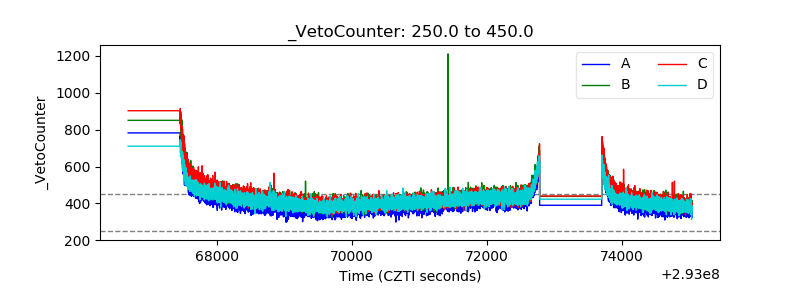 |