| Param | Original file | Final file |
|---|---|---|
| Filename | modeM0/AS1A05_046T01_9000002838_19187cztM0_level2.evt | modeM0/AS1A05_046T01_9000002838_19187cztM0_level2_quad_clean.evt |
| Size (bytes) | 2,541,810,240 | 420,768,000 |
| Size | 2.4 GB | 401.3 MB |
| Events in quadrant A | 16,596,434 | 2,585,133 |
| Events in quadrant B | 17,757,475 | 2,659,031 |
| Events in quadrant C | 19,355,020 | 2,567,266 |
| Events in quadrant D | 20,877,152 | 2,497,317 |
| Mode M0 | |||
|---|---|---|---|
| Quadrant | BADHDUFLAG | Total packets | Discarded packets |
| A | 0 | 72762 | 6 |
| B | 0 | 75142 | 6 |
| C | 0 | 78716 | 6 |
| D | 0 | 86011 | 6 |
| Mode SS | |||
|---|---|---|---|
| Quadrant | BADHDUFLAG | Total packets | Discarded packets |
| A | 0 | 722 | 0 |
| B | 0 | 722 | 0 |
| C | 0 | 722 | 0 |
| D | 0 | 722 | 0 |
| Mode M9 | |||
|---|---|---|---|
| Quadrant | BADHDUFLAG | Total packets | Discarded packets |
| A | 0 | 29 | 0 |
| B | 0 | 29 | 0 |
| C | 0 | 29 | 0 |
| D | 0 | 29 | 0 |
| Quadrant | Total seconds | Saturated seconds | Saturation percentage |
|---|---|---|---|
| A | 35450 | 489 | 1.379408% |
| B | 35451 | 649 | 1.830696% |
| C | 35451 | 822 | 2.318693% |
| D | 35451 | 1478 | 4.169135% |
Noise dominated data is calculated using 1-second bins in cleaned event files. If a bin has >2000 counts, and if more than 50% of those come from <1% of pixels, then it is considered to be noise-dominated and hence unusable.
| Quadrant | # 1 sec bins | Bins with >0 counts | Bins with >2000 counts | High rate bins dominated by noise | Noise dominated (total time) | Noise dominated (detector-on time) | Marked lightcurve |
|---|---|---|---|---|---|---|---|
| A | 38285 | 35457 | 0 | 0 | 0.00% | 0.00% | 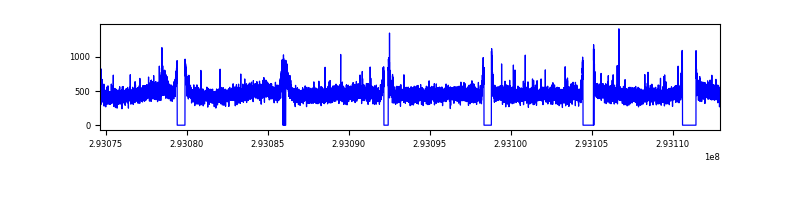 |
| B | 38286 | 35459 | 51 | 51 | 0.13% | 0.14% | 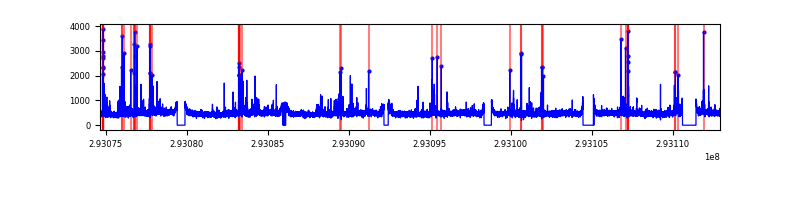 |
| C | 38286 | 35458 | 59 | 59 | 0.15% | 0.17% | 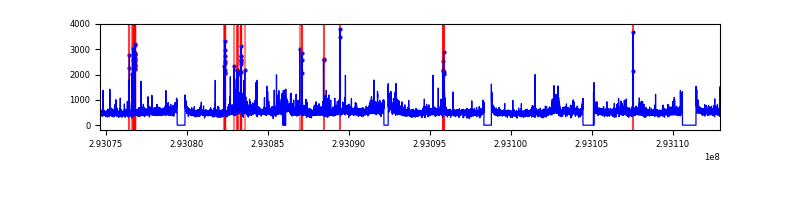 |
| D | 38286 | 35460 | 816 | 816 | 2.13% | 2.30% | 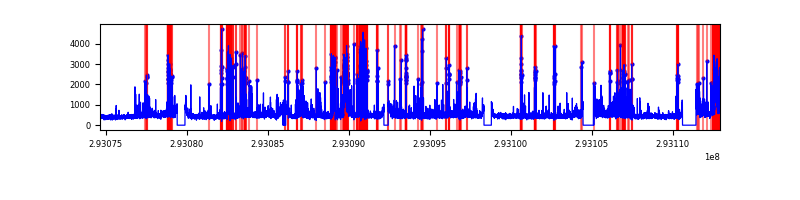 |
Top three noisy pixels from each quadrant. If the there are fewer than three noisy pixels in the level2.evt file, extra rows are filled as -1
| Pixel properties | Quadrant properties | ||||||
|---|---|---|---|---|---|---|---|
| Quadrant | DetID | PixID | Counts | Sigma | Mean | Median | Sigma |
| A | 11 | 29 | 66761 | 72.62 | 4276 | 4181 | 861.8 |
| A | 8 | 144 | 55100 | 59.09 | 4276 | 4181 | 861.8 |
| A | 13 | 254 | 43584 | 45.72 | 4276 | 4181 | 861.8 |
| B | 7 | 220 | 326705 | 396.27 | 4274 | 4159 | 814.0 |
| B | 3 | 112 | 202543 | 243.73 | 4274 | 4159 | 814.0 |
| B | 0 | 189 | 175729 | 210.79 | 4274 | 4159 | 814.0 |
| C | 3 | 233 | 2450388 | 2517.7 | 4132 | 4160 | 971.6 |
| C | 14 | 238 | 631870 | 646.05 | 4132 | 4160 | 971.6 |
| C | 0 | 207 | 161249 | 161.68 | 4132 | 4160 | 971.6 |
| D | 1 | 52 | 2244043 | 2221.69 | 4156 | 4036 | 1008.2 |
| D | 10 | 66 | 1279692 | 1265.23 | 4156 | 4036 | 1008.2 |
| D | 11 | 176 | 1016319 | 1004.01 | 4156 | 4036 | 1008.2 |
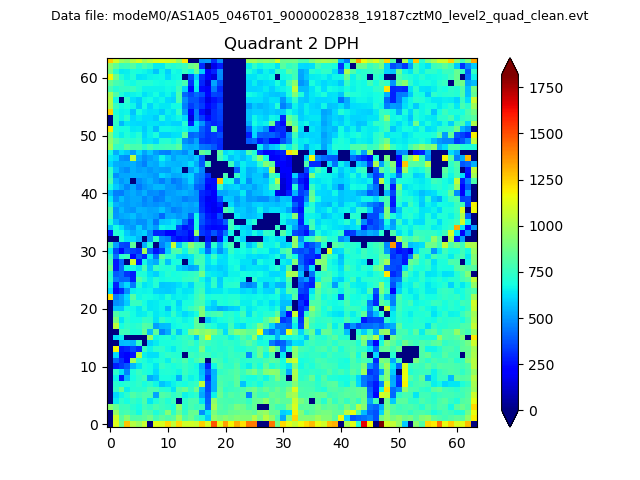
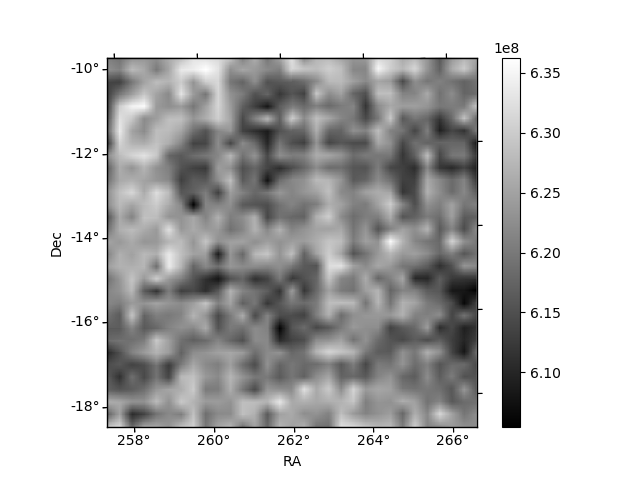
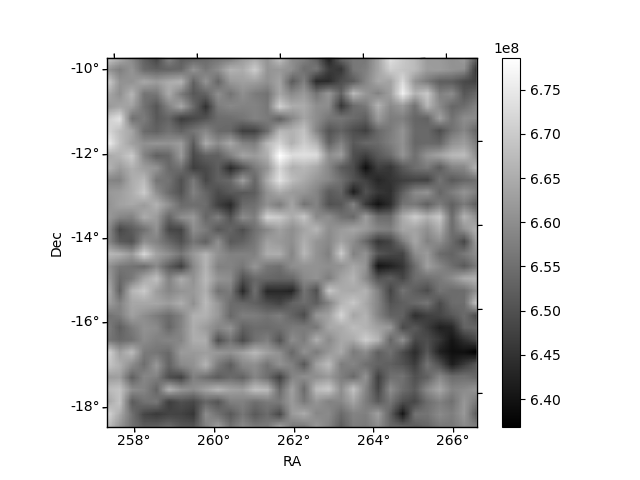
Histogram calculated using DETX and DETY for each event in the final _common_clean file
| Quadrant A | 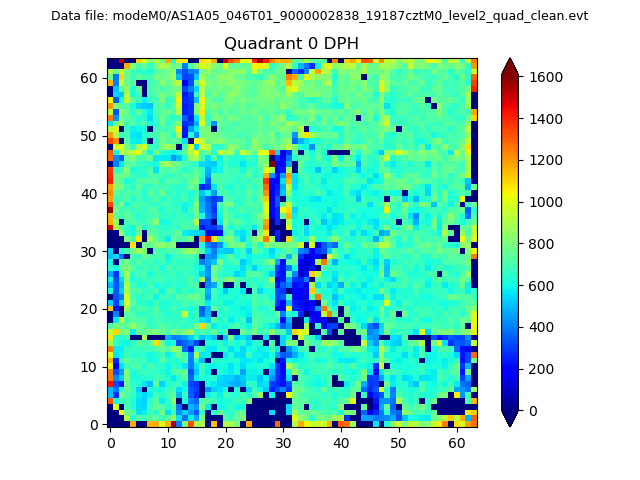 |
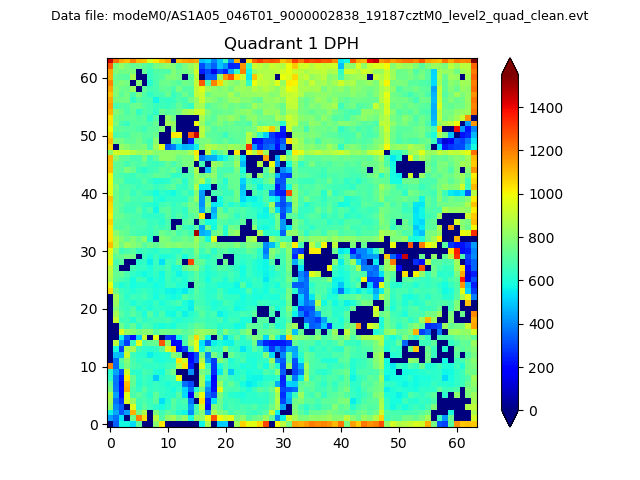 |
Quadrant B |
|---|---|---|---|
| Quadrant D | 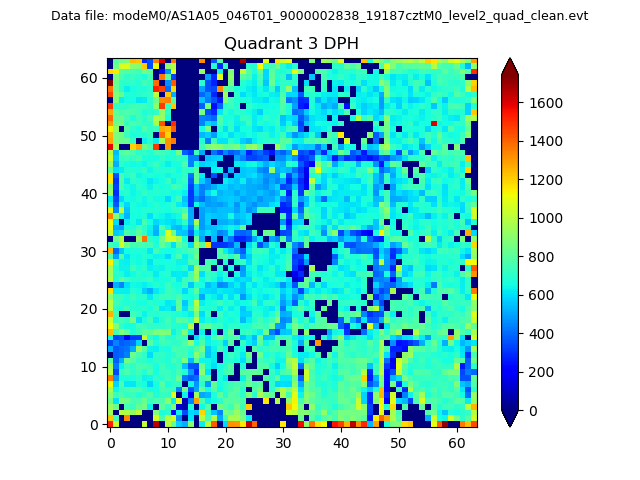 |
 |
Quadrant C |
| Plot type | Count rate plots | Images |
|---|---|---|
| Comparison with Poisson distribution Blue bars denote a histogram of data divided into 1 sec bins. Red curve is a Poisson curve with rate = median count rate of data. |
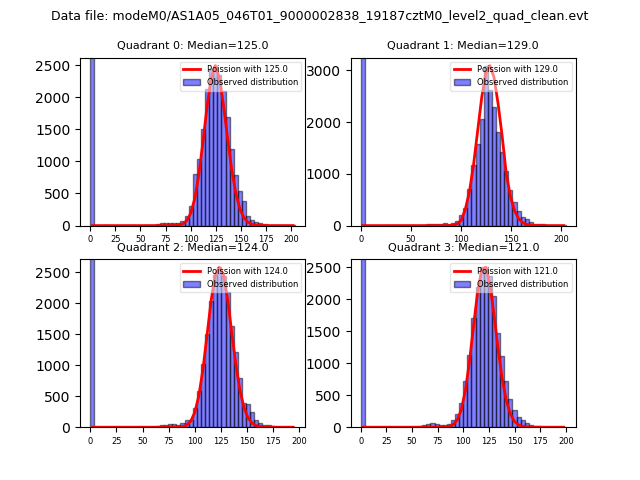 |
 |
| Quadrant-wise count rates Data is divided into 100 sec bins |
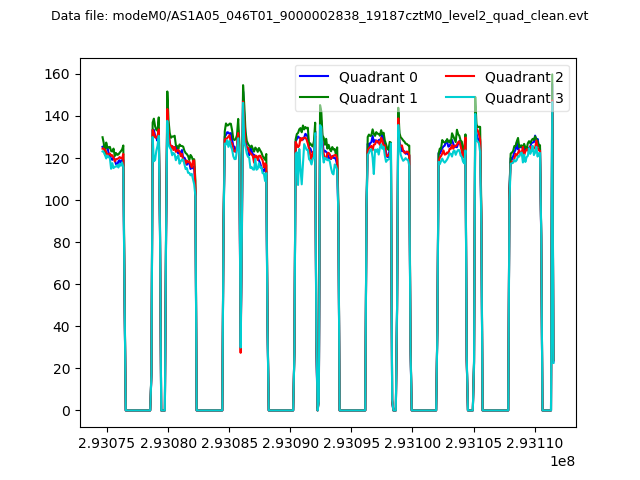 |
|
| Module-wise count rates for Quadrant A Data is divided into 100 sec bins |
 |
 |
| Module-wise count rates for Quadrant B Data is divided into 100 sec bins |
 |
 |
| Module-wise count rates for Quadrant C Data is divided into 100 sec bins |
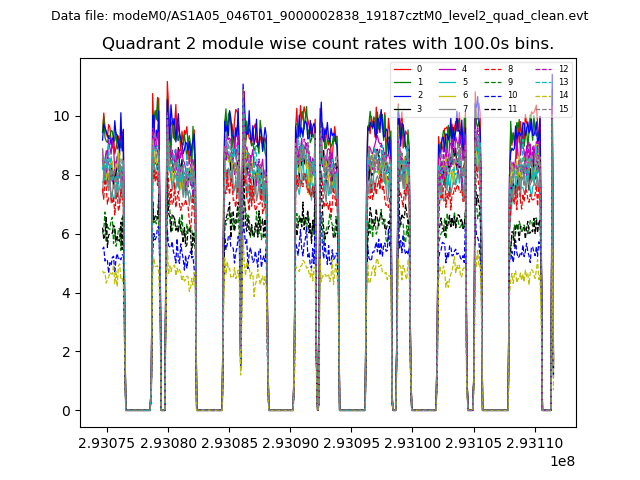 |
 |
| Module-wise count rates for Quadrant D Data is divided into 100 sec bins |
 |
 |
| Parameter | Plot |
|---|---|
| CZT HV Monitor | 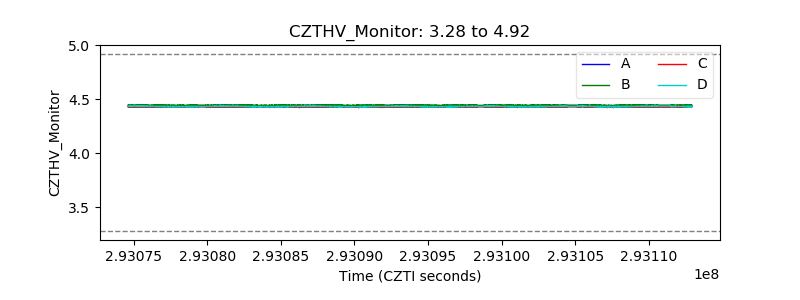 |
| D_VDD | 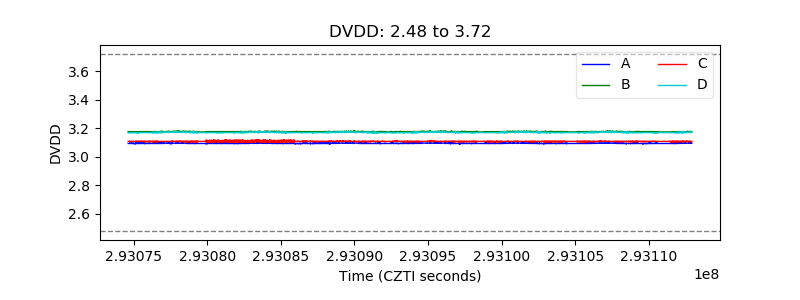 |
| Temperature 1 | 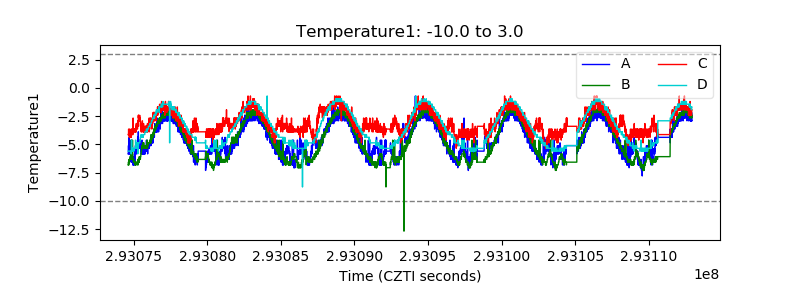 |
| Veto HV Monitor |  |
| Veto LLD | 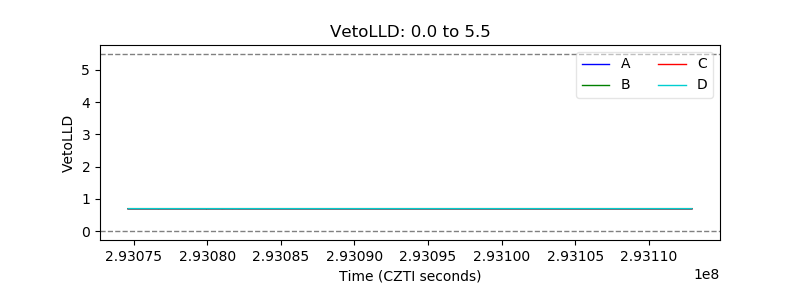 |
| Alpha Counter | 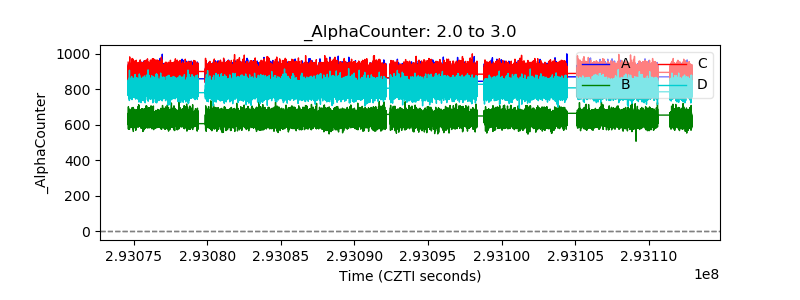 |
| _CPM_Rate | 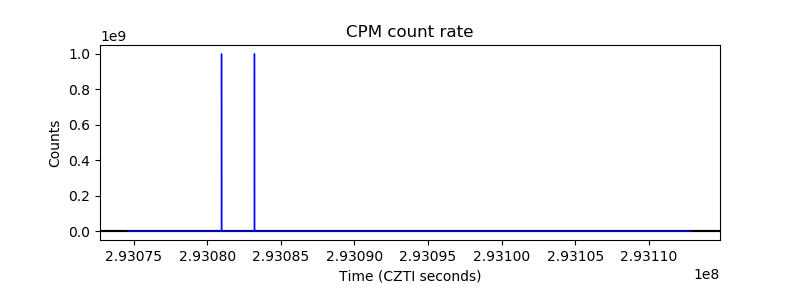 |
| CZT Counter | 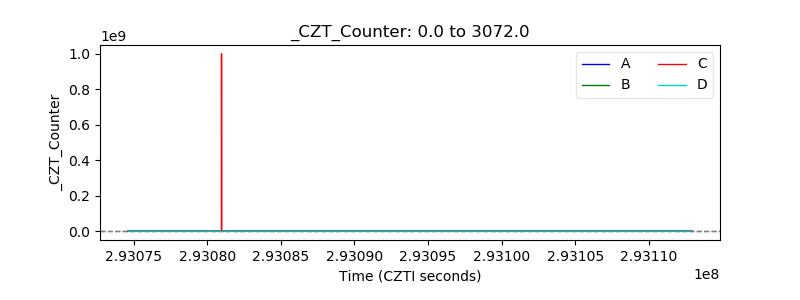 |
| +2.5 Volts monitor | 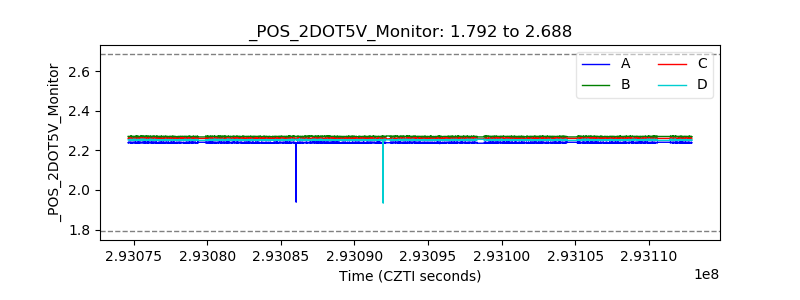 |
| +5 Volts monitor |  |
| _ROLL_ROT | 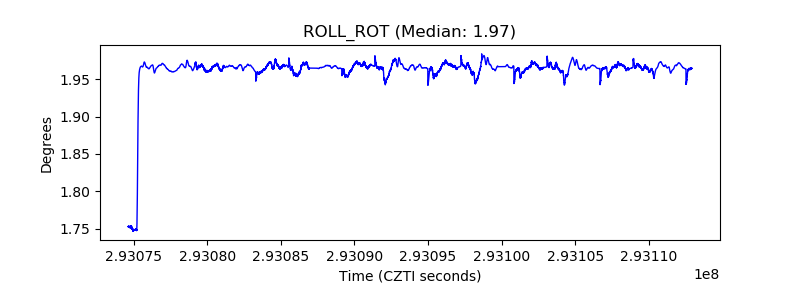 |
| _Roll_DEC | 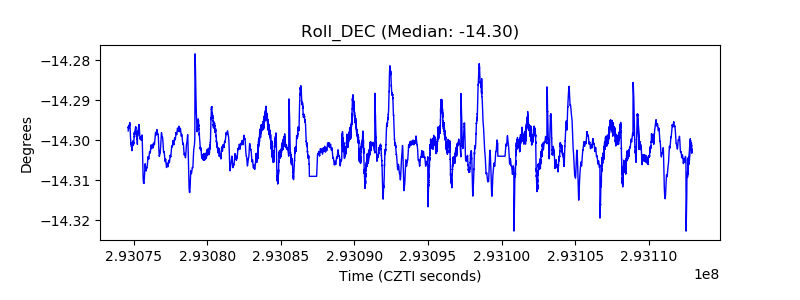 |
| _Roll_RA |  |
| Veto Counter | 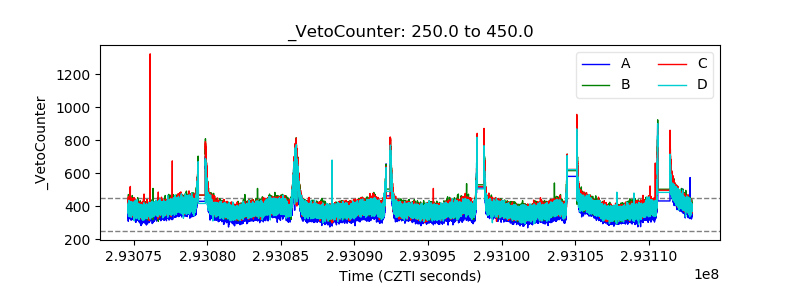 |