| Param | Original file | Final file |
|---|---|---|
| Filename | modeM0/AS1A05_046T01_9000002838_19188cztM0_level2.evt | modeM0/AS1A05_046T01_9000002838_19188cztM0_level2_quad_clean.evt |
| Size (bytes) | 608,264,640 | 65,119,680 |
| Size | 580.1 MB | 62.1 MB |
| Events in quadrant A | 3,268,889 | 380,791 |
| Events in quadrant B | 3,405,065 | 388,053 |
| Events in quadrant C | 3,557,747 | 376,130 |
| Events in quadrant D | 7,735,959 | 359,566 |
| Mode M0 | |||
|---|---|---|---|
| Quadrant | BADHDUFLAG | Total packets | Discarded packets |
| A | 0 | 13940 | 2 |
| B | 0 | 14335 | 2 |
| C | 0 | 14580 | 2 |
| D | 0 | 27669 | 2 |
| Mode SS | |||
|---|---|---|---|
| Quadrant | BADHDUFLAG | Total packets | Discarded packets |
| A | 0 | 136 | 0 |
| B | 0 | 136 | 0 |
| C | 0 | 136 | 0 |
| D | 0 | 136 | 0 |
| Mode M9 | |||
|---|---|---|---|
| Quadrant | BADHDUFLAG | Total packets | Discarded packets |
| A | 0 | 10 | 0 |
| B | 0 | 10 | 0 |
| C | 0 | 10 | 0 |
| D | 0 | 10 | 0 |
| Quadrant | Total seconds | Saturated seconds | Saturation percentage |
|---|---|---|---|
| A | 6698 | 74 | 1.104807% |
| B | 6699 | 86 | 1.283774% |
| C | 6699 | 99 | 1.477833% |
| D | 6699 | 1285 | 19.181967% |
Noise dominated data is calculated using 1-second bins in cleaned event files. If a bin has >2000 counts, and if more than 50% of those come from <1% of pixels, then it is considered to be noise-dominated and hence unusable.
| Quadrant | # 1 sec bins | Bins with >0 counts | Bins with >2000 counts | High rate bins dominated by noise | Noise dominated (total time) | Noise dominated (detector-on time) | Marked lightcurve |
|---|---|---|---|---|---|---|---|
| A | 7673 | 6698 | 0 | 0 | 0.00% | 0.00% | 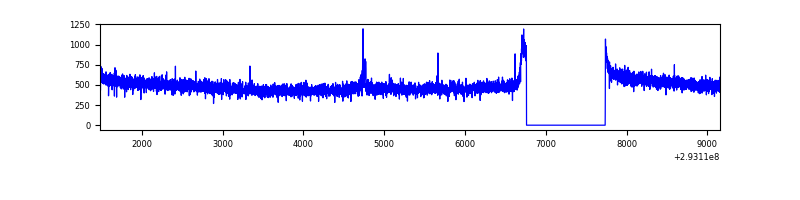 |
| B | 7674 | 6699 | 7 | 7 | 0.09% | 0.10% | 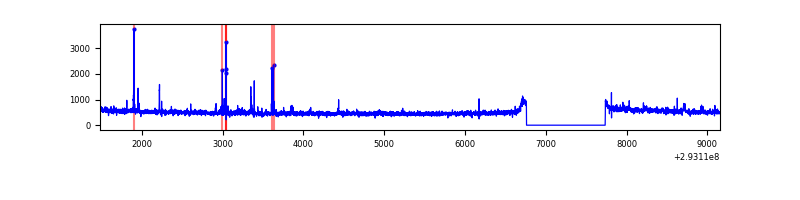 |
| C | 7674 | 6699 | 0 | 0 | 0.00% | 0.00% | 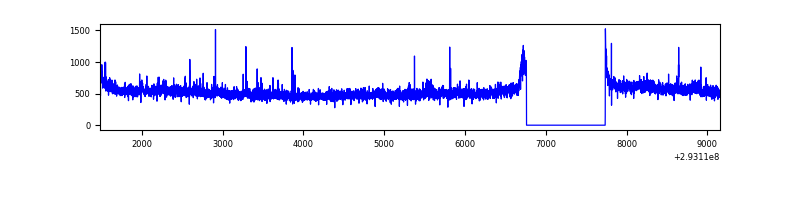 |
| D | 7674 | 6699 | 759 | 759 | 9.89% | 11.33% | 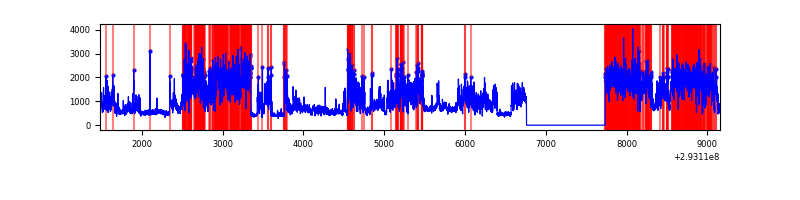 |
Top three noisy pixels from each quadrant. If the there are fewer than three noisy pixels in the level2.evt file, extra rows are filled as -1
| Pixel properties | Quadrant properties | ||||||
|---|---|---|---|---|---|---|---|
| Quadrant | DetID | PixID | Counts | Sigma | Mean | Median | Sigma |
| A | 8 | 205 | 38675 | 223.69 | 839 | 821 | 169.2 |
| A | 13 | 254 | 7357 | 38.62 | 839 | 821 | 169.2 |
| A | 0 | 226 | 7151 | 37.4 | 839 | 821 | 169.2 |
| B | 0 | 189 | 28265 | 171.26 | 836 | 817 | 160.3 |
| B | 7 | 220 | 26188 | 158.3 | 836 | 817 | 160.3 |
| B | 12 | 111 | 19114 | 114.16 | 836 | 817 | 160.3 |
| C | 3 | 233 | 287523 | 1515.24 | 807 | 814 | 189.2 |
| C | 14 | 238 | 123972 | 650.88 | 807 | 814 | 189.2 |
| C | 13 | 61 | 5435 | 24.42 | 807 | 814 | 189.2 |
| D | 10 | 66 | 4646043 | 24426.42 | 781 | 759 | 190.2 |
| D | 11 | 176 | 80802 | 420.89 | 781 | 759 | 190.2 |
| D | 1 | 52 | 55170 | 286.11 | 781 | 759 | 190.2 |
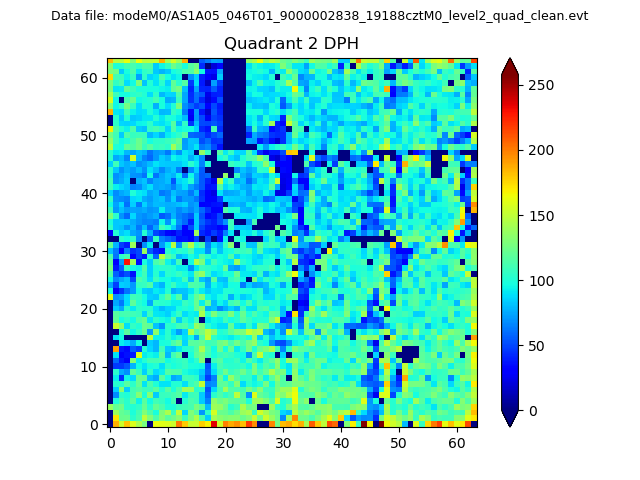
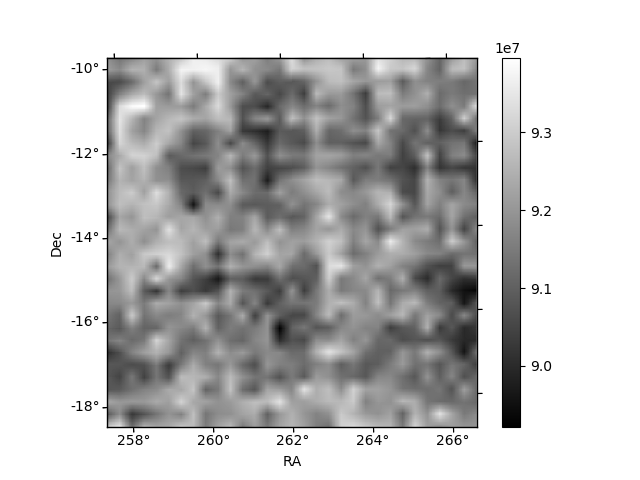
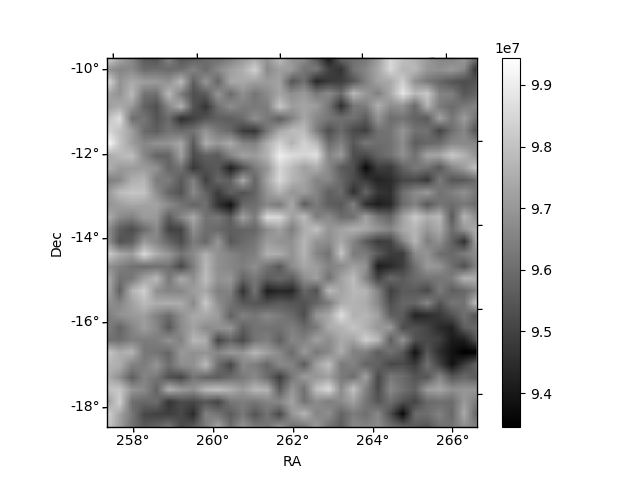
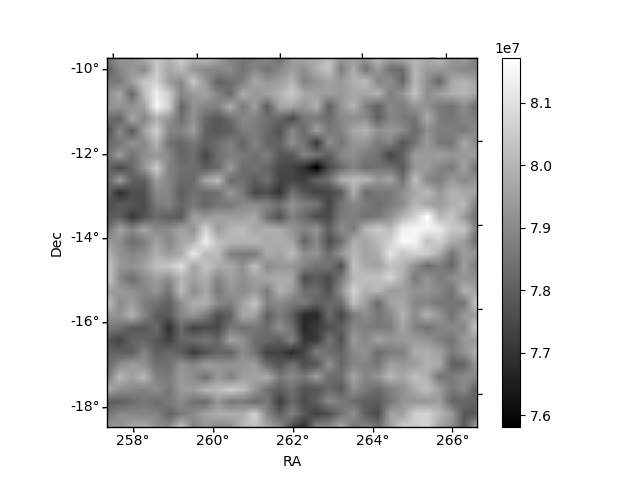
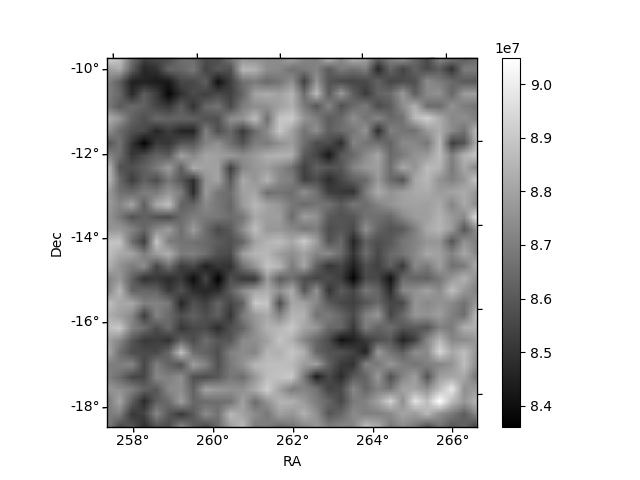
Histogram calculated using DETX and DETY for each event in the final _common_clean file
| Quadrant A | 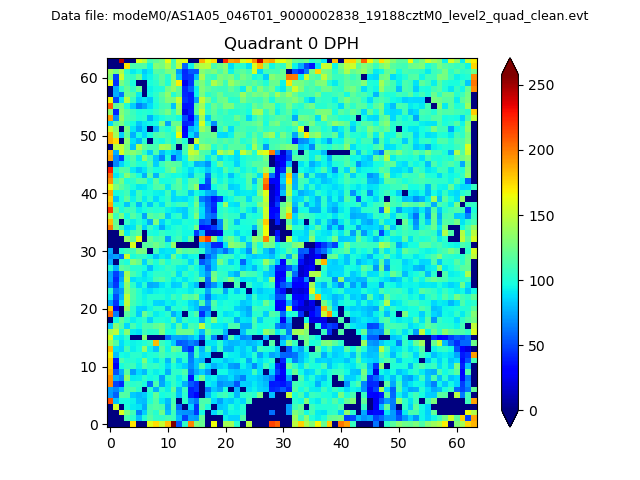 |
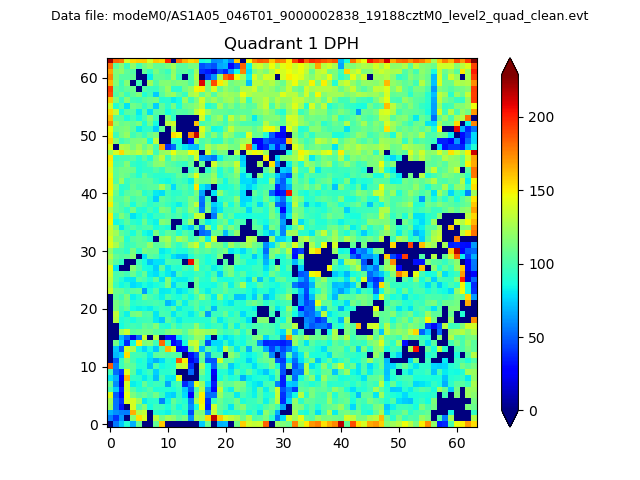 |
Quadrant B |
|---|---|---|---|
| Quadrant D | 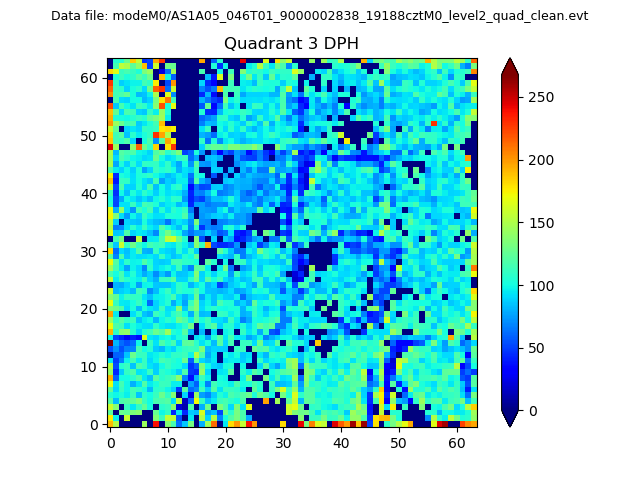 |
 |
Quadrant C |
| Plot type | Count rate plots | Images |
|---|---|---|
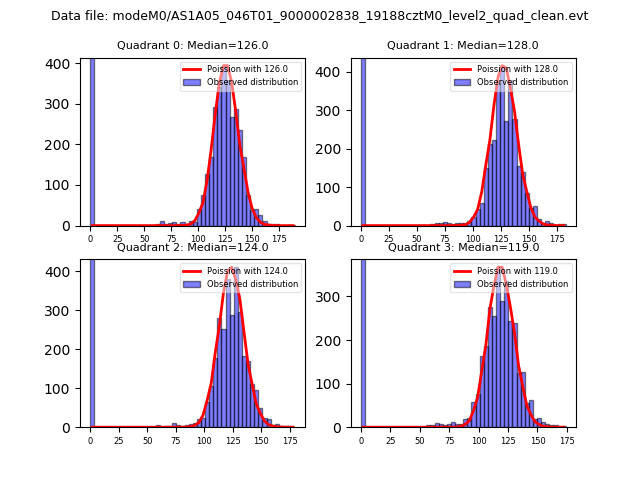
| Comparison with Poisson distribution Blue bars denote a histogram of data divided into 1 sec bins. Red curve is a Poisson curve with rate = median count rate of data. |
 |
 |
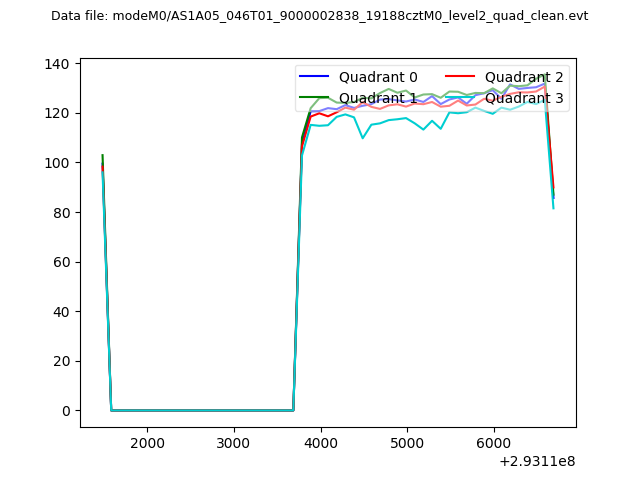
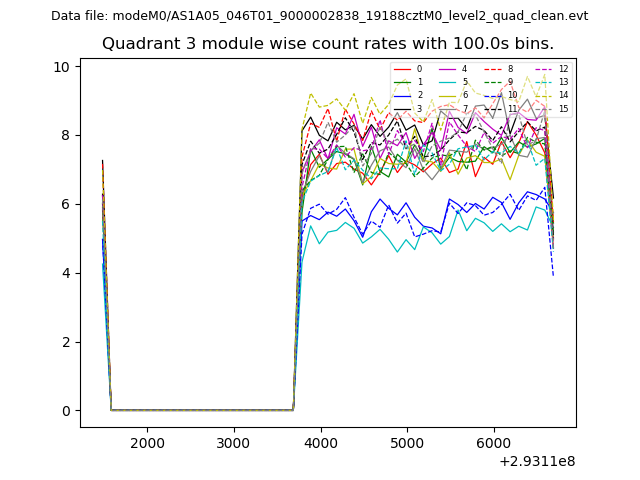
| Quadrant-wise count rates Data is divided into 100 sec bins |
 |
|
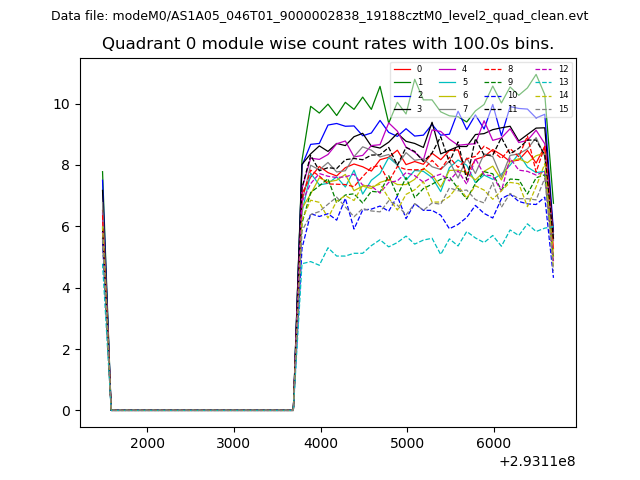
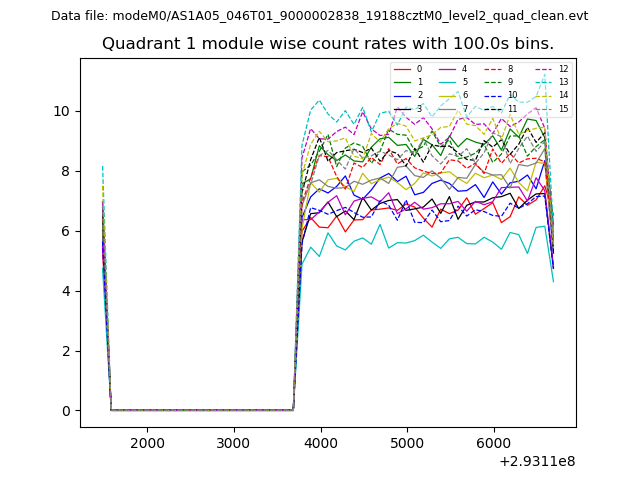
| Module-wise count rates for Quadrant A Data is divided into 100 sec bins |
 |
 |
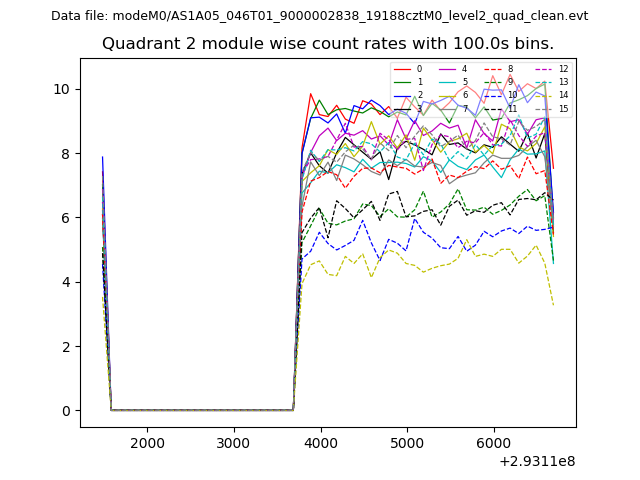
| Module-wise count rates for Quadrant B Data is divided into 100 sec bins |
 |
 |
| Module-wise count rates for Quadrant C Data is divided into 100 sec bins |
 |
 |
| Module-wise count rates for Quadrant D Data is divided into 100 sec bins |
 |
 |
| Parameter | Plot |
|---|---|
| CZT HV Monitor | 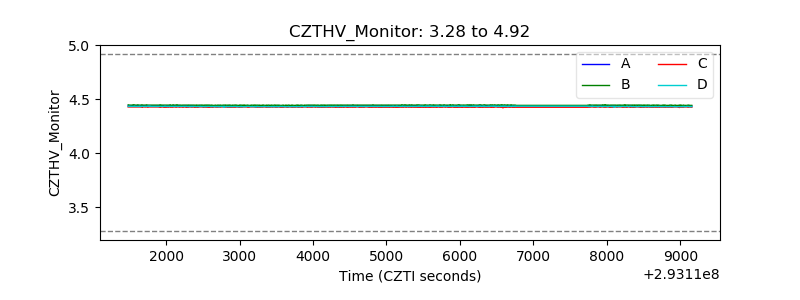 |
| D_VDD | 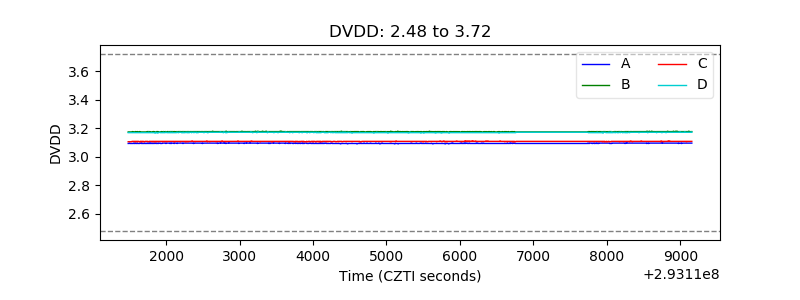 |
| Temperature 1 | 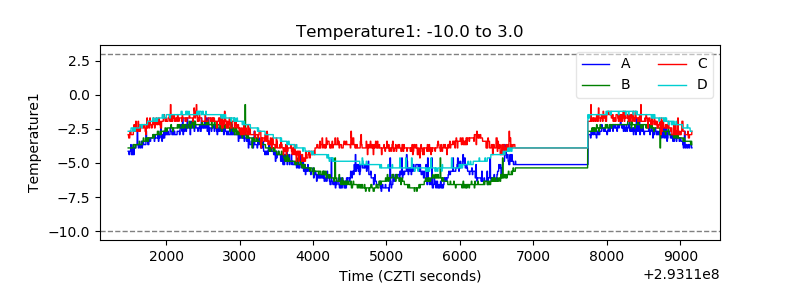 |
| Veto HV Monitor | 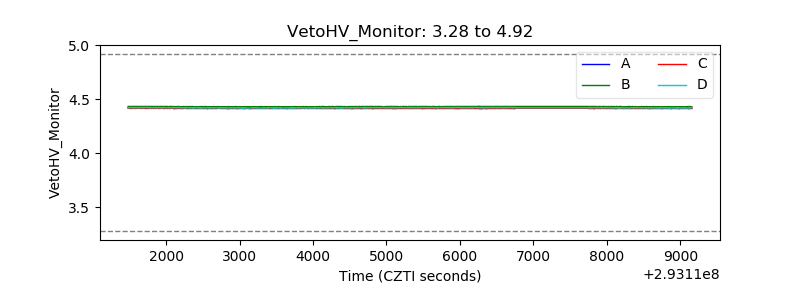 |
| Veto LLD | 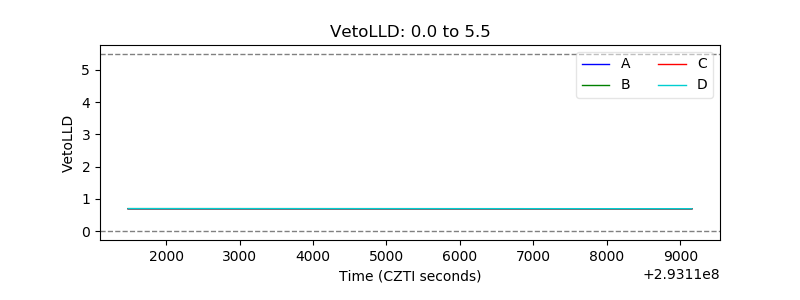 |
| Alpha Counter | 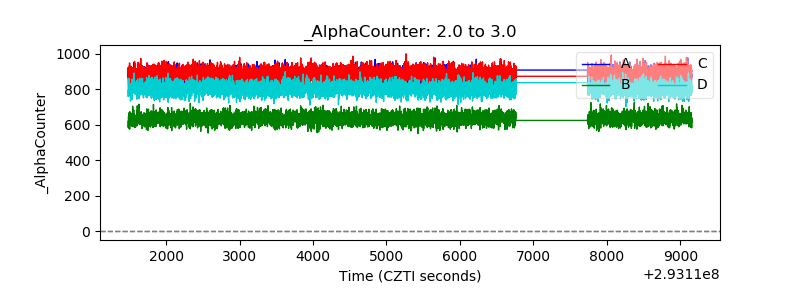 |
| _CPM_Rate | 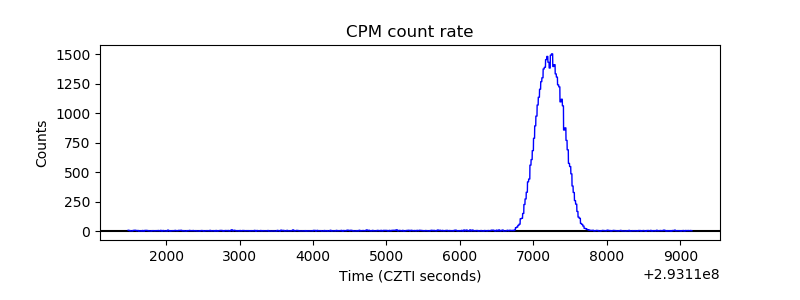 |
| CZT Counter | 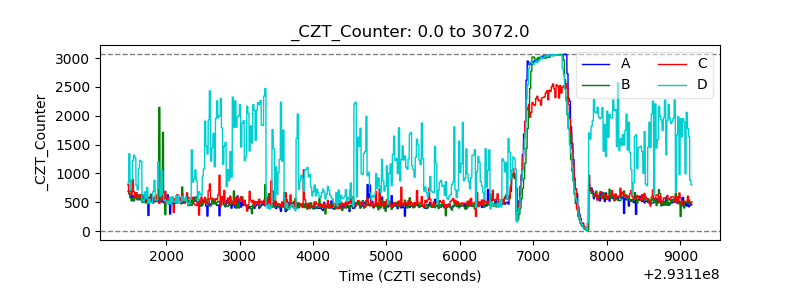 |
| +2.5 Volts monitor |  |
| +5 Volts monitor |  |
| _ROLL_ROT | 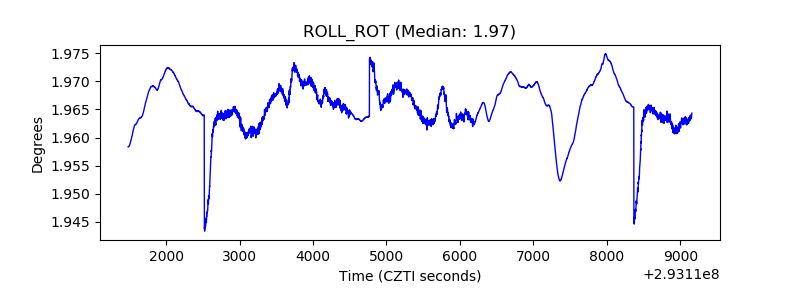 |
| _Roll_DEC | 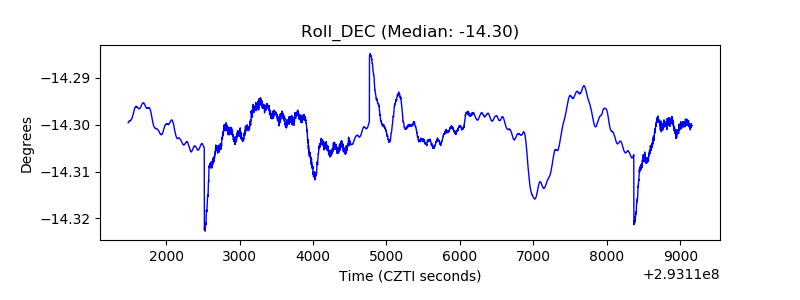 |
| _Roll_RA | 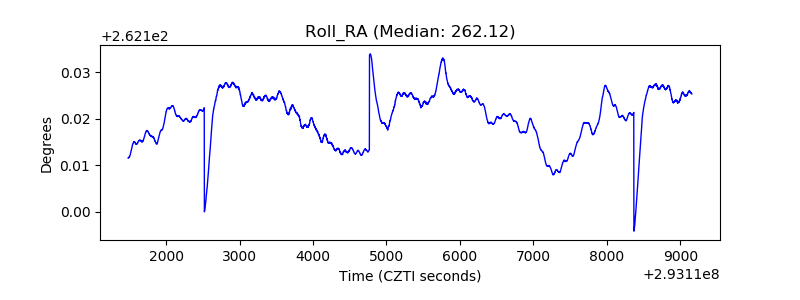 |
| Veto Counter | 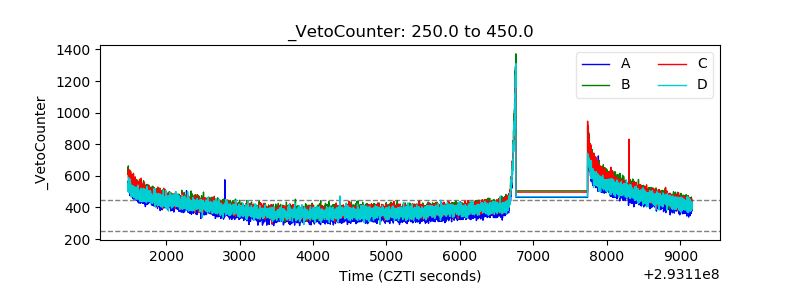 |