| Param | Original file | Final file |
|---|---|---|
| Filename | modeM0/AS1A05_046T01_9000002838_19191cztM0_level2.evt | modeM0/AS1A05_046T01_9000002838_19191cztM0_level2_quad_clean.evt |
| Size (bytes) | 553,432,320 | 80,588,160 |
| Size | 527.8 MB | 76.9 MB |
| Events in quadrant A | 3,249,509 | 507,890 |
| Events in quadrant B | 3,497,567 | 517,629 |
| Events in quadrant C | 3,845,198 | 499,329 |
| Events in quadrant D | 5,743,590 | 477,516 |
| Mode M0 | |||
|---|---|---|---|
| Quadrant | BADHDUFLAG | Total packets | Discarded packets |
| A | 0 | 13771 | 2 |
| B | 0 | 14595 | 2 |
| C | 0 | 15420 | 2 |
| D | 0 | 21431 | 2 |
| Mode SS | |||
|---|---|---|---|
| Quadrant | BADHDUFLAG | Total packets | Discarded packets |
| A | 0 | 128 | 0 |
| B | 0 | 128 | 0 |
| C | 0 | 128 | 0 |
| D | 0 | 128 | 0 |
| Mode M9 | |||
|---|---|---|---|
| Quadrant | BADHDUFLAG | Total packets | Discarded packets |
| A | 0 | 15 | 0 |
| B | 0 | 16 | 0 |
| C | 0 | 16 | 0 |
| D | 0 | 16 | 0 |
| Quadrant | Total seconds | Saturated seconds | Saturation percentage |
|---|---|---|---|
| A | 6271 | 76 | 1.211928% |
| B | 6271 | 93 | 1.483017% |
| C | 6271 | 167 | 2.663052% |
| D | 6271 | 638 | 10.173816% |
Noise dominated data is calculated using 1-second bins in cleaned event files. If a bin has >2000 counts, and if more than 50% of those come from <1% of pixels, then it is considered to be noise-dominated and hence unusable.
| Quadrant | # 1 sec bins | Bins with >0 counts | Bins with >2000 counts | High rate bins dominated by noise | Noise dominated (total time) | Noise dominated (detector-on time) | Marked lightcurve |
|---|---|---|---|---|---|---|---|
| A | 7481 | 6271 | 0 | 0 | 0.00% | 0.00% | 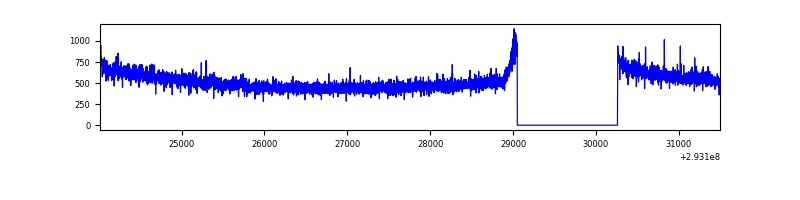 |
| B | 7481 | 6271 | 9 | 9 | 0.12% | 0.14% | 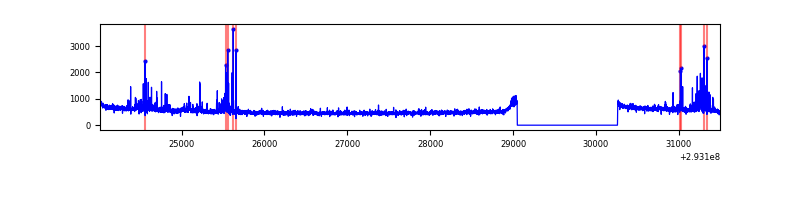 |
| C | 7481 | 6271 | 10 | 10 | 0.13% | 0.16% | 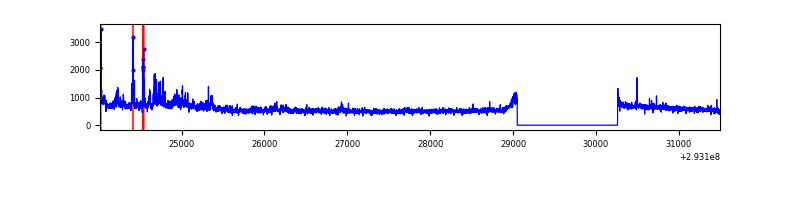 |
| D | 7481 | 6271 | 406 | 406 | 5.43% | 6.47% | 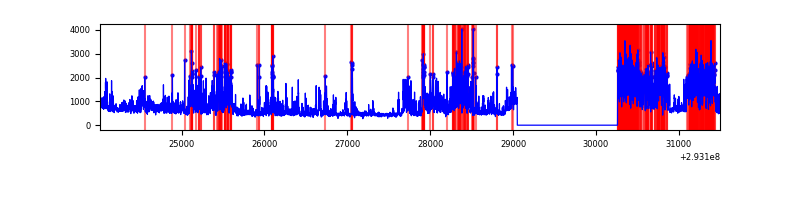 |
Top three noisy pixels from each quadrant. If the there are fewer than three noisy pixels in the level2.evt file, extra rows are filled as -1
| Pixel properties | Quadrant properties | ||||||
|---|---|---|---|---|---|---|---|
| Quadrant | DetID | PixID | Counts | Sigma | Mean | Median | Sigma |
| A | 13 | 254 | 8501 | 45.26 | 842 | 826 | 169.6 |
| A | 0 | 226 | 7300 | 38.18 | 842 | 826 | 169.6 |
| A | 3 | 137 | 6257 | 32.03 | 842 | 826 | 169.6 |
| B | 0 | 197 | 99451 | 616.11 | 844 | 826 | 160.1 |
| B | 7 | 220 | 44252 | 271.28 | 844 | 826 | 160.1 |
| B | 0 | 190 | 28334 | 171.84 | 844 | 826 | 160.1 |
| C | 3 | 233 | 520191 | 2753.3 | 811 | 819 | 188.6 |
| C | 14 | 238 | 126831 | 668.02 | 811 | 819 | 188.6 |
| C | 0 | 207 | 36867 | 191.1 | 811 | 819 | 188.6 |
| D | 10 | 66 | 2093626 | 10961.32 | 799 | 779 | 190.9 |
| D | 1 | 52 | 394773 | 2063.55 | 799 | 779 | 190.9 |
| D | 11 | 176 | 138426 | 720.93 | 799 | 779 | 190.9 |
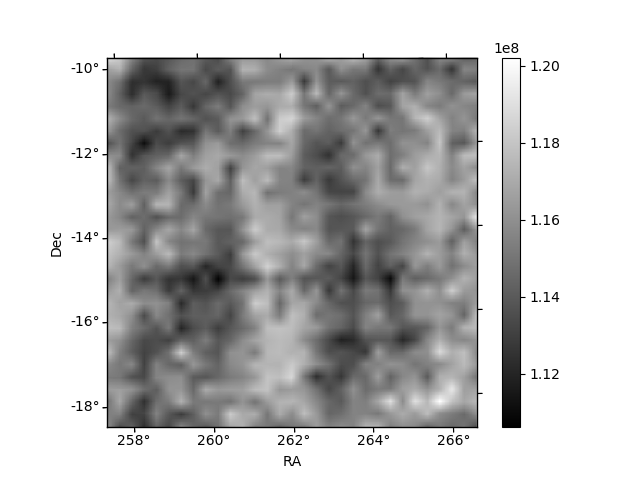
Histogram calculated using DETX and DETY for each event in the final _common_clean file
| Quadrant A | 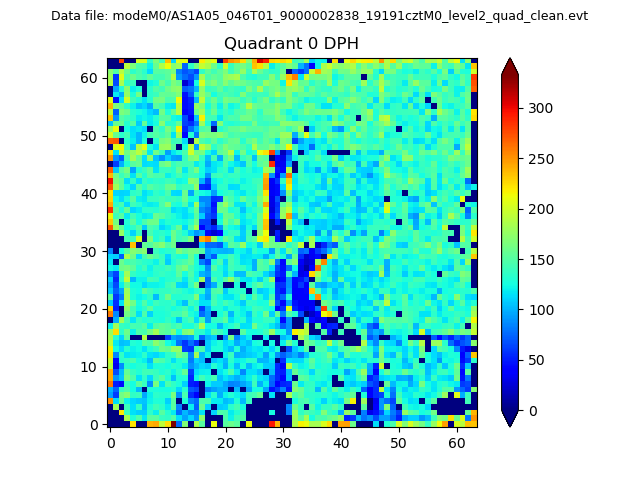 |
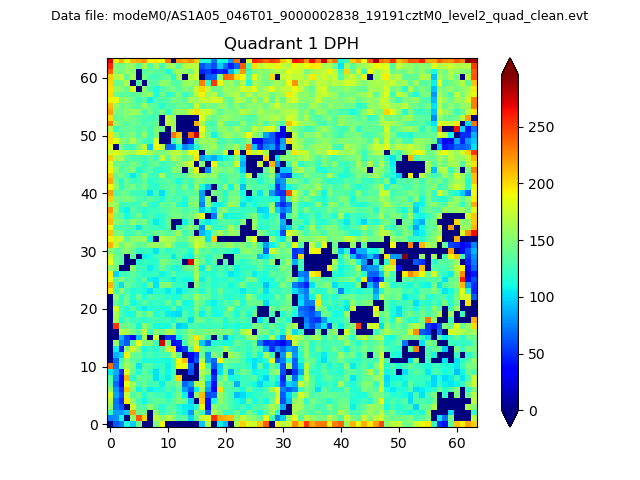 |
Quadrant B |
|---|---|---|---|
| Quadrant D |  |
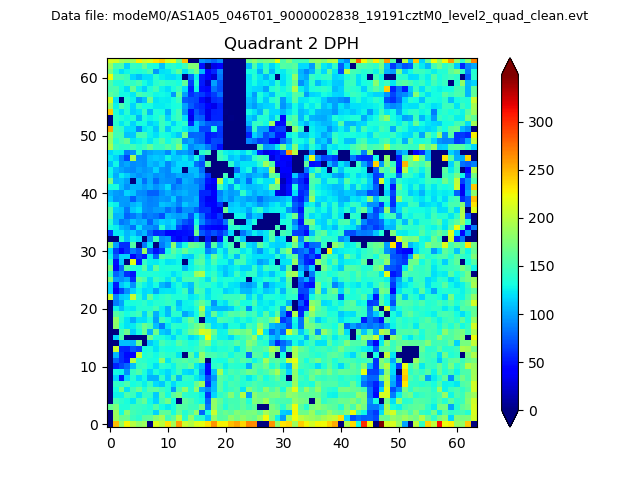 |
Quadrant C |
| Plot type | Count rate plots | Images |
|---|---|---|
| Comparison with Poisson distribution Blue bars denote a histogram of data divided into 1 sec bins. Red curve is a Poisson curve with rate = median count rate of data. |
 |
 |
| Quadrant-wise count rates Data is divided into 100 sec bins |
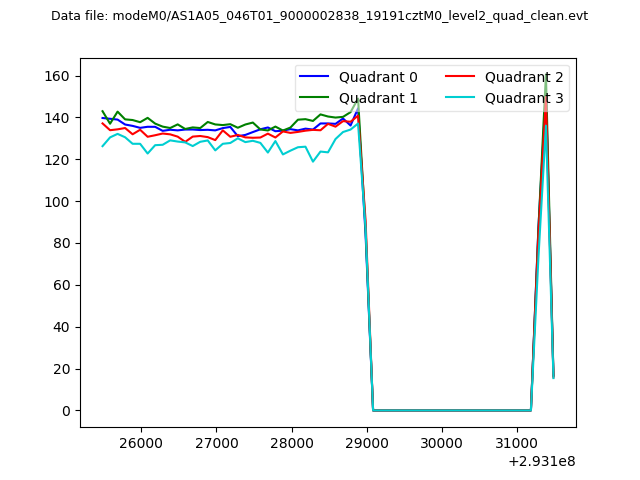 |
|
| Module-wise count rates for Quadrant A Data is divided into 100 sec bins |
 |
 |
| Module-wise count rates for Quadrant B Data is divided into 100 sec bins |
 |
 |
| Module-wise count rates for Quadrant C Data is divided into 100 sec bins |
 |
 |
| Module-wise count rates for Quadrant D Data is divided into 100 sec bins |
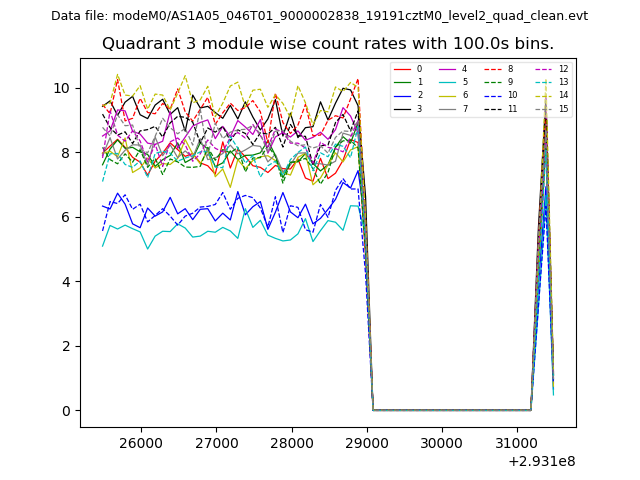 |
 |
| Parameter | Plot |
|---|---|
| CZT HV Monitor |  |
| D_VDD | 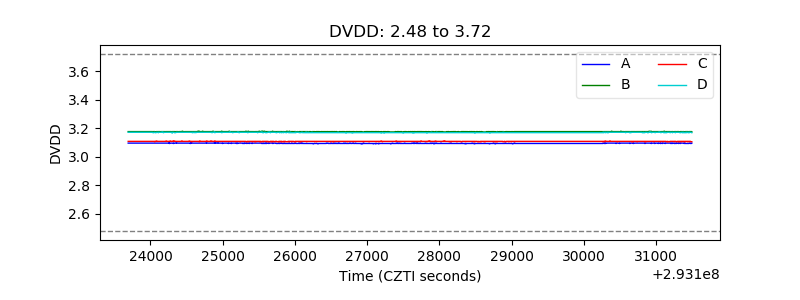 |
| Temperature 1 | 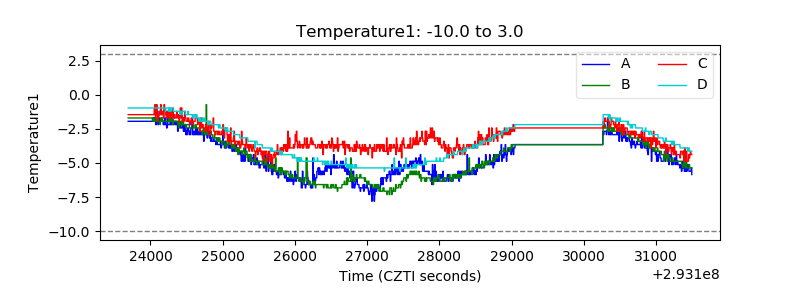 |
| Veto HV Monitor | 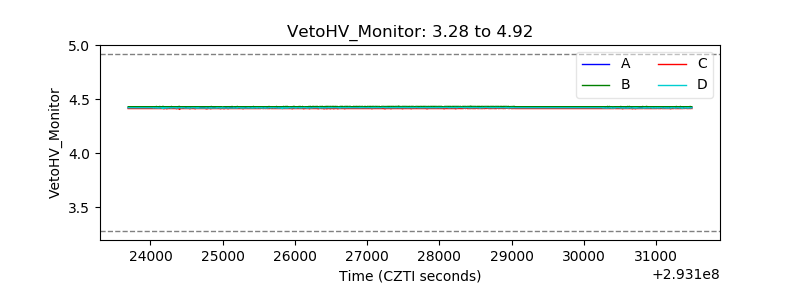 |
| Veto LLD | 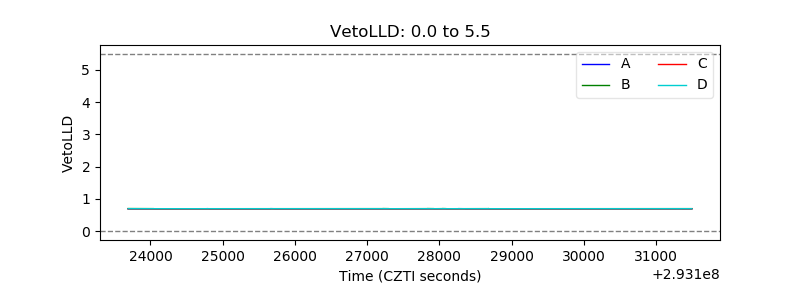 |
| Alpha Counter | 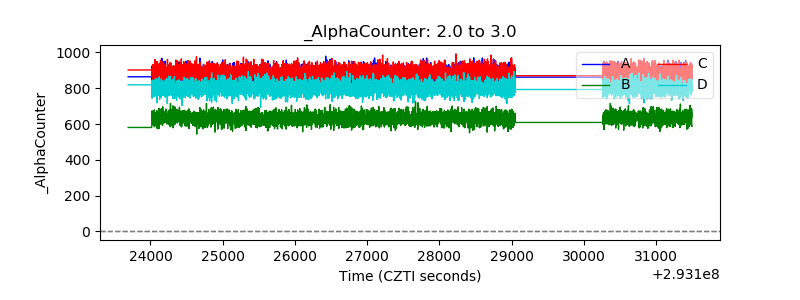 |
| _CPM_Rate | 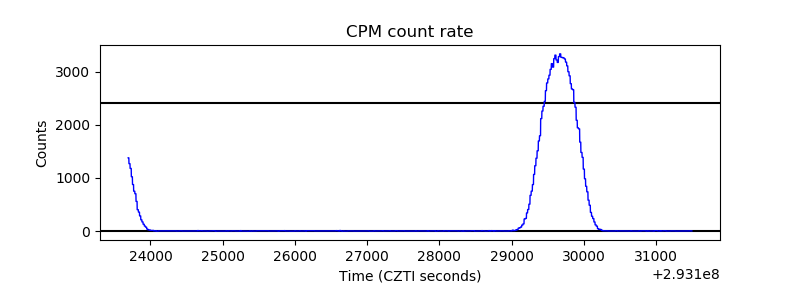 |
| CZT Counter | 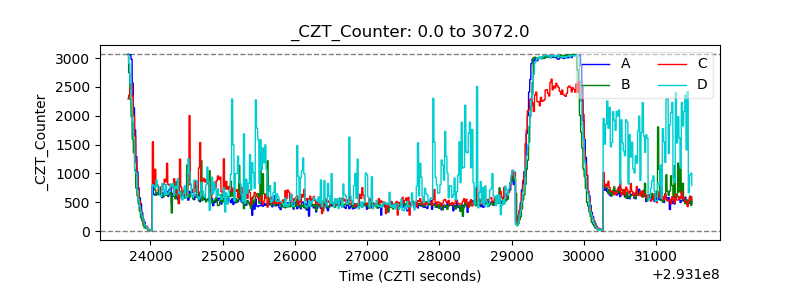 |
| +2.5 Volts monitor |  |
| +5 Volts monitor |  |
| _ROLL_ROT | 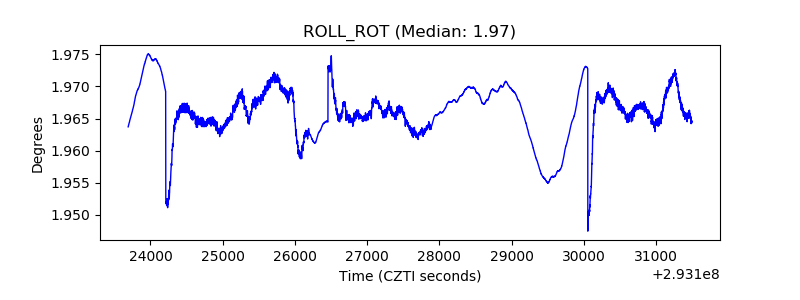 |
| _Roll_DEC | 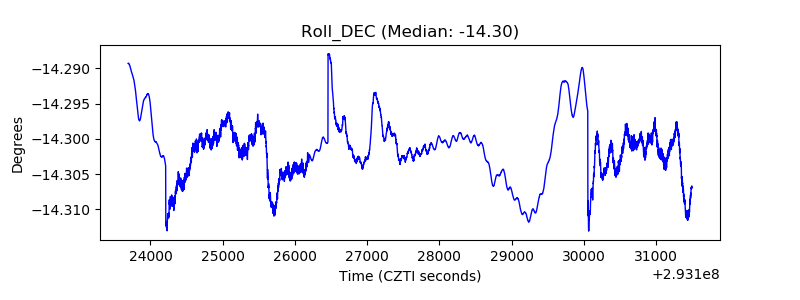 |
| _Roll_RA | 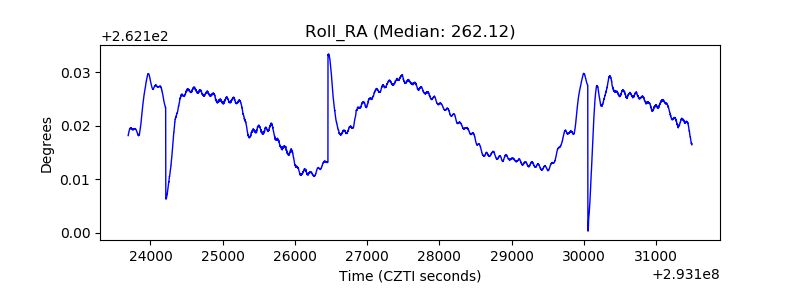 |
| Veto Counter |  |