| Param | Original file | Final file |
|---|---|---|
| Filename | modeM0/AS1A05_046T01_9000002838_19192cztM0_level2.evt | modeM0/AS1A05_046T01_9000002838_19192cztM0_level2_quad_clean.evt |
| Size (bytes) | 496,632,960 | 92,589,120 |
| Size | 473.6 MB | 88.3 MB |
| Events in quadrant A | 3,205,036 | 598,153 |
| Events in quadrant B | 3,427,175 | 618,120 |
| Events in quadrant C | 3,626,042 | 589,640 |
| Events in quadrant D | 4,369,671 | 573,359 |
| Mode M0 | |||
|---|---|---|---|
| Quadrant | BADHDUFLAG | Total packets | Discarded packets |
| A | 0 | 13434 | 1 |
| B | 0 | 14111 | 1 |
| C | 0 | 14801 | 1 |
| D | 0 | 16956 | 1 |
| Mode SS | |||
|---|---|---|---|
| Quadrant | BADHDUFLAG | Total packets | Discarded packets |
| A | 0 | 124 | 0 |
| B | 0 | 124 | 0 |
| C | 0 | 124 | 0 |
| D | 0 | 124 | 0 |
| Mode M9 | |||
|---|---|---|---|
| Quadrant | BADHDUFLAG | Total packets | Discarded packets |
| A | 0 | 13 | 0 |
| B | 0 | 13 | 0 |
| C | 0 | 13 | 0 |
| D | 0 | 13 | 0 |
| Quadrant | Total seconds | Saturated seconds | Saturation percentage |
|---|---|---|---|
| A | 6082 | 60 | 0.986518% |
| B | 6083 | 112 | 1.841197% |
| C | 6082 | 111 | 1.825058% |
| D | 6082 | 398 | 6.543900% |
Noise dominated data is calculated using 1-second bins in cleaned event files. If a bin has >2000 counts, and if more than 50% of those come from <1% of pixels, then it is considered to be noise-dominated and hence unusable.
| Quadrant | # 1 sec bins | Bins with >0 counts | Bins with >2000 counts | High rate bins dominated by noise | Noise dominated (total time) | Noise dominated (detector-on time) | Marked lightcurve |
|---|---|---|---|---|---|---|---|
| A | 7387 | 6083 | 0 | 0 | 0.00% | 0.00% | 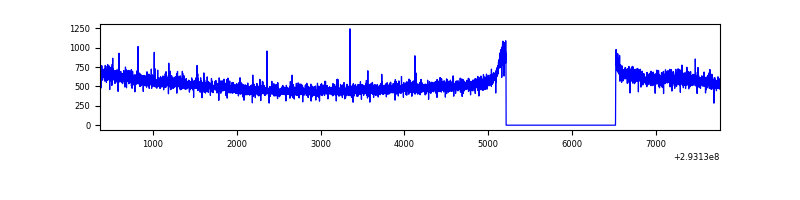 |
| B | 7388 | 6084 | 17 | 17 | 0.23% | 0.28% | 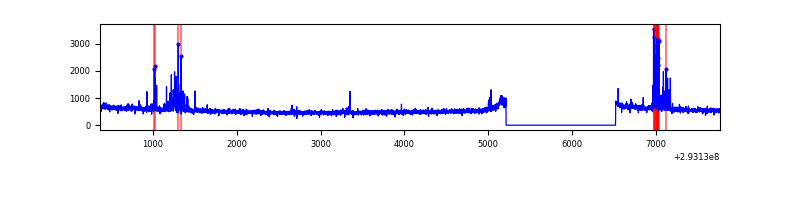 |
| C | 7387 | 6083 | 0 | 0 | 0.00% | 0.00% | 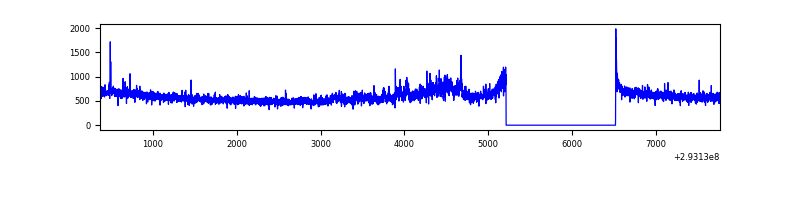 |
| D | 7387 | 6083 | 250 | 250 | 3.38% | 4.11% | 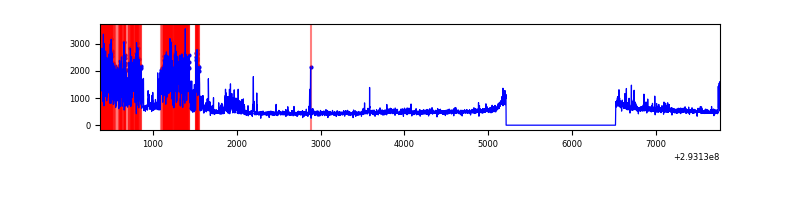 |
Top three noisy pixels from each quadrant. If the there are fewer than three noisy pixels in the level2.evt file, extra rows are filled as -1
| Pixel properties | Quadrant properties | ||||||
|---|---|---|---|---|---|---|---|
| Quadrant | DetID | PixID | Counts | Sigma | Mean | Median | Sigma |
| A | 8 | 144 | 28015 | 165.35 | 822 | 806 | 164.6 |
| A | 11 | 29 | 11102 | 62.57 | 822 | 806 | 164.6 |
| A | 13 | 254 | 8984 | 49.7 | 822 | 806 | 164.6 |
| B | 0 | 197 | 142676 | 923.03 | 826 | 808 | 153.7 |
| B | 0 | 190 | 25947 | 163.56 | 826 | 808 | 153.7 |
| B | 0 | 189 | 18874 | 117.54 | 826 | 808 | 153.7 |
| C | 3 | 233 | 385189 | 2089.7 | 797 | 804 | 183.9 |
| C | 14 | 238 | 126143 | 681.4 | 797 | 804 | 183.9 |
| C | 0 | 207 | 7749 | 37.76 | 797 | 804 | 183.9 |
| D | 10 | 66 | 1145038 | 6038.35 | 789 | 769 | 189.5 |
| D | 11 | 176 | 147293 | 773.21 | 789 | 769 | 189.5 |
| D | 1 | 52 | 101561 | 531.88 | 789 | 769 | 189.5 |
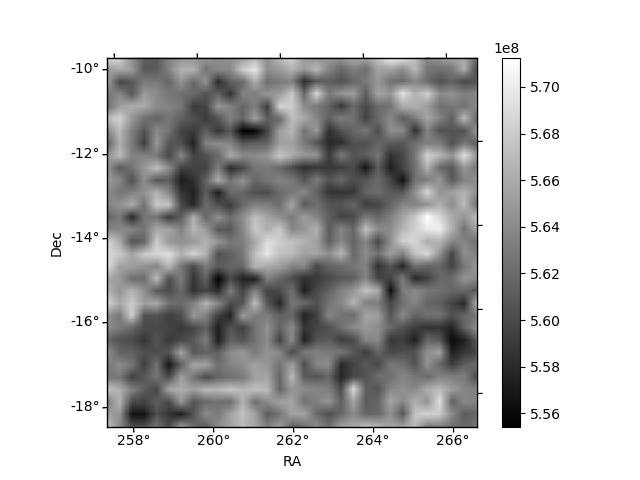
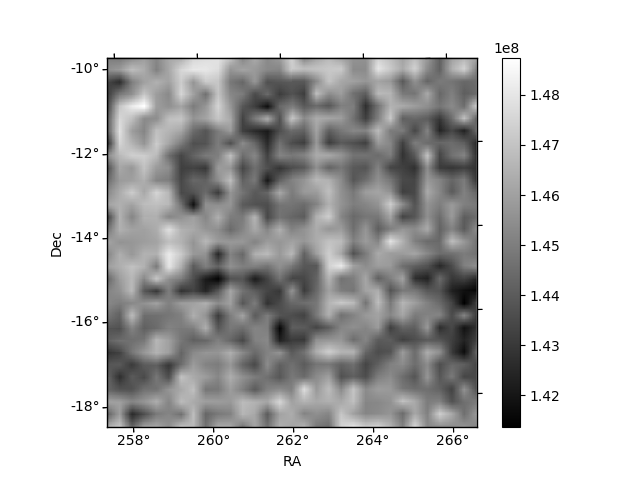
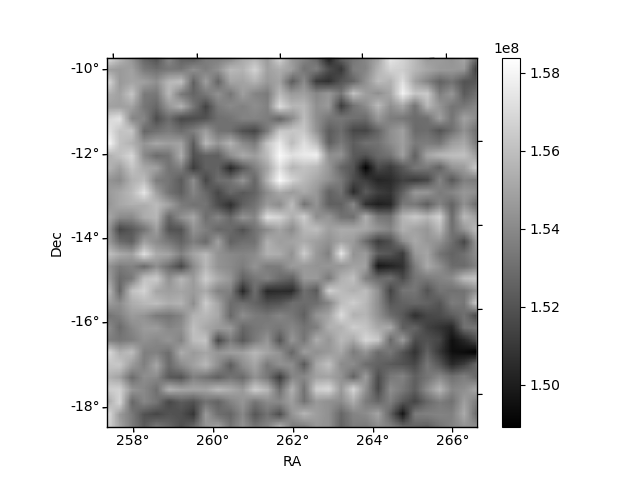
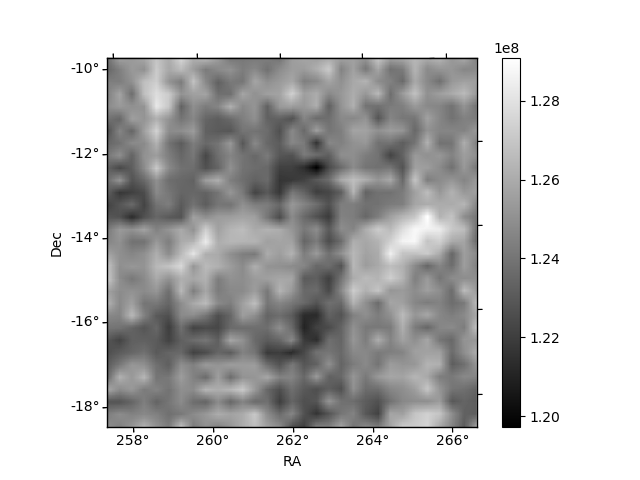
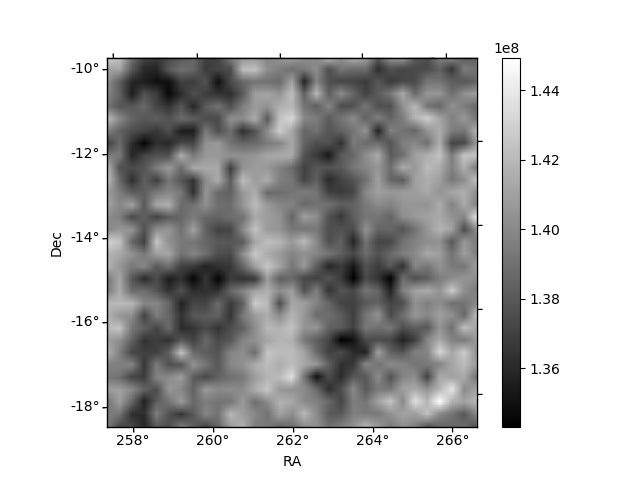
Histogram calculated using DETX and DETY for each event in the final _common_clean file
| Quadrant A | 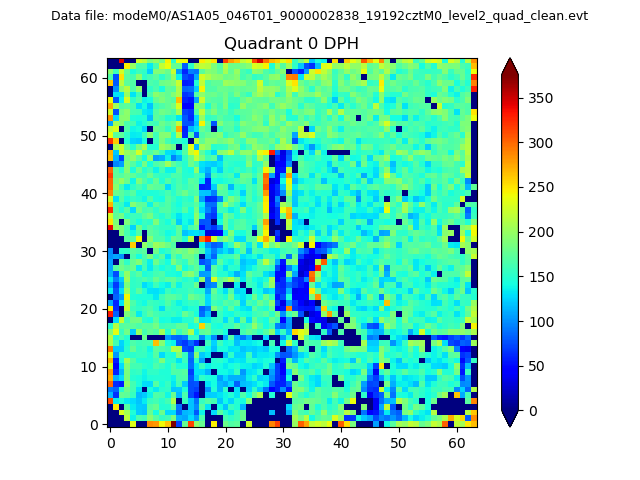 |
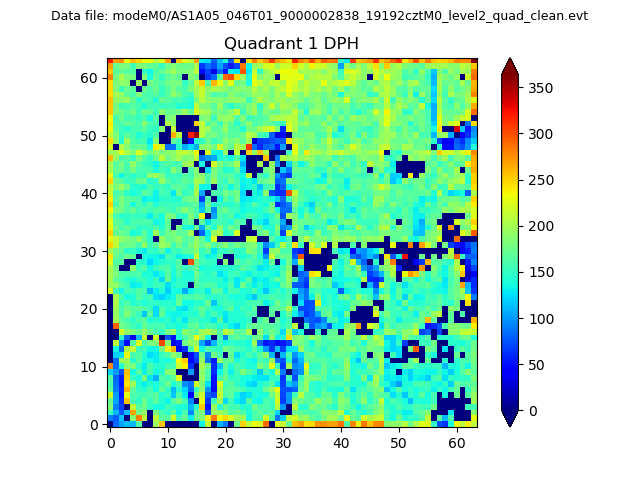 |
Quadrant B |
|---|---|---|---|
| Quadrant D | 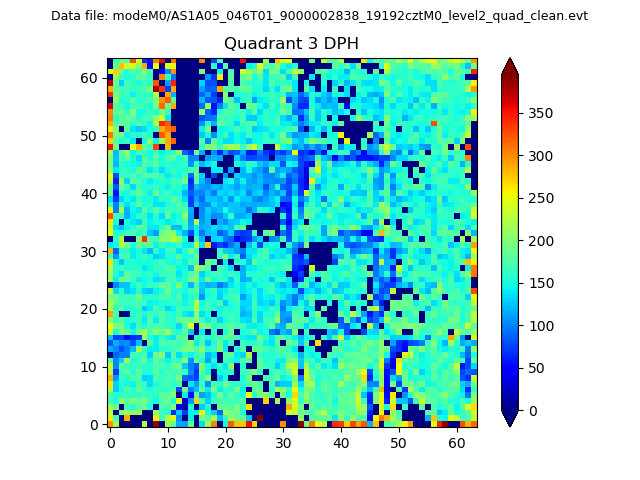 |
 |
Quadrant C |
| Plot type | Count rate plots | Images |
|---|---|---|
| Comparison with Poisson distribution Blue bars denote a histogram of data divided into 1 sec bins. Red curve is a Poisson curve with rate = median count rate of data. |
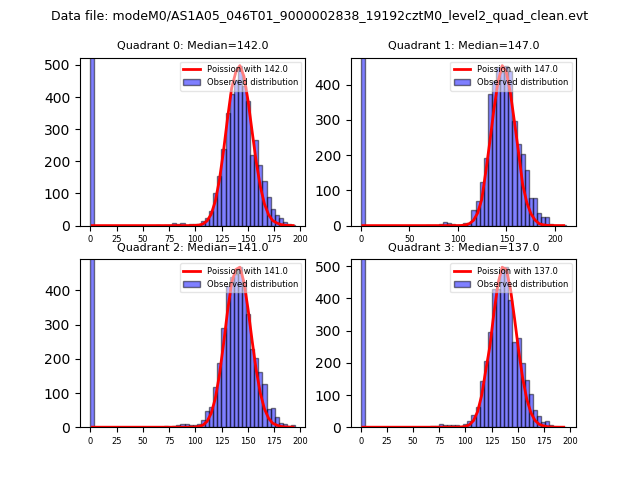 |
 |
| Quadrant-wise count rates Data is divided into 100 sec bins |
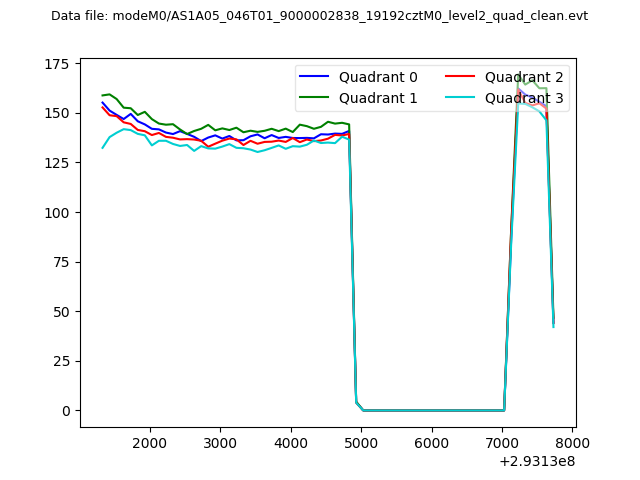 |
|
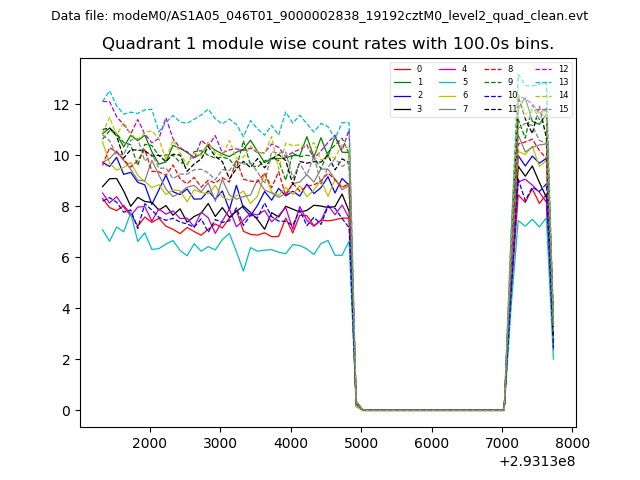
| Module-wise count rates for Quadrant A Data is divided into 100 sec bins |
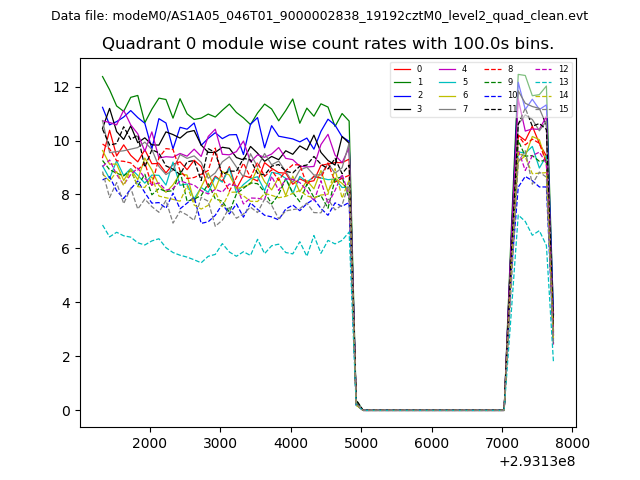 |
 |
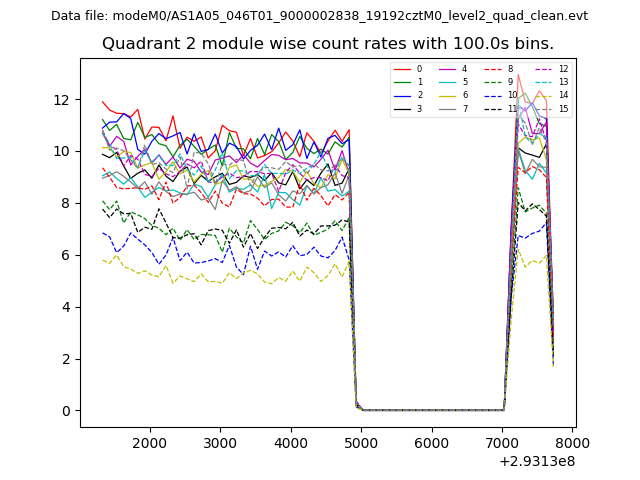
| Module-wise count rates for Quadrant B Data is divided into 100 sec bins |
 |
 |
| Module-wise count rates for Quadrant C Data is divided into 100 sec bins |
 |
 |
| Module-wise count rates for Quadrant D Data is divided into 100 sec bins |
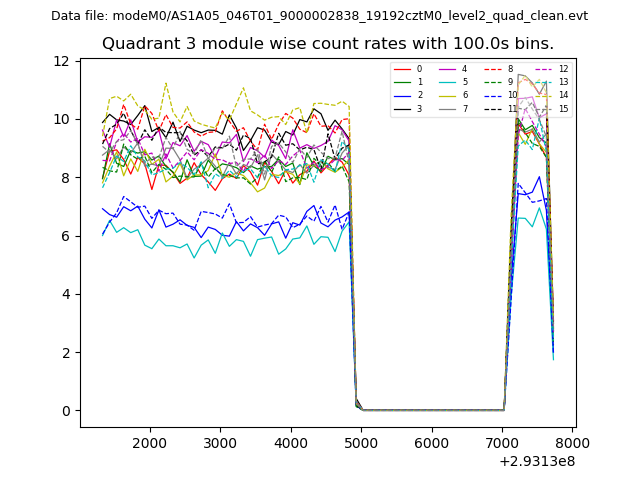 |
 |
| Parameter | Plot |
|---|---|
| CZT HV Monitor | 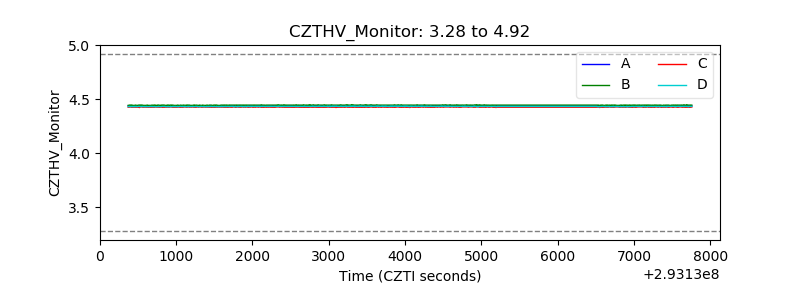 |
| D_VDD | 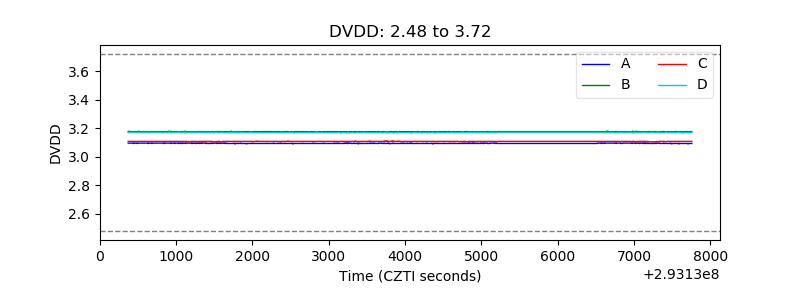 |
| Temperature 1 | 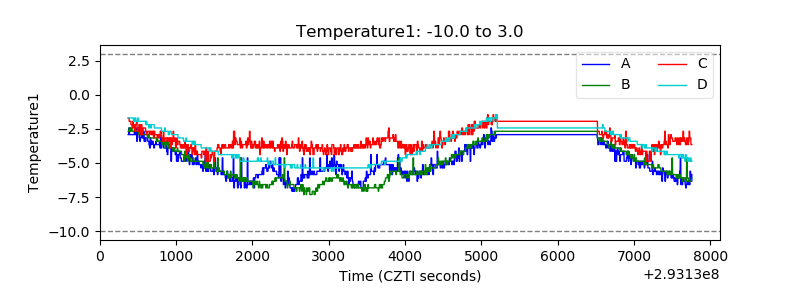 |
| Veto HV Monitor | 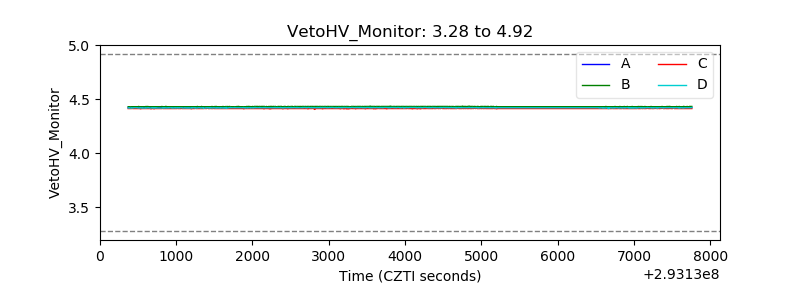 |
| Veto LLD | 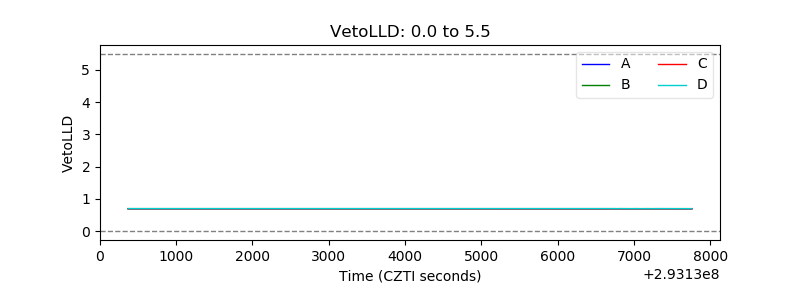 |
| Alpha Counter | 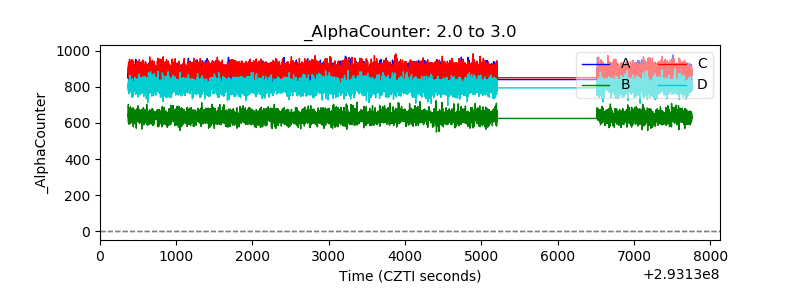 |
| _CPM_Rate | 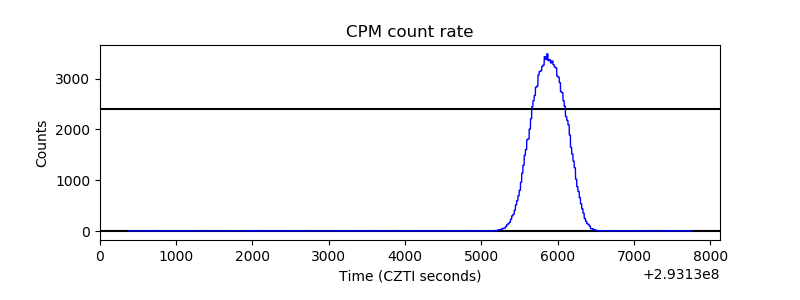 |
| CZT Counter | 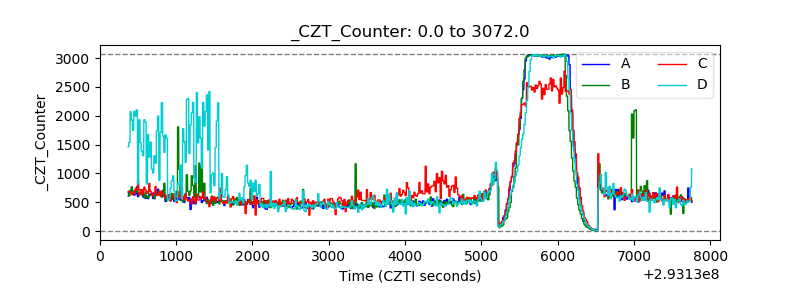 |
| +2.5 Volts monitor | 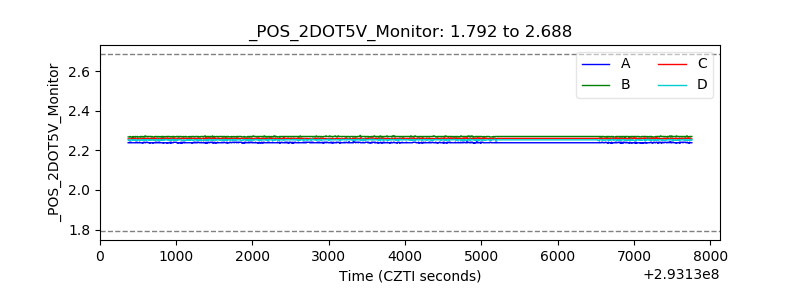 |
| +5 Volts monitor | 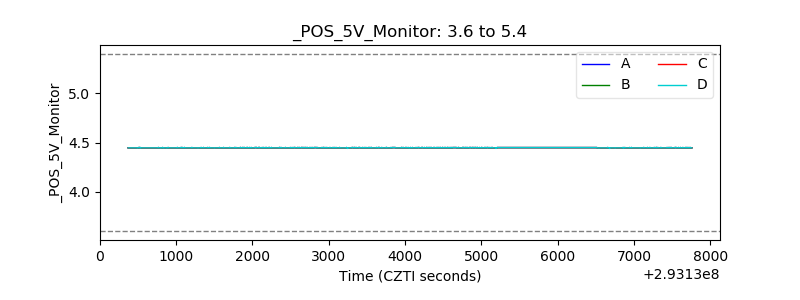 |
| _ROLL_ROT | 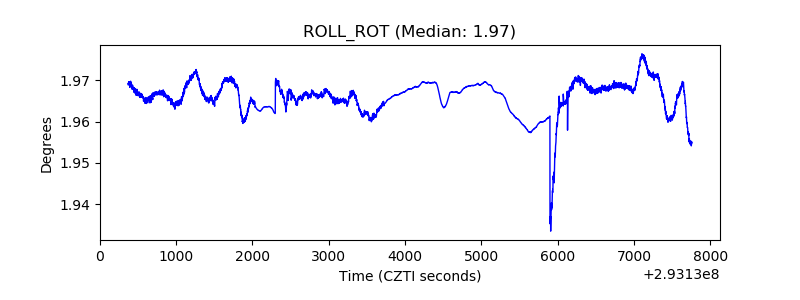 |
| _Roll_DEC |  |
| _Roll_RA | 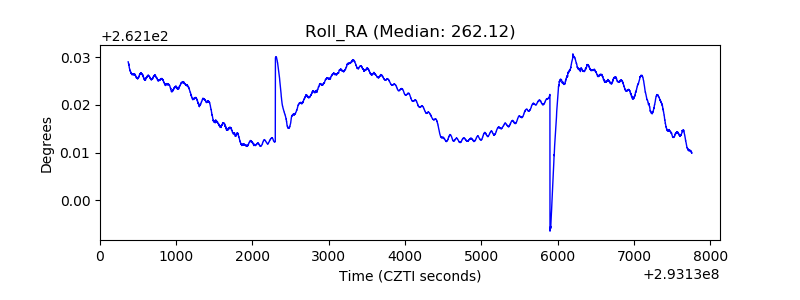 |
| Veto Counter | 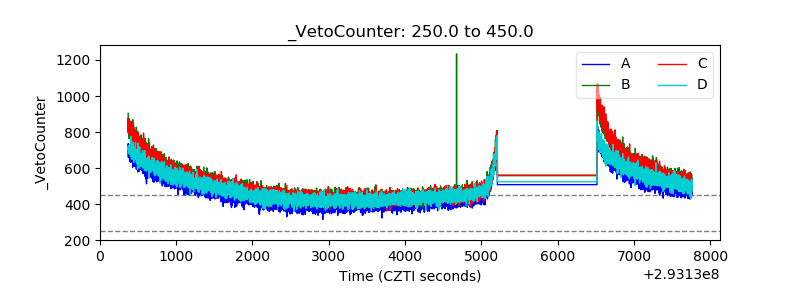 |