| Param | Original file | Final file |
|---|---|---|
| Filename | modeM0/AS1A05_046T01_9000002838_19193cztM0_level2.evt | modeM0/AS1A05_046T01_9000002838_19193cztM0_level2_quad_clean.evt |
| Size (bytes) | 478,872,000 | 100,846,080 |
| Size | 456.7 MB | 96.2 MB |
| Events in quadrant A | 3,083,593 | 661,452 |
| Events in quadrant B | 3,241,958 | 686,851 |
| Events in quadrant C | 3,427,097 | 658,559 |
| Events in quadrant D | 4,345,972 | 631,204 |
| Mode M0 | |||
|---|---|---|---|
| Quadrant | BADHDUFLAG | Total packets | Discarded packets |
| A | 0 | 12867 | 1 |
| B | 0 | 13351 | 1 |
| C | 0 | 13832 | 1 |
| D | 0 | 16928 | 1 |
| Mode SS | |||
|---|---|---|---|
| Quadrant | BADHDUFLAG | Total packets | Discarded packets |
| A | 0 | 122 | 0 |
| B | 0 | 122 | 0 |
| C | 0 | 122 | 0 |
| D | 0 | 122 | 0 |
| Mode M9 | |||
|---|---|---|---|
| Quadrant | BADHDUFLAG | Total packets | Discarded packets |
| A | 0 | 13 | 0 |
| B | 0 | 13 | 0 |
| C | 0 | 13 | 0 |
| D | 0 | 13 | 0 |
| Quadrant | Total seconds | Saturated seconds | Saturation percentage |
|---|---|---|---|
| A | 5954 | 60 | 1.007726% |
| B | 5954 | 97 | 1.629157% |
| C | 5954 | 103 | 1.729929% |
| D | 5954 | 238 | 3.997313% |
Noise dominated data is calculated using 1-second bins in cleaned event files. If a bin has >2000 counts, and if more than 50% of those come from <1% of pixels, then it is considered to be noise-dominated and hence unusable.
| Quadrant | # 1 sec bins | Bins with >0 counts | Bins with >2000 counts | High rate bins dominated by noise | Noise dominated (total time) | Noise dominated (detector-on time) | Marked lightcurve |
|---|---|---|---|---|---|---|---|
| A | 7294 | 5955 | 0 | 0 | 0.00% | 0.00% | 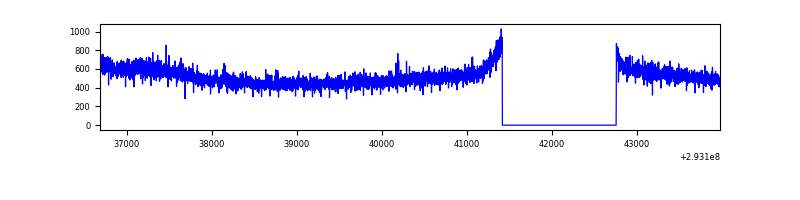 |
| B | 7294 | 5955 | 13 | 13 | 0.18% | 0.22% | 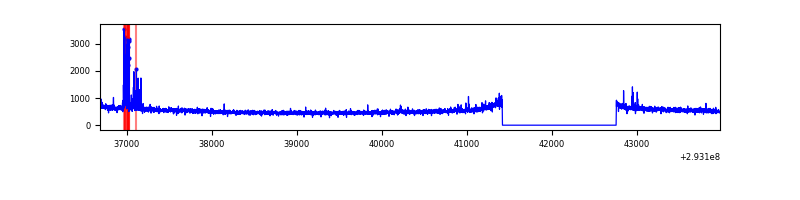 |
| C | 7294 | 5955 | 2 | 2 | 0.03% | 0.03% | 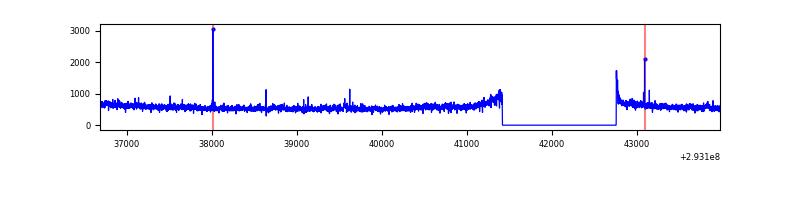 |
| D | 7294 | 5955 | 132 | 132 | 1.81% | 2.22% | 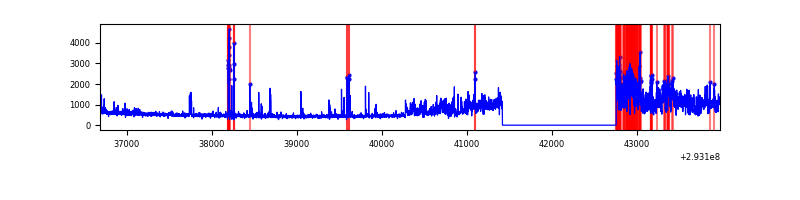 |
Top three noisy pixels from each quadrant. If the there are fewer than three noisy pixels in the level2.evt file, extra rows are filled as -1
| Pixel properties | Quadrant properties | ||||||
|---|---|---|---|---|---|---|---|
| Quadrant | DetID | PixID | Counts | Sigma | Mean | Median | Sigma |
| A | 8 | 144 | 35260 | 219.69 | 787 | 774 | 157.0 |
| A | 11 | 29 | 11356 | 67.41 | 787 | 774 | 157.0 |
| A | 13 | 254 | 9266 | 54.1 | 787 | 774 | 157.0 |
| B | 0 | 197 | 97432 | 650.0 | 796 | 777 | 148.7 |
| B | 0 | 189 | 17888 | 115.07 | 796 | 777 | 148.7 |
| B | 12 | 111 | 17341 | 111.39 | 796 | 777 | 148.7 |
| C | 3 | 233 | 301907 | 1689.34 | 770 | 777 | 178.3 |
| C | 14 | 238 | 120118 | 669.5 | 770 | 777 | 178.3 |
| C | 13 | 61 | 5352 | 25.67 | 770 | 777 | 178.3 |
| D | 10 | 66 | 1140721 | 6158.25 | 764 | 744 | 185.1 |
| D | 1 | 52 | 320728 | 1728.58 | 764 | 744 | 185.1 |
| D | 2 | 234 | 22883 | 119.6 | 764 | 744 | 185.1 |
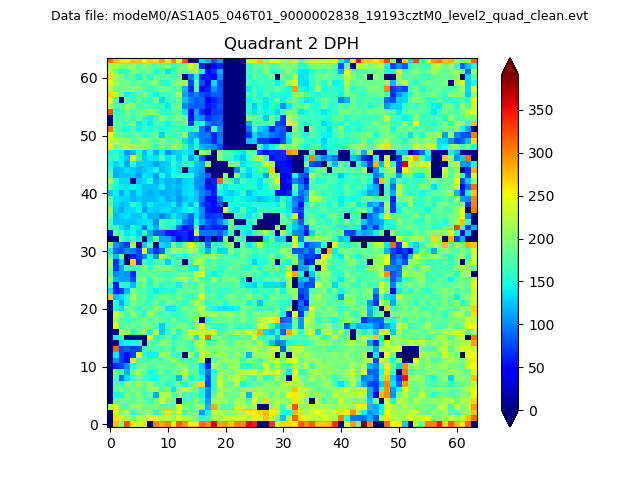
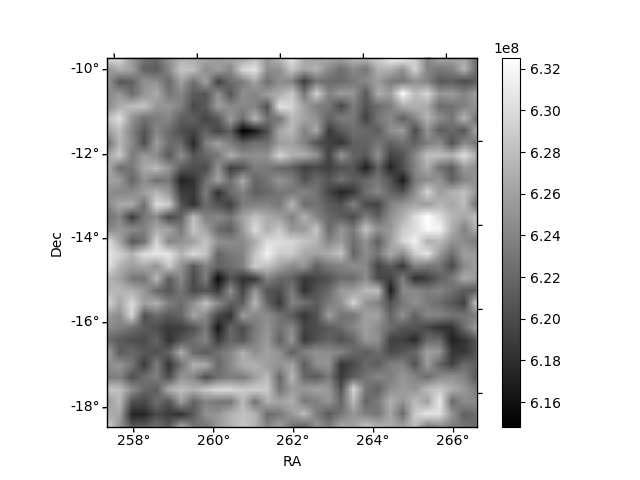
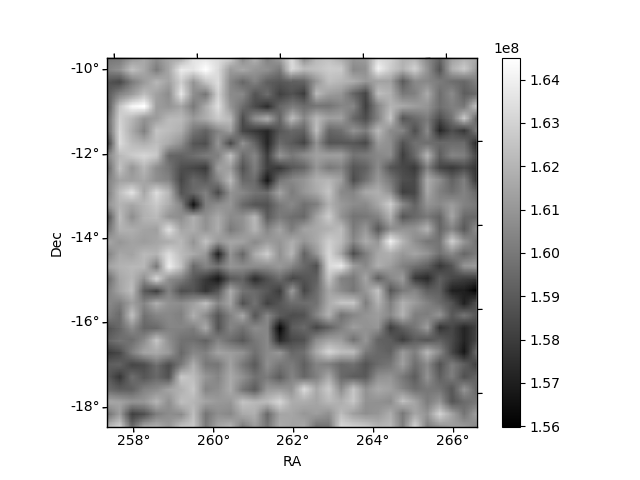
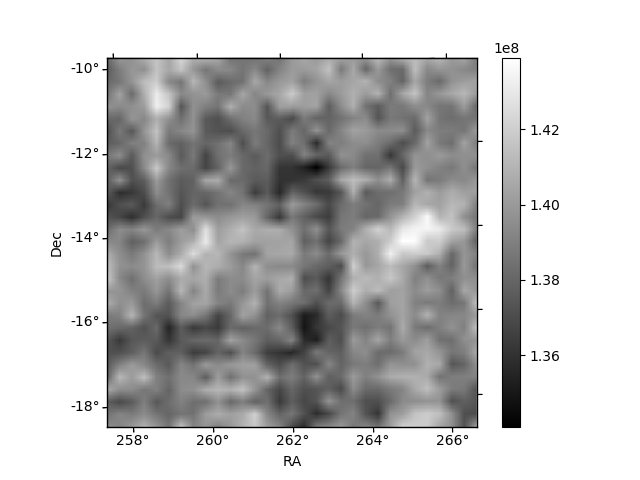
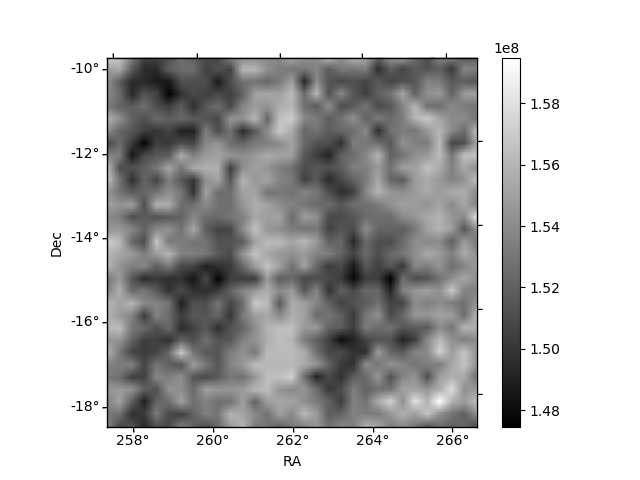
Histogram calculated using DETX and DETY for each event in the final _common_clean file
| Quadrant A | 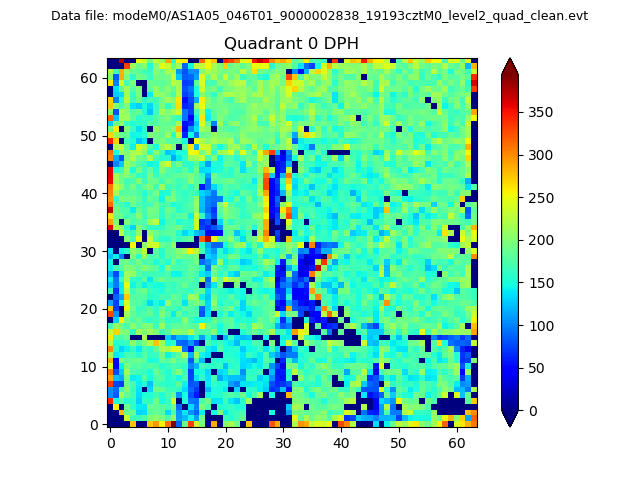 |
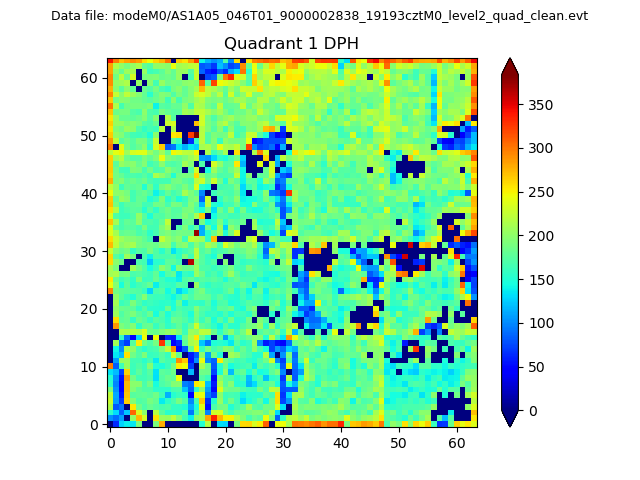 |
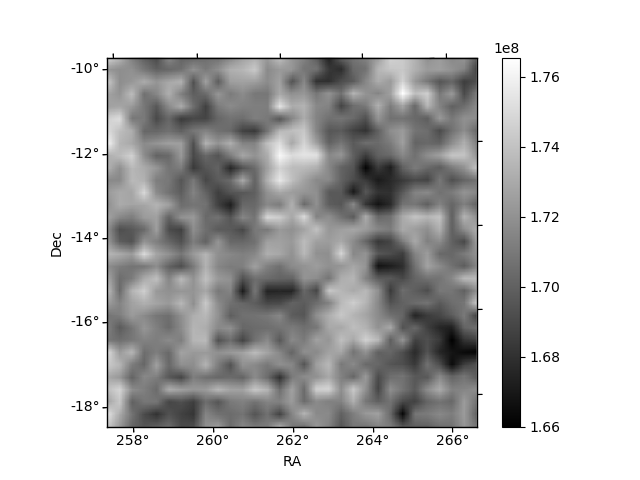
Quadrant B |
|---|---|---|---|
| Quadrant D | 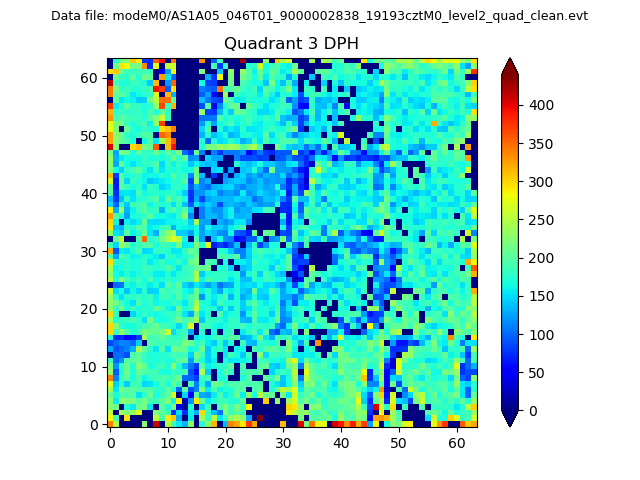 |
 |
Quadrant C |
| Plot type | Count rate plots | Images |
|---|---|---|
| Comparison with Poisson distribution Blue bars denote a histogram of data divided into 1 sec bins. Red curve is a Poisson curve with rate = median count rate of data. |
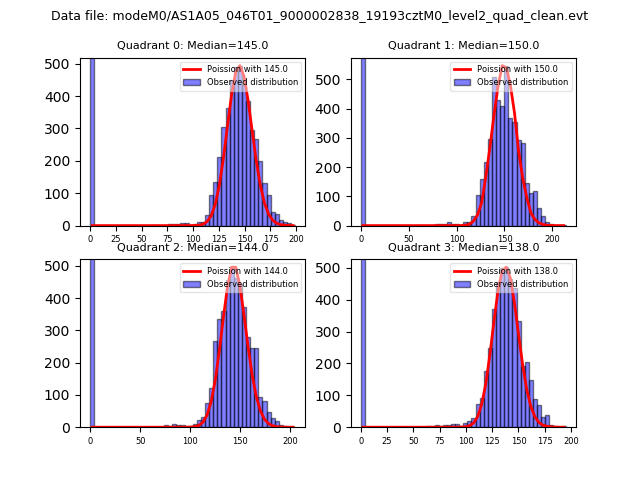 |
 |
| Quadrant-wise count rates Data is divided into 100 sec bins |
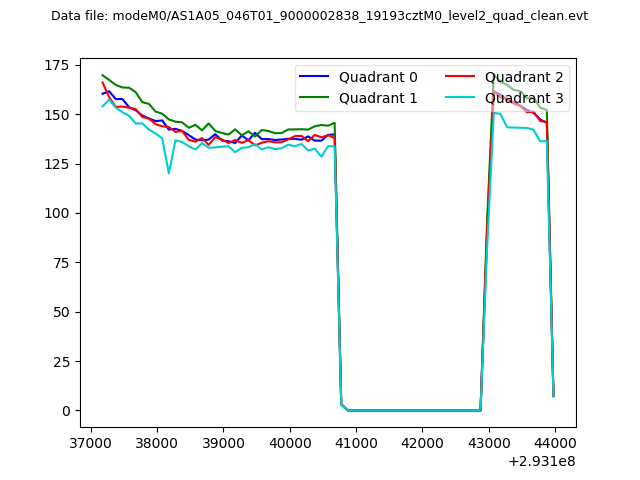 |
|
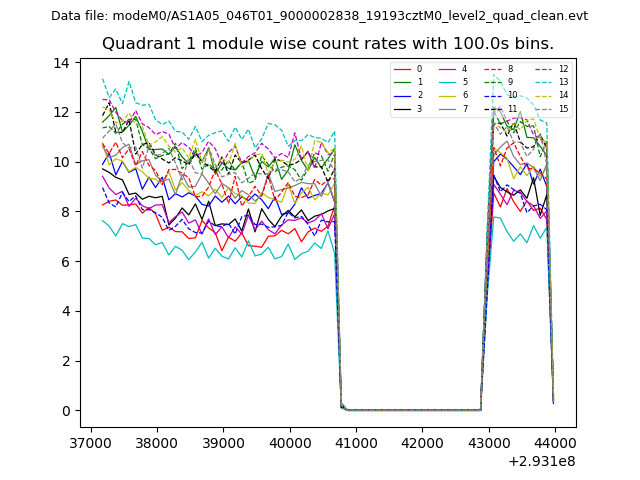
| Module-wise count rates for Quadrant A Data is divided into 100 sec bins |
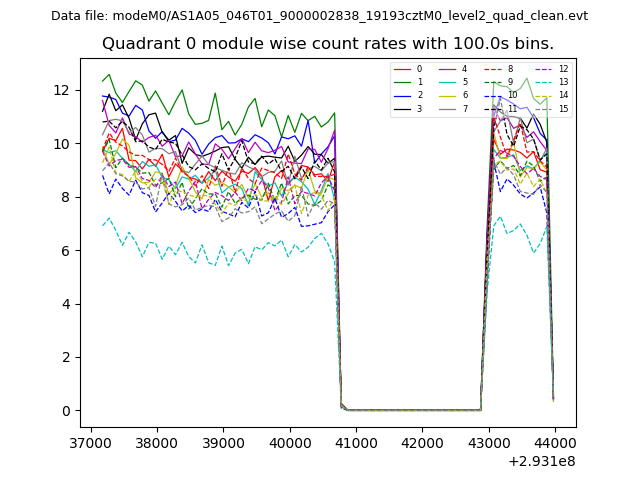 |
 |
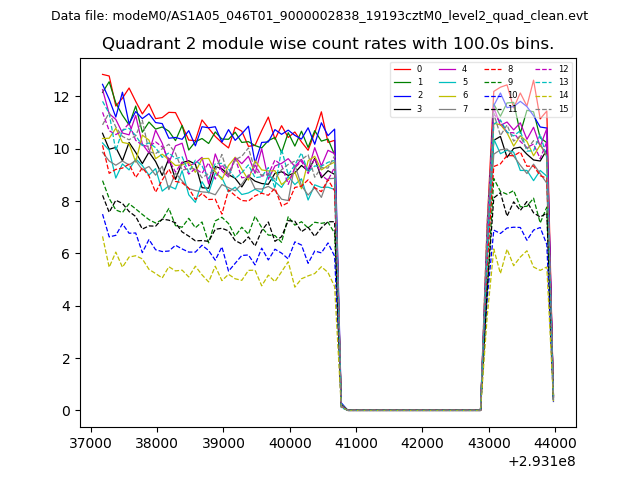
| Module-wise count rates for Quadrant B Data is divided into 100 sec bins |
 |
 |
| Module-wise count rates for Quadrant C Data is divided into 100 sec bins |
 |
 |
| Module-wise count rates for Quadrant D Data is divided into 100 sec bins |
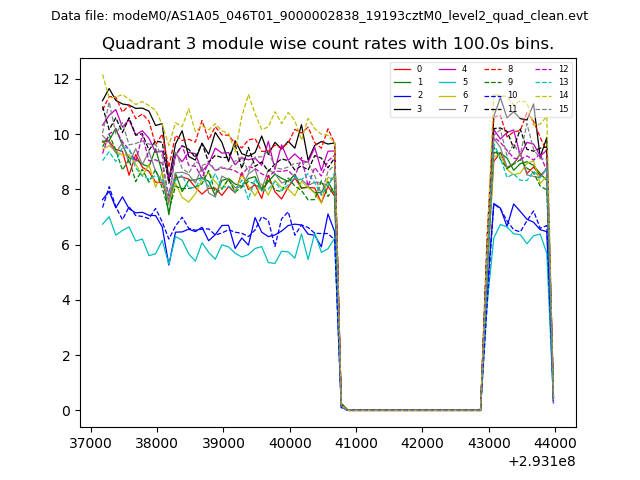 |
 |
| Parameter | Plot |
|---|---|
| CZT HV Monitor | 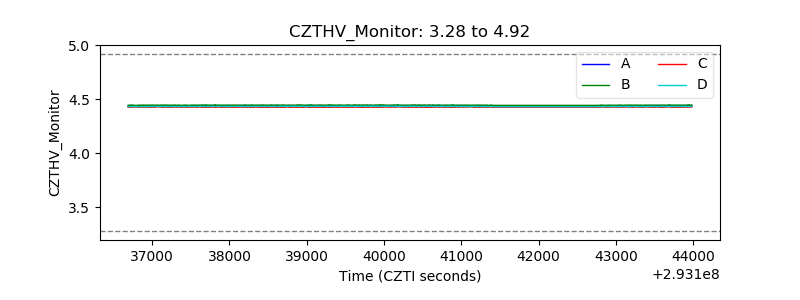 |
| D_VDD | 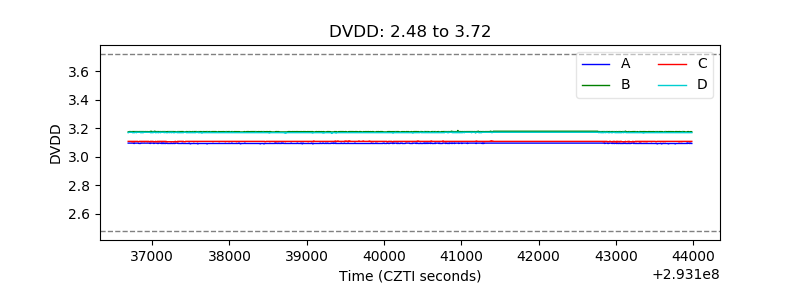 |
| Temperature 1 | 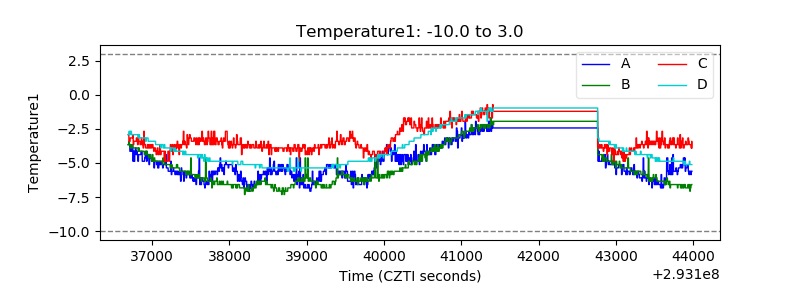 |
| Veto HV Monitor |  |
| Veto LLD | 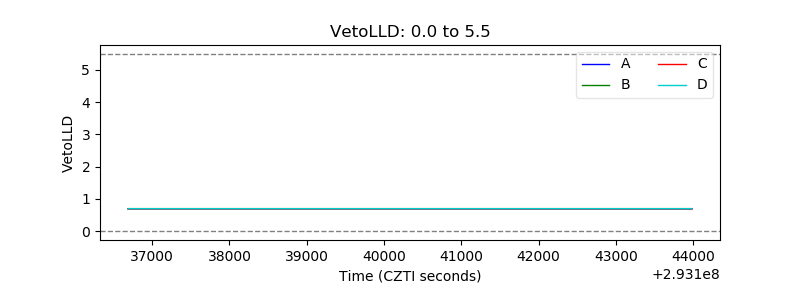 |
| Alpha Counter |  |
| _CPM_Rate | 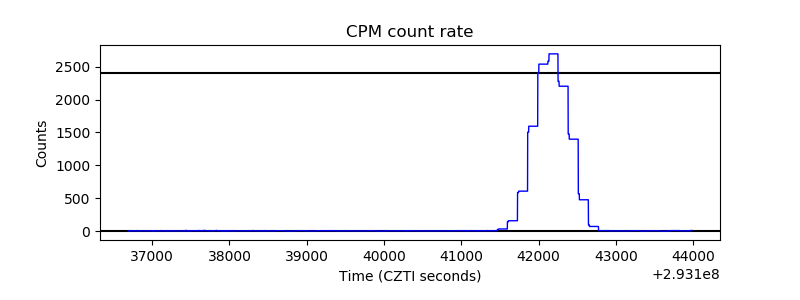 |
| CZT Counter | 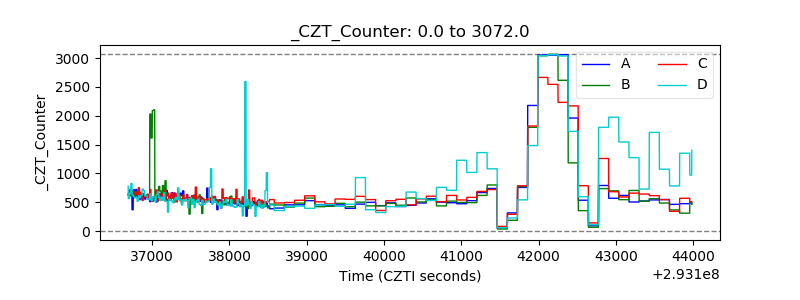 |
| +2.5 Volts monitor | 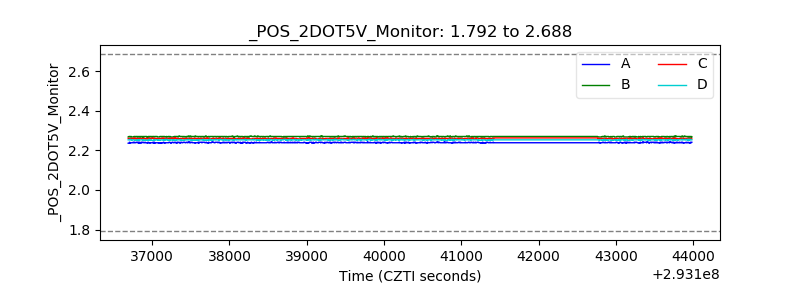 |
| +5 Volts monitor |  |
| _ROLL_ROT | 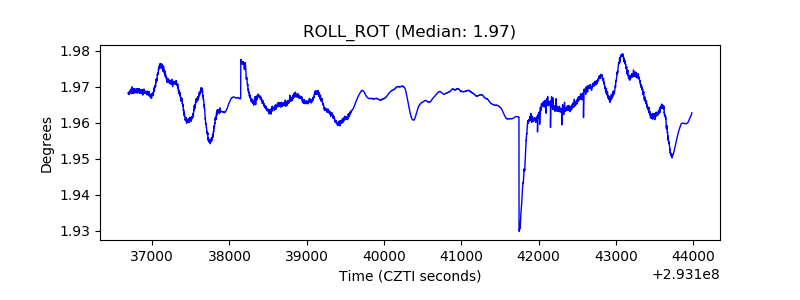 |
| _Roll_DEC | 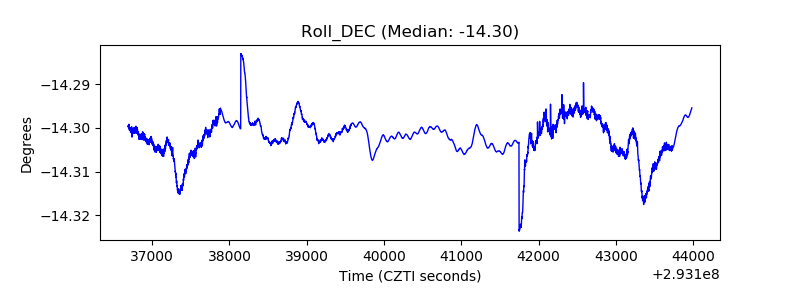 |
| _Roll_RA | 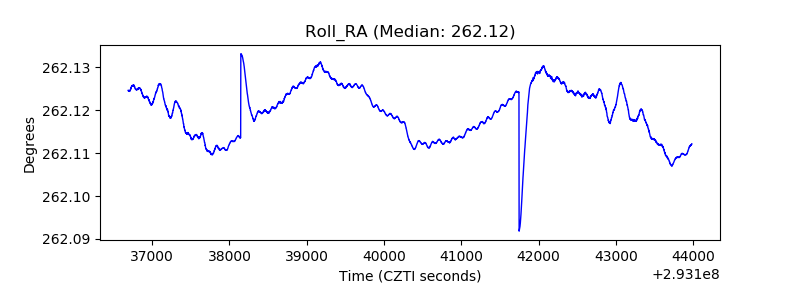 |
| Veto Counter | 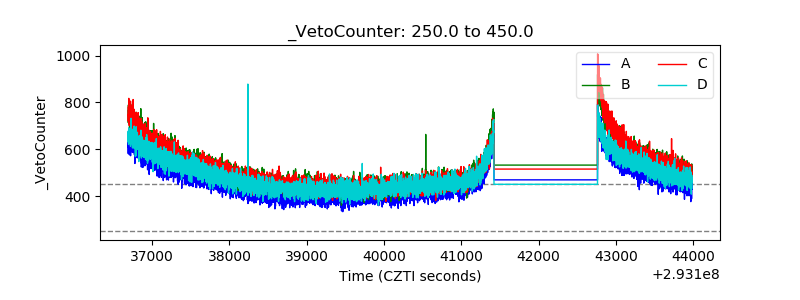 |