| Param | Original file | Final file |
|---|---|---|
| Filename | modeM0/AS1A05_046T01_9000002838_19194cztM0_level2.evt | modeM0/AS1A05_046T01_9000002838_19194cztM0_level2_quad_clean.evt |
| Size (bytes) | 509,760,000 | 104,843,520 |
| Size | 486.1 MB | 100.0 MB |
| Events in quadrant A | 3,189,131 | 683,051 |
| Events in quadrant B | 3,334,359 | 713,047 |
| Events in quadrant C | 3,613,603 | 683,286 |
| Events in quadrant D | 4,871,051 | 653,592 |
| Mode M0 | |||
|---|---|---|---|
| Quadrant | BADHDUFLAG | Total packets | Discarded packets |
| A | 0 | 13465 | 2 |
| B | 0 | 13881 | 2 |
| C | 0 | 14609 | 2 |
| D | 0 | 18705 | 2 |
| Mode SS | |||
|---|---|---|---|
| Quadrant | BADHDUFLAG | Total packets | Discarded packets |
| A | 0 | 130 | 0 |
| B | 0 | 130 | 0 |
| C | 0 | 132 | 0 |
| D | 0 | 132 | 0 |
| Mode M9 | |||
|---|---|---|---|
| Quadrant | BADHDUFLAG | Total packets | Discarded packets |
| A | 0 | 26 | 0 |
| B | 0 | 26 | 0 |
| C | 0 | 26 | 0 |
| D | 0 | 26 | 0 |
| Quadrant | Total seconds | Saturated seconds | Saturation percentage |
|---|---|---|---|
| A | 6337 | 87 | 1.372889% |
| B | 6337 | 124 | 1.956762% |
| C | 6338 | 146 | 2.303566% |
| D | 6338 | 230 | 3.628905% |
Noise dominated data is calculated using 1-second bins in cleaned event files. If a bin has >2000 counts, and if more than 50% of those come from <1% of pixels, then it is considered to be noise-dominated and hence unusable.
| Quadrant | # 1 sec bins | Bins with >0 counts | Bins with >2000 counts | High rate bins dominated by noise | Noise dominated (total time) | Noise dominated (detector-on time) | Marked lightcurve |
|---|---|---|---|---|---|---|---|
| A | 8957 | 6339 | 0 | 0 | 0.00% | 0.00% | 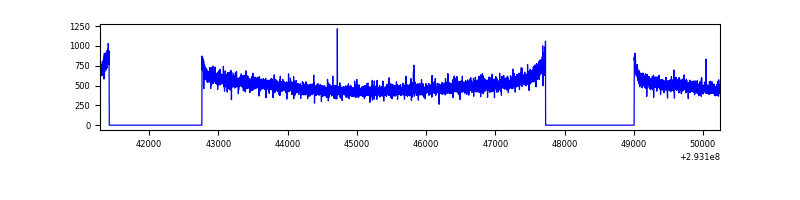 |
| B | 8957 | 6339 | 2 | 2 | 0.02% | 0.03% | 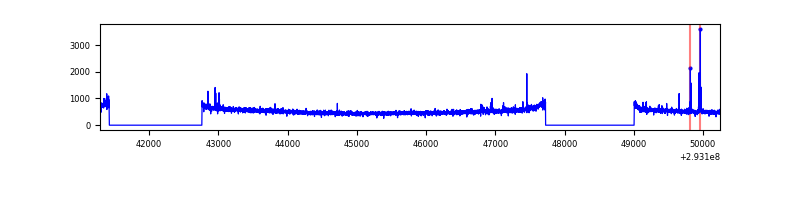 |
| C | 8958 | 6340 | 1 | 1 | 0.01% | 0.02% | 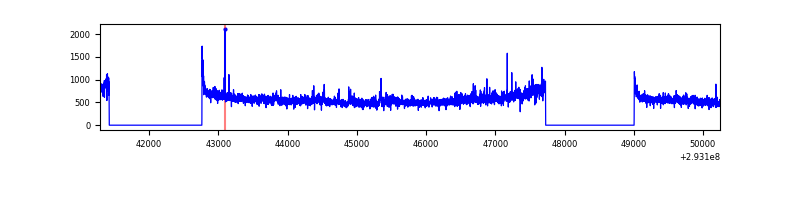 |
| D | 8958 | 6340 | 133 | 133 | 1.48% | 2.10% | 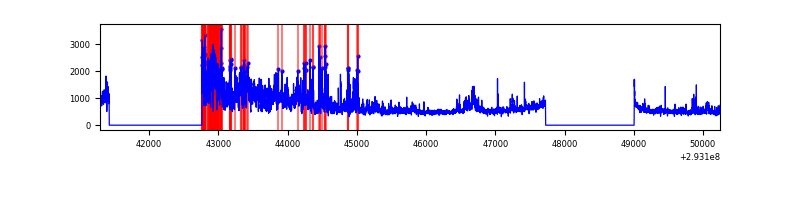 |
Top three noisy pixels from each quadrant. If the there are fewer than three noisy pixels in the level2.evt file, extra rows are filled as -1
| Pixel properties | Quadrant properties | ||||||
|---|---|---|---|---|---|---|---|
| Quadrant | DetID | PixID | Counts | Sigma | Mean | Median | Sigma |
| A | 13 | 254 | 8940 | 48.84 | 826 | 811 | 166.4 |
| A | 0 | 226 | 7242 | 38.64 | 826 | 811 | 166.4 |
| A | 3 | 137 | 6373 | 33.42 | 826 | 811 | 166.4 |
| B | 0 | 189 | 23023 | 142.63 | 835 | 815 | 155.7 |
| B | 4 | 173 | 21174 | 130.76 | 835 | 815 | 155.7 |
| B | 12 | 111 | 18517 | 113.69 | 835 | 815 | 155.7 |
| C | 3 | 233 | 334825 | 1772.55 | 808 | 816 | 188.4 |
| C | 14 | 238 | 125990 | 664.29 | 808 | 816 | 188.4 |
| C | 13 | 61 | 5652 | 25.66 | 808 | 816 | 188.4 |
| D | 10 | 66 | 1453187 | 7515.98 | 802 | 782 | 193.2 |
| D | 1 | 52 | 380137 | 1963.1 | 802 | 782 | 193.2 |
| D | 2 | 234 | 24890 | 124.76 | 802 | 782 | 193.2 |
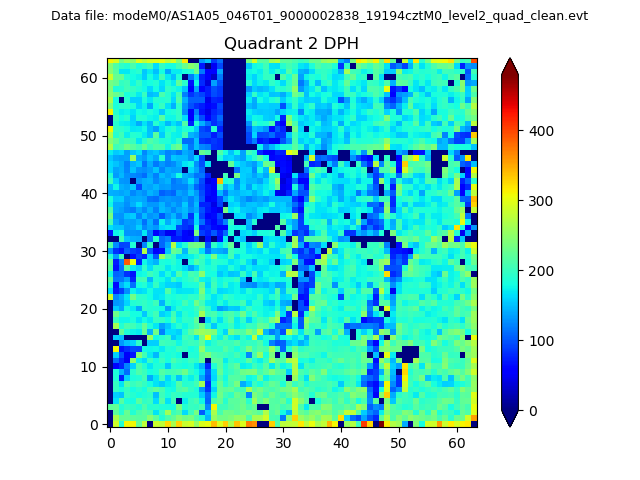
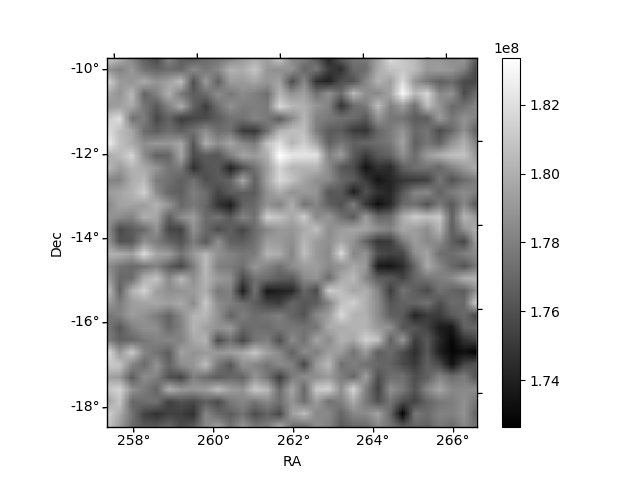
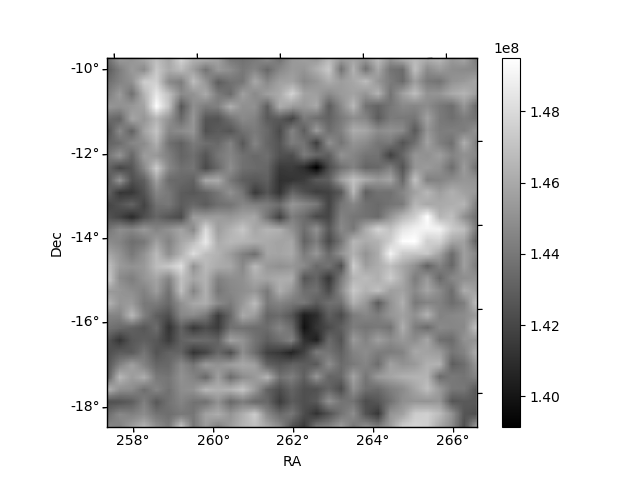
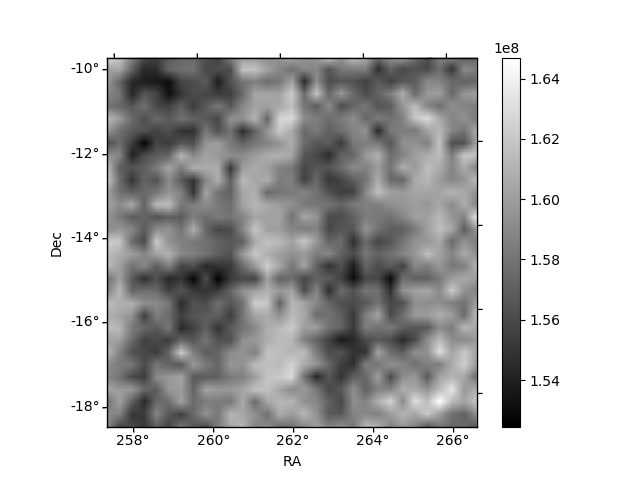
Histogram calculated using DETX and DETY for each event in the final _common_clean file
| Quadrant A | 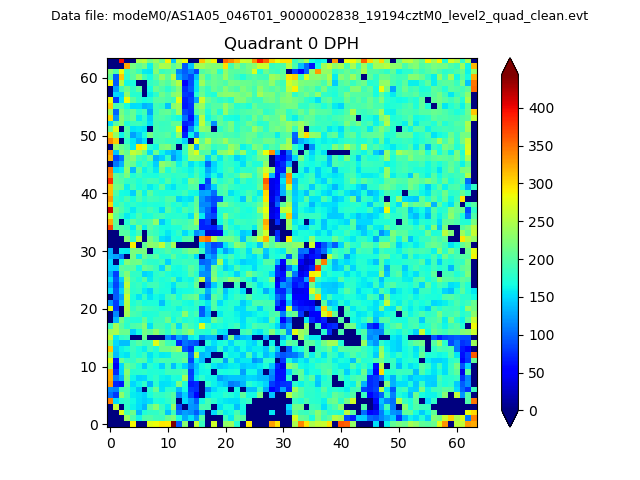 |
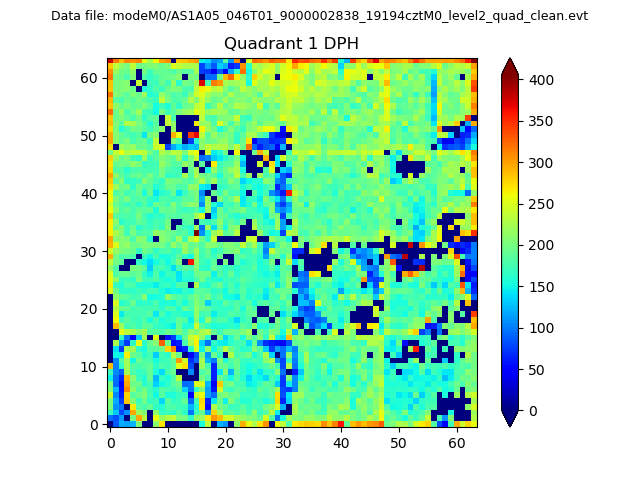 |
Quadrant B |
|---|---|---|---|
| Quadrant D | 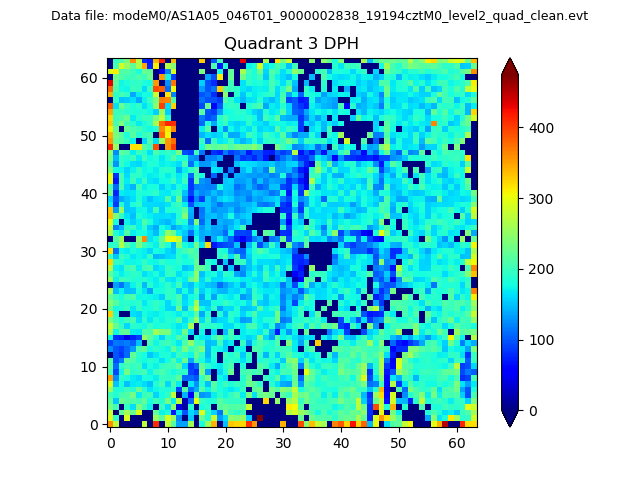 |
 |
Quadrant C |
| Plot type | Count rate plots | Images |
|---|---|---|
| Comparison with Poisson distribution Blue bars denote a histogram of data divided into 1 sec bins. Red curve is a Poisson curve with rate = median count rate of data. |
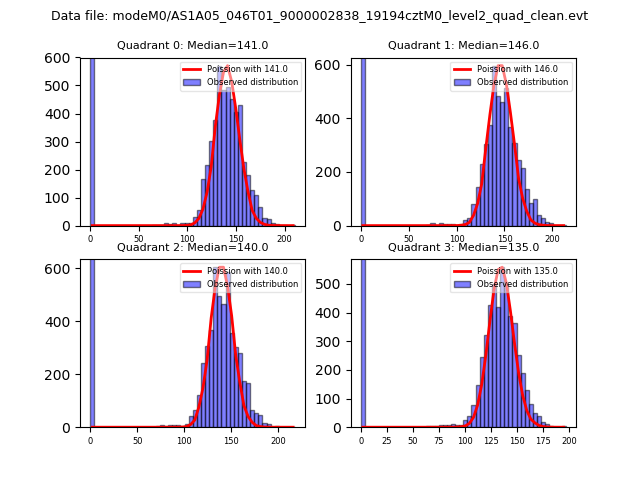 |
 |
| Quadrant-wise count rates Data is divided into 100 sec bins |
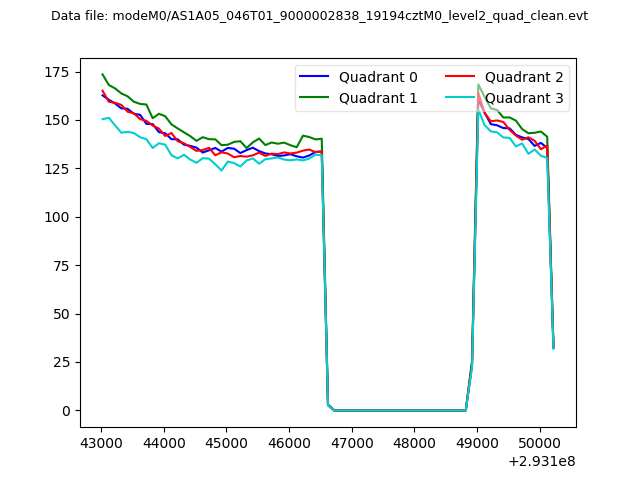 |
|
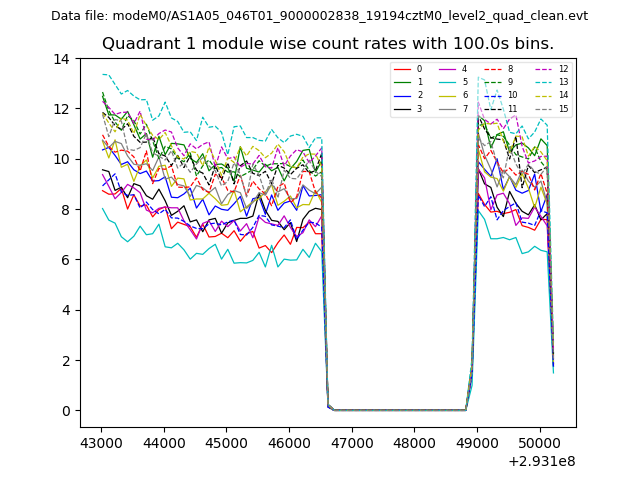
| Module-wise count rates for Quadrant A Data is divided into 100 sec bins |
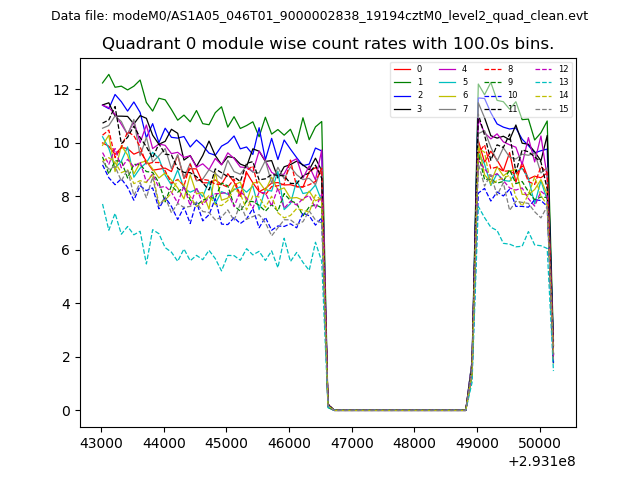 |
 |
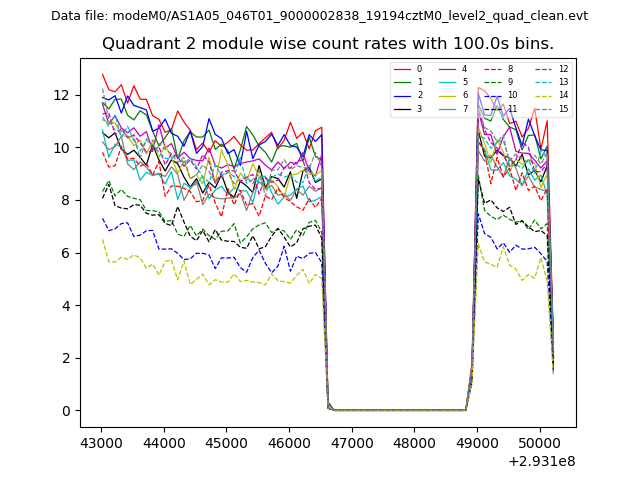
| Module-wise count rates for Quadrant B Data is divided into 100 sec bins |
 |
 |
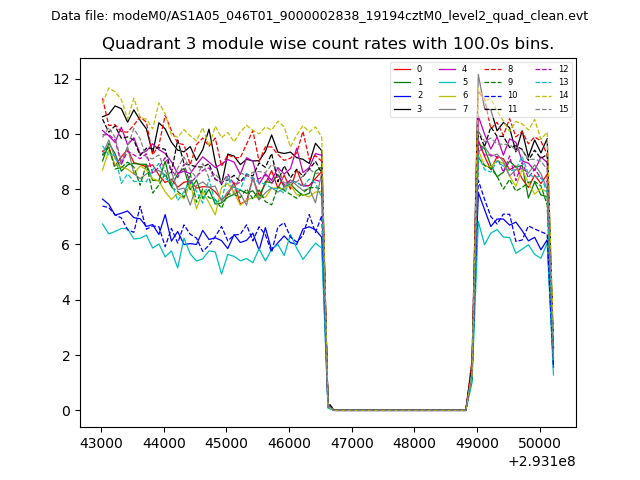
| Module-wise count rates for Quadrant C Data is divided into 100 sec bins |
 |
 |
| Module-wise count rates for Quadrant D Data is divided into 100 sec bins |
 |
 |
| Parameter | Plot |
|---|---|
| CZT HV Monitor | 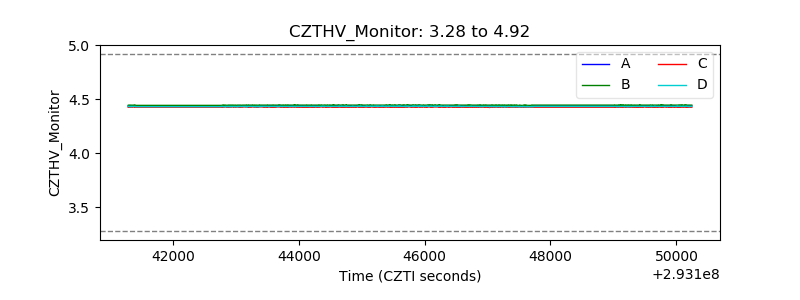 |
| D_VDD | 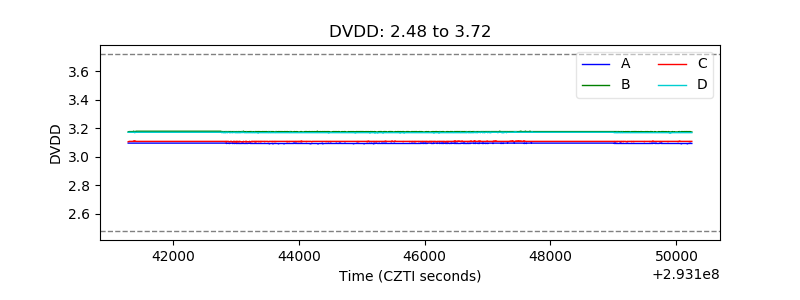 |
| Temperature 1 | 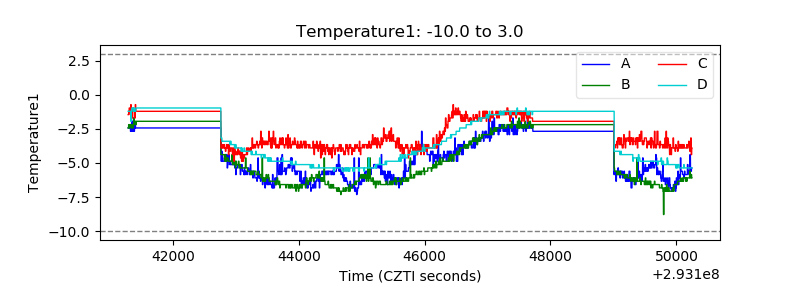 |
| Veto HV Monitor |  |
| Veto LLD | 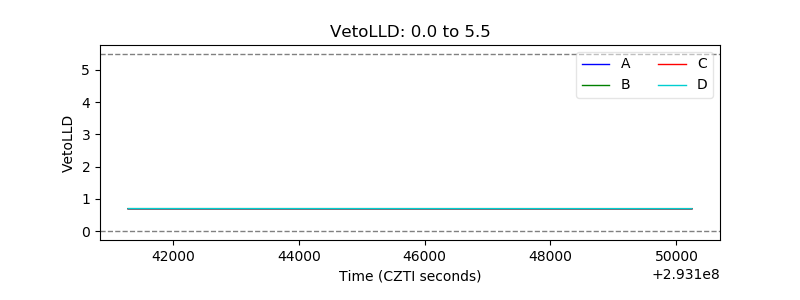 |
| Alpha Counter |  |
| _CPM_Rate | 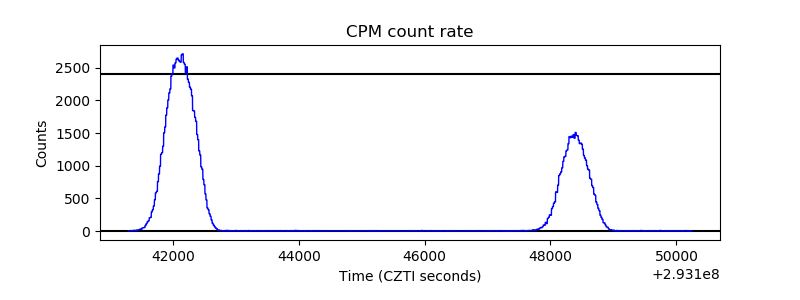 |
| CZT Counter | 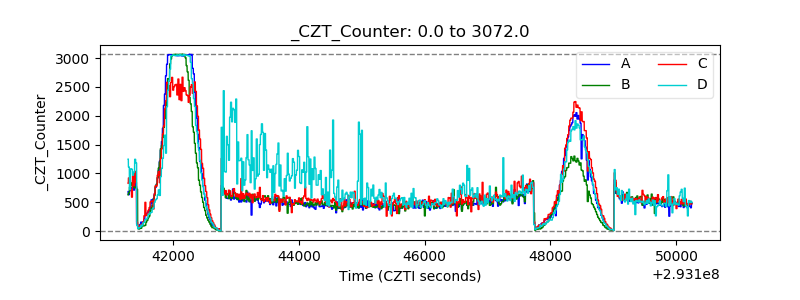 |
| +2.5 Volts monitor | 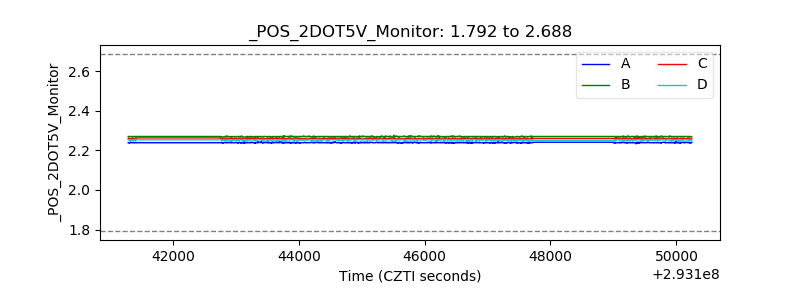 |
| +5 Volts monitor | 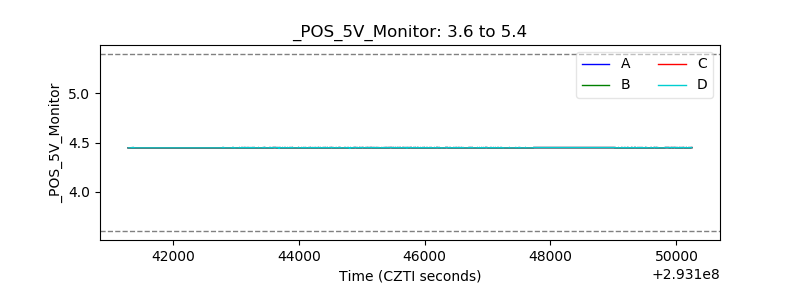 |
| _ROLL_ROT | 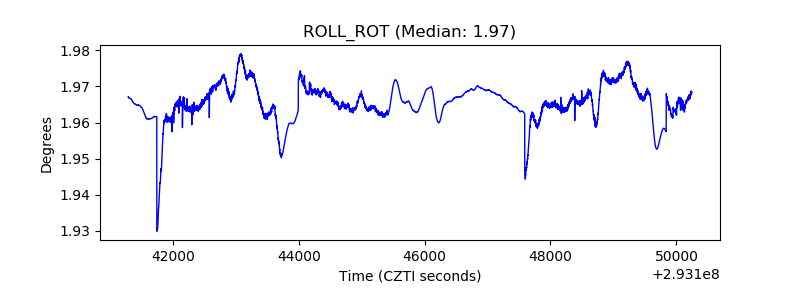 |
| _Roll_DEC |  |
| _Roll_RA | 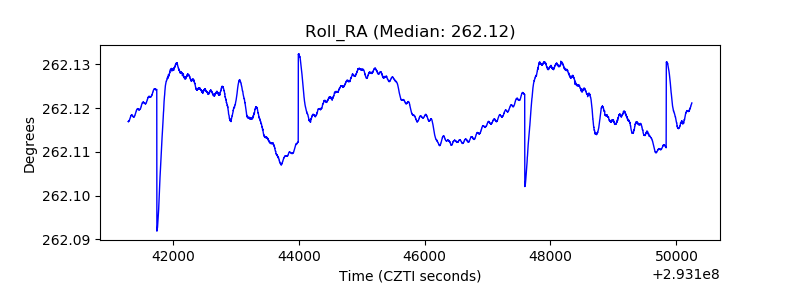 |
| Veto Counter | 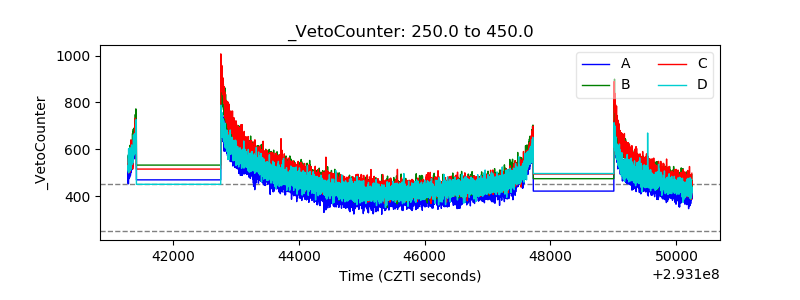 |