| Param | Original file | Final file |
|---|---|---|
| Filename | modeM0/AS1A05_046T01_9000002838_19195cztM0_level2.evt | modeM0/AS1A05_046T01_9000002838_19195cztM0_level2_quad_clean.evt |
| Size (bytes) | 457,992,000 | 99,313,920 |
| Size | 436.8 MB | 94.7 MB |
| Events in quadrant A | 3,122,471 | 637,198 |
| Events in quadrant B | 3,282,722 | 663,605 |
| Events in quadrant C | 3,424,526 | 639,981 |
| Events in quadrant D | 3,600,942 | 615,524 |
| Mode M0 | |||
|---|---|---|---|
| Quadrant | BADHDUFLAG | Total packets | Discarded packets |
| A | 0 | 13450 | 2 |
| B | 0 | 13839 | 2 |
| C | 0 | 13998 | 2 |
| D | 0 | 15056 | 2 |
| Mode SS | |||
|---|---|---|---|
| Quadrant | BADHDUFLAG | Total packets | Discarded packets |
| A | 0 | 130 | 0 |
| B | 0 | 130 | 0 |
| C | 0 | 130 | 0 |
| D | 0 | 130 | 0 |
| Mode M9 | |||
|---|---|---|---|
| Quadrant | BADHDUFLAG | Total packets | Discarded packets |
| A | 0 | 19 | 0 |
| B | 0 | 20 | 0 |
| C | 0 | 20 | 0 |
| D | 0 | 20 | 0 |
| Quadrant | Total seconds | Saturated seconds | Saturation percentage |
|---|---|---|---|
| A | 6477 | 37 | 0.571252% |
| B | 6477 | 66 | 1.018990% |
| C | 6477 | 97 | 1.497607% |
| D | 6477 | 33 | 0.509495% |
Noise dominated data is calculated using 1-second bins in cleaned event files. If a bin has >2000 counts, and if more than 50% of those come from <1% of pixels, then it is considered to be noise-dominated and hence unusable.
| Quadrant | # 1 sec bins | Bins with >0 counts | Bins with >2000 counts | High rate bins dominated by noise | Noise dominated (total time) | Noise dominated (detector-on time) | Marked lightcurve |
|---|---|---|---|---|---|---|---|
| A | 7502 | 6478 | 1 | 1 | 0.01% | 0.02% | 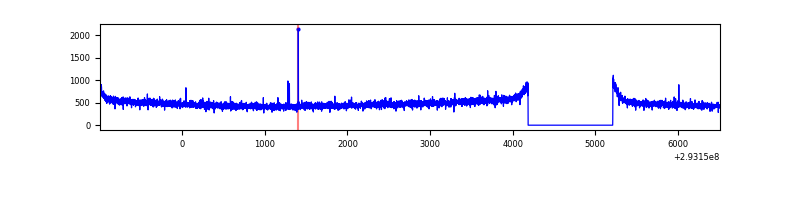 |
| B | 7502 | 6478 | 2 | 2 | 0.03% | 0.03% | 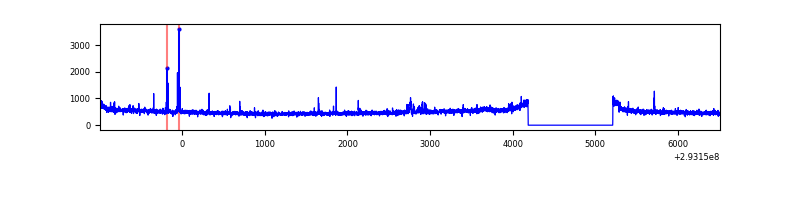 |
| C | 7502 | 6478 | 0 | 0 | 0.00% | 0.00% | 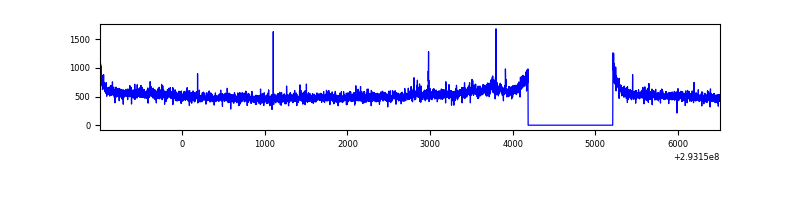 |
| D | 7502 | 6478 | 4 | 4 | 0.05% | 0.06% | 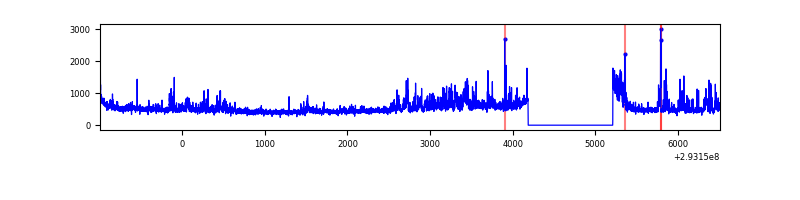 |
Top three noisy pixels from each quadrant. If the there are fewer than three noisy pixels in the level2.evt file, extra rows are filled as -1
| Pixel properties | Quadrant properties | ||||||
|---|---|---|---|---|---|---|---|
| Quadrant | DetID | PixID | Counts | Sigma | Mean | Median | Sigma |
| A | 13 | 254 | 9098 | 50.82 | 808 | 790 | 163.5 |
| A | 0 | 226 | 7038 | 38.22 | 808 | 790 | 163.5 |
| A | 3 | 137 | 6286 | 33.62 | 808 | 790 | 163.5 |
| B | 0 | 189 | 31215 | 193.65 | 818 | 798 | 157.1 |
| B | 4 | 173 | 31050 | 192.6 | 818 | 798 | 157.1 |
| B | 12 | 111 | 18811 | 114.68 | 818 | 798 | 157.1 |
| C | 3 | 233 | 213045 | 1149.88 | 790 | 797 | 184.6 |
| C | 14 | 238 | 123510 | 664.81 | 790 | 797 | 184.6 |
| C | 0 | 207 | 7269 | 35.06 | 790 | 797 | 184.6 |
| D | 10 | 66 | 368173 | 1907.88 | 793 | 772 | 192.6 |
| D | 1 | 52 | 228289 | 1181.48 | 793 | 772 | 192.6 |
| D | 2 | 234 | 26217 | 132.13 | 793 | 772 | 192.6 |
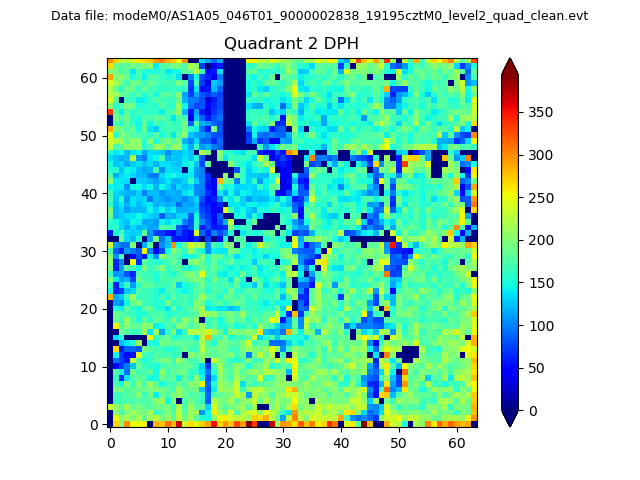
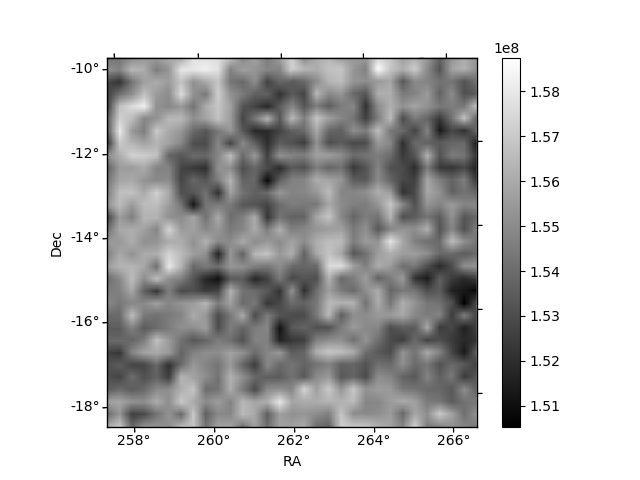
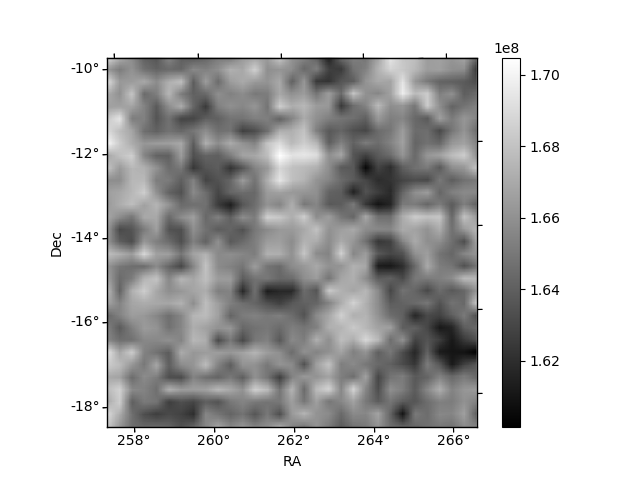
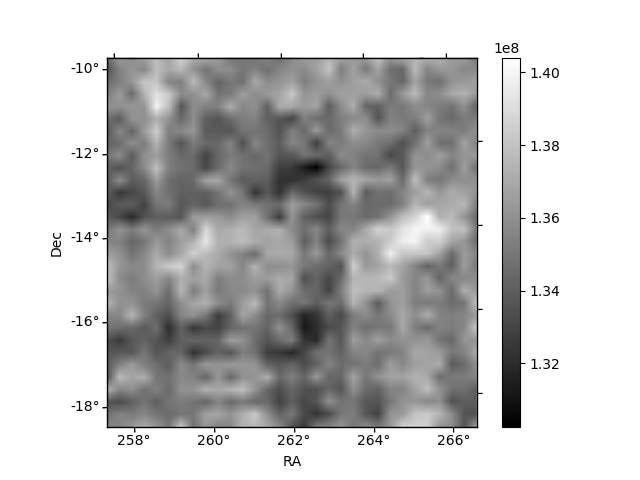
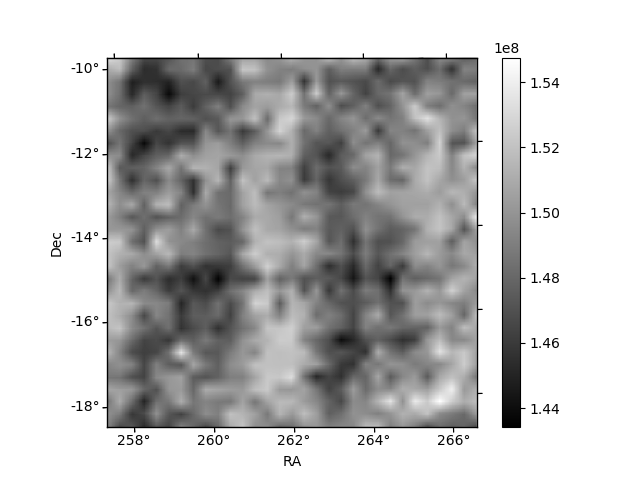
Histogram calculated using DETX and DETY for each event in the final _common_clean file
| Quadrant A |  |
 |
Quadrant B |
|---|---|---|---|
| Quadrant D | 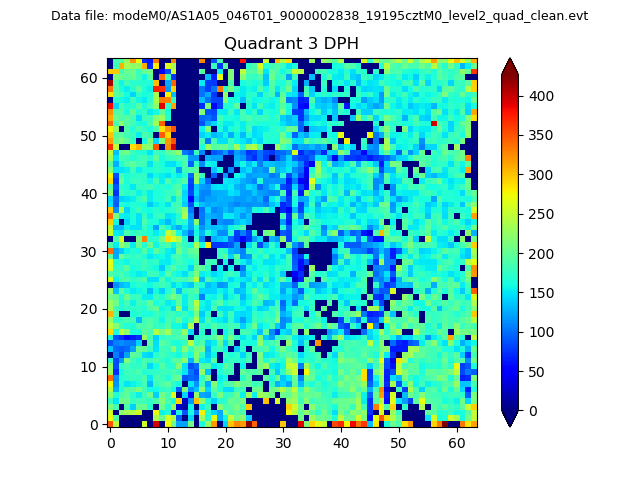 |
 |
Quadrant C |
| Plot type | Count rate plots | Images |
|---|---|---|
| Comparison with Poisson distribution Blue bars denote a histogram of data divided into 1 sec bins. Red curve is a Poisson curve with rate = median count rate of data. |
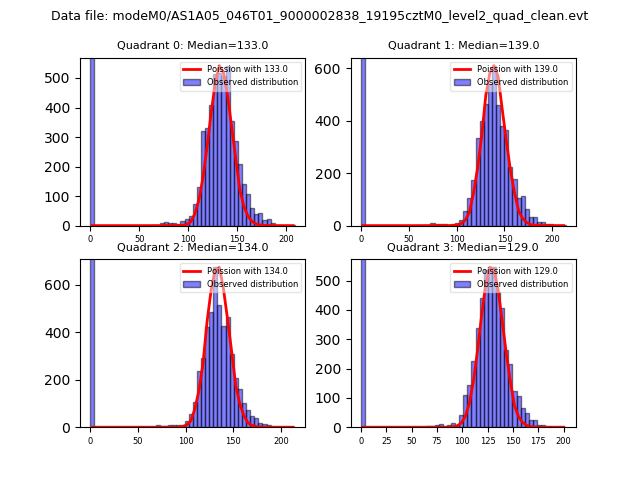 |
 |
| Quadrant-wise count rates Data is divided into 100 sec bins |
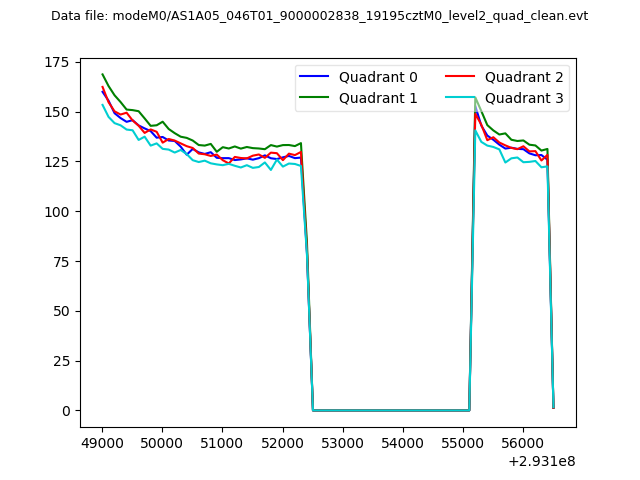 |
|
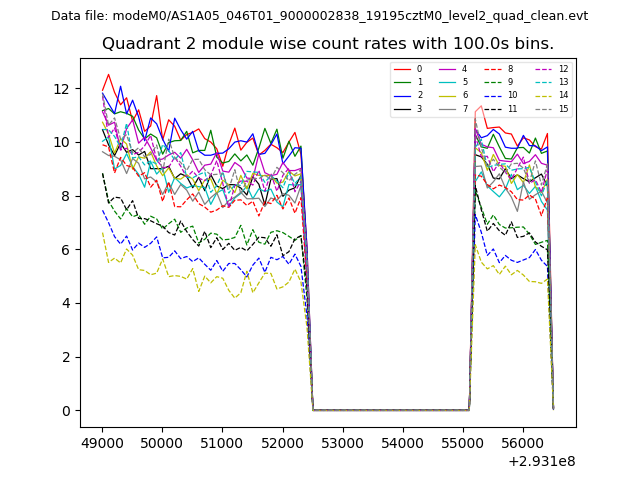
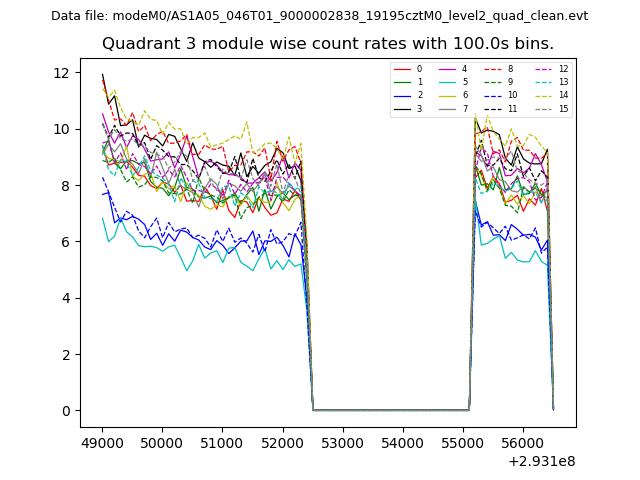
| Module-wise count rates for Quadrant A Data is divided into 100 sec bins |
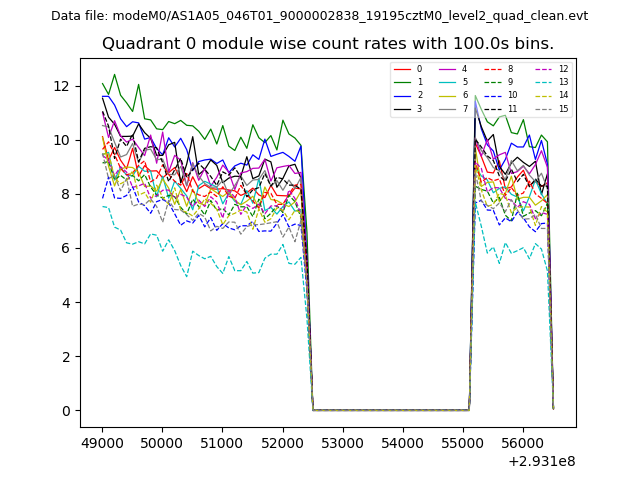 |
 |
| Module-wise count rates for Quadrant B Data is divided into 100 sec bins |
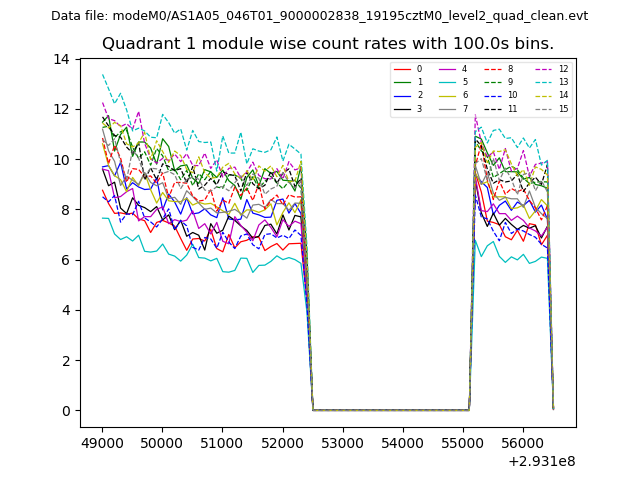 |
 |
| Module-wise count rates for Quadrant C Data is divided into 100 sec bins |
 |
 |
| Module-wise count rates for Quadrant D Data is divided into 100 sec bins |
 |
 |
| Parameter | Plot |
|---|---|
| CZT HV Monitor | 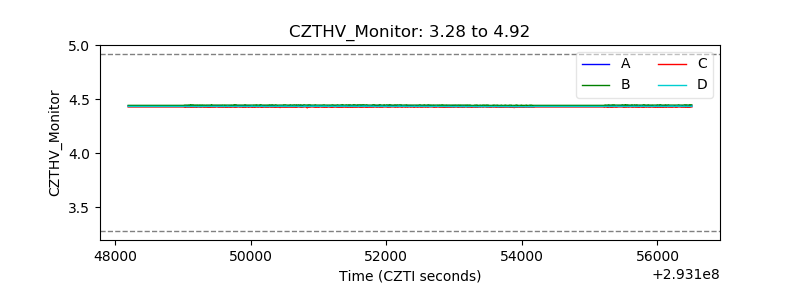 |
| D_VDD | 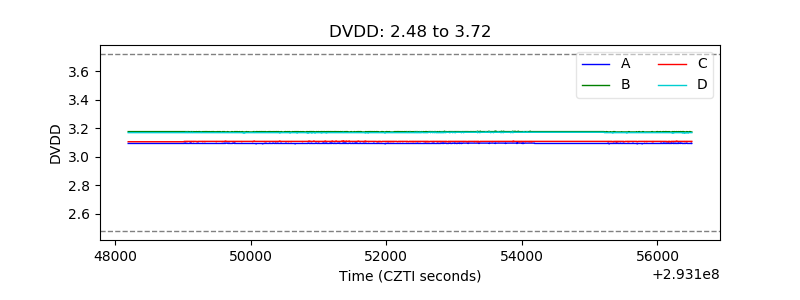 |
| Temperature 1 | 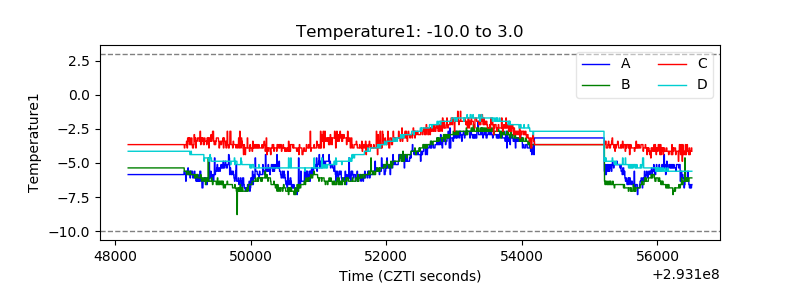 |
| Veto HV Monitor | 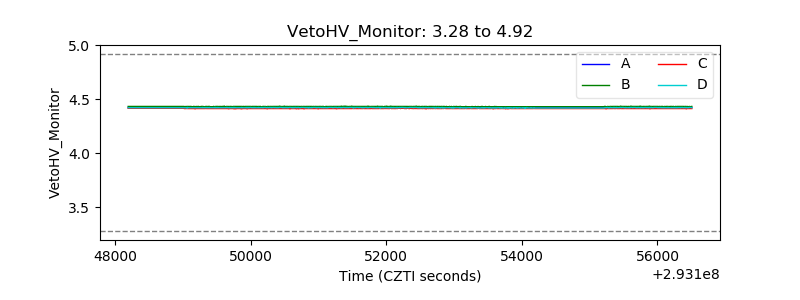 |
| Veto LLD | 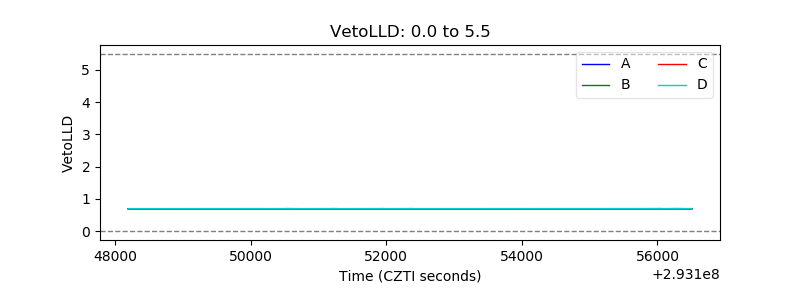 |
| Alpha Counter | 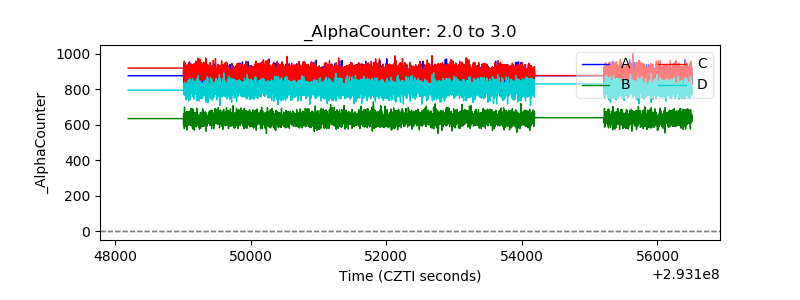 |
| _CPM_Rate |  |
| CZT Counter | 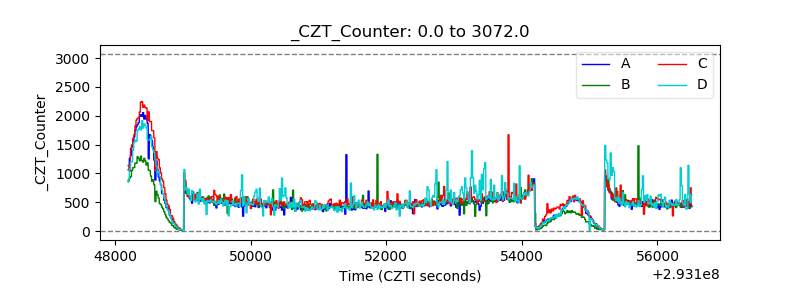 |
| +2.5 Volts monitor | 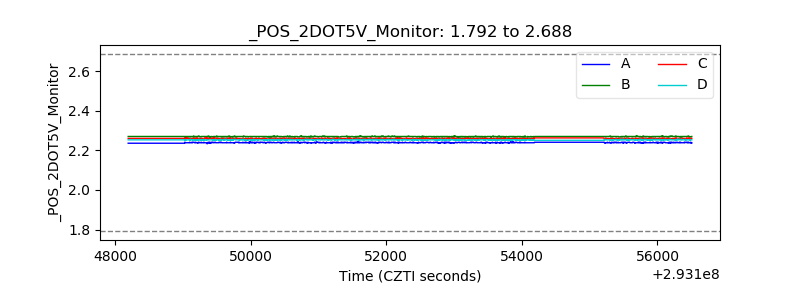 |
| +5 Volts monitor | 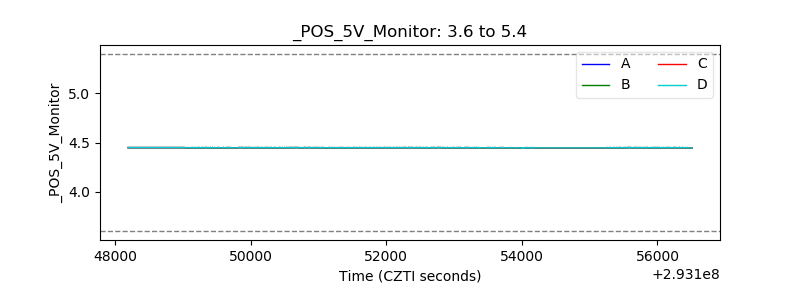 |
| _ROLL_ROT | 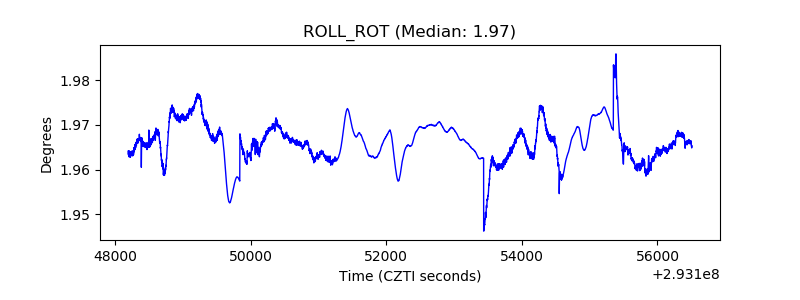 |
| _Roll_DEC | 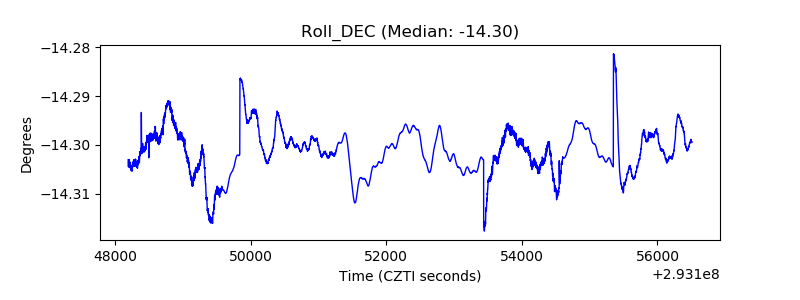 |
| _Roll_RA | 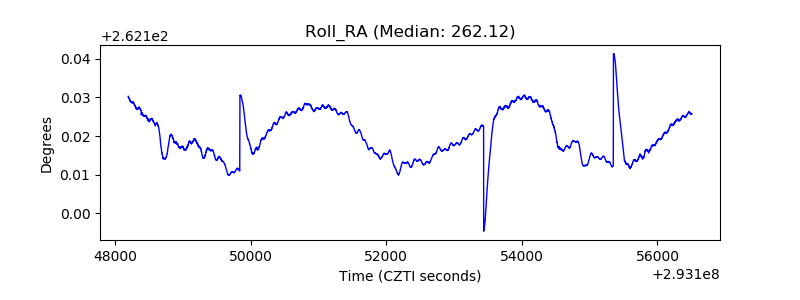 |
| Veto Counter | 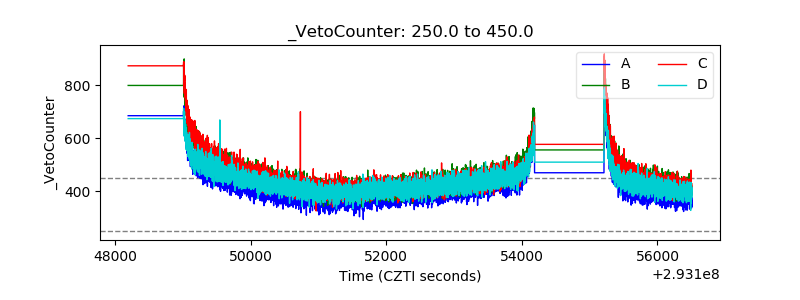 |