| Param | Original file | Final file |
|---|---|---|
| Filename | modeM0/AS1A05_046T01_9000002838_19196cztM0_level2.evt | modeM0/AS1A05_046T01_9000002838_19196cztM0_level2_quad_clean.evt |
| Size (bytes) | 505,848,960 | 98,078,400 |
| Size | 482.4 MB | 93.5 MB |
| Events in quadrant A | 3,357,135 | 618,306 |
| Events in quadrant B | 3,492,090 | 638,683 |
| Events in quadrant C | 3,726,918 | 621,296 |
| Events in quadrant D | 4,263,608 | 599,654 |
| Mode M0 | |||
|---|---|---|---|
| Quadrant | BADHDUFLAG | Total packets | Discarded packets |
| A | 0 | 14624 | 2 |
| B | 0 | 14893 | 2 |
| C | 0 | 15375 | 2 |
| D | 0 | 17376 | 2 |
| Mode SS | |||
|---|---|---|---|
| Quadrant | BADHDUFLAG | Total packets | Discarded packets |
| A | 0 | 142 | 0 |
| B | 0 | 142 | 0 |
| C | 0 | 142 | 0 |
| D | 0 | 142 | 0 |
| Mode M9 | |||
|---|---|---|---|
| Quadrant | BADHDUFLAG | Total packets | Discarded packets |
| A | 0 | 15 | 0 |
| B | 0 | 16 | 0 |
| C | 0 | 16 | 0 |
| D | 0 | 16 | 0 |
| Quadrant | Total seconds | Saturated seconds | Saturation percentage |
|---|---|---|---|
| A | 7073 | 51 | 0.721052% |
| B | 7073 | 98 | 1.385551% |
| C | 7073 | 129 | 1.823837% |
| D | 7073 | 166 | 2.346953% |
Noise dominated data is calculated using 1-second bins in cleaned event files. If a bin has >2000 counts, and if more than 50% of those come from <1% of pixels, then it is considered to be noise-dominated and hence unusable.
| Quadrant | # 1 sec bins | Bins with >0 counts | Bins with >2000 counts | High rate bins dominated by noise | Noise dominated (total time) | Noise dominated (detector-on time) | Marked lightcurve |
|---|---|---|---|---|---|---|---|
| A | 7713 | 7074 | 0 | 0 | 0.00% | 0.00% | 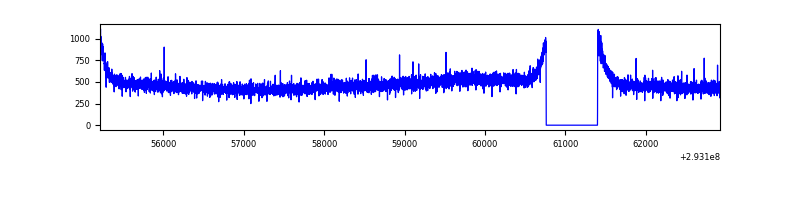 |
| B | 7713 | 7074 | 0 | 0 | 0.00% | 0.00% | 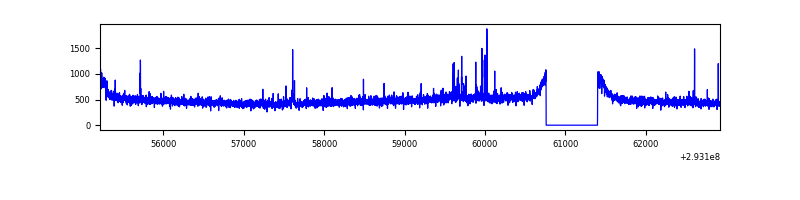 |
| C | 7713 | 7074 | 0 | 0 | 0.00% | 0.00% | 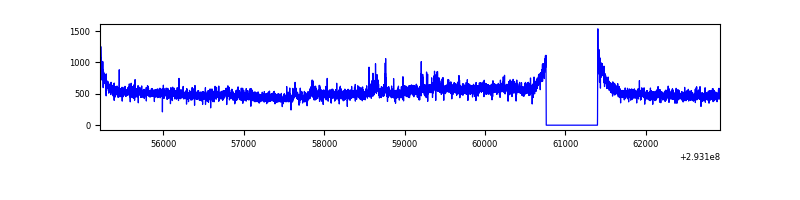 |
| D | 7713 | 7074 | 65 | 65 | 0.84% | 0.92% | 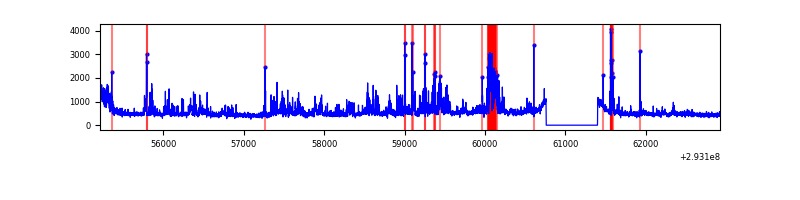 |
Top three noisy pixels from each quadrant. If the there are fewer than three noisy pixels in the level2.evt file, extra rows are filled as -1
| Pixel properties | Quadrant properties | ||||||
|---|---|---|---|---|---|---|---|
| Quadrant | DetID | PixID | Counts | Sigma | Mean | Median | Sigma |
| A | 11 | 29 | 9986 | 51.99 | 868 | 849 | 175.7 |
| A | 13 | 254 | 9591 | 49.75 | 868 | 849 | 175.7 |
| A | 0 | 226 | 7448 | 37.55 | 868 | 849 | 175.7 |
| B | 7 | 220 | 26240 | 149.09 | 874 | 851 | 170.3 |
| B | 12 | 111 | 20480 | 115.27 | 874 | 851 | 170.3 |
| B | 0 | 189 | 19975 | 112.3 | 874 | 851 | 170.3 |
| C | 3 | 233 | 286074 | 1421.37 | 848 | 853 | 200.7 |
| C | 14 | 238 | 131303 | 650.09 | 848 | 853 | 200.7 |
| C | 13 | 61 | 5865 | 24.98 | 848 | 853 | 200.7 |
| D | 1 | 52 | 663378 | 3164.85 | 851 | 826 | 209.3 |
| D | 10 | 66 | 276164 | 1315.22 | 851 | 826 | 209.3 |
| D | 11 | 176 | 92473 | 437.78 | 851 | 826 | 209.3 |
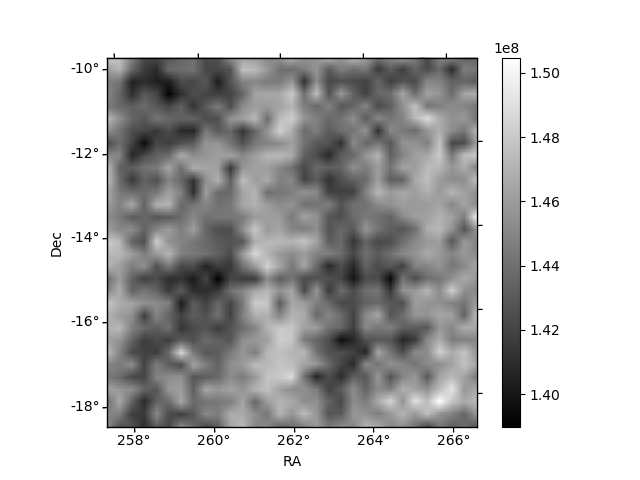
Histogram calculated using DETX and DETY for each event in the final _common_clean file
| Quadrant A | 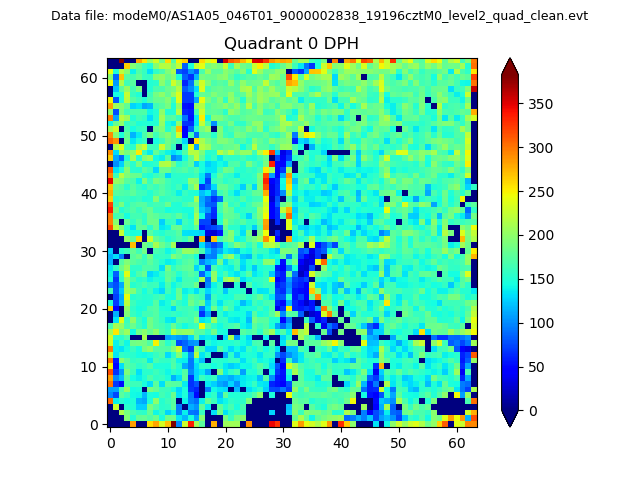 |
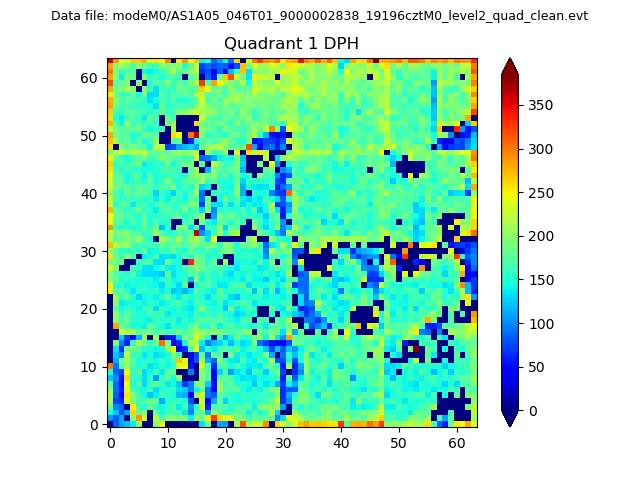 |
Quadrant B |
|---|---|---|---|
| Quadrant D |  |
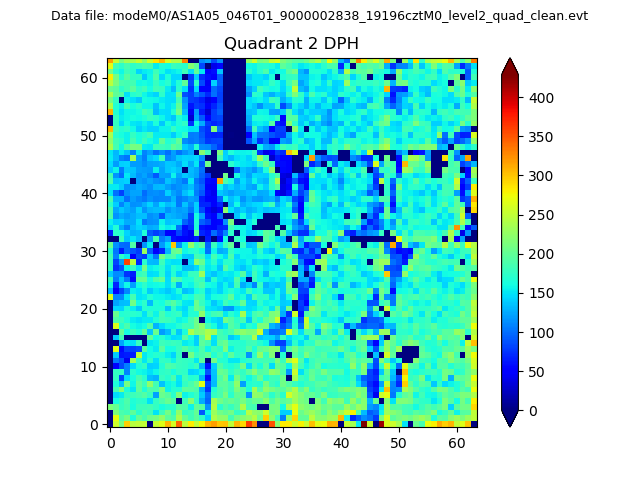 |
Quadrant C |
| Plot type | Count rate plots | Images |
|---|---|---|
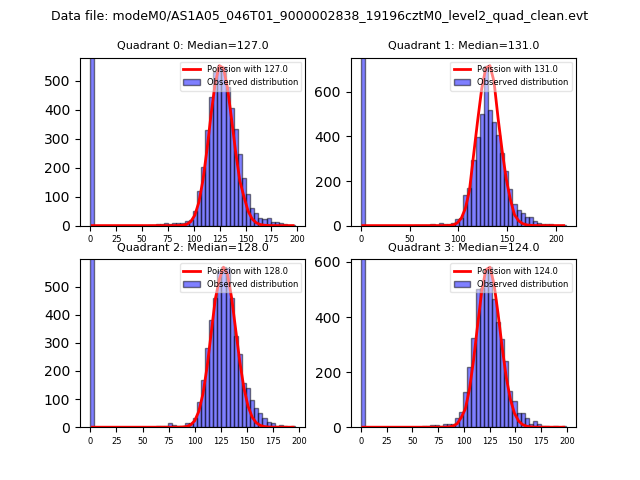
| Comparison with Poisson distribution Blue bars denote a histogram of data divided into 1 sec bins. Red curve is a Poisson curve with rate = median count rate of data. |
 |
 |
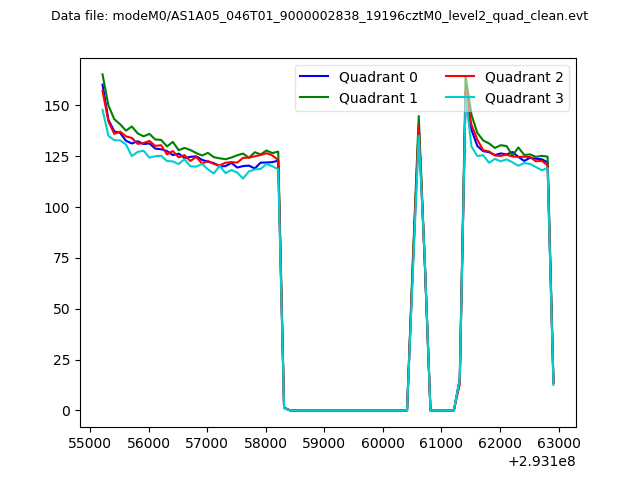
| Quadrant-wise count rates Data is divided into 100 sec bins |
 |
|
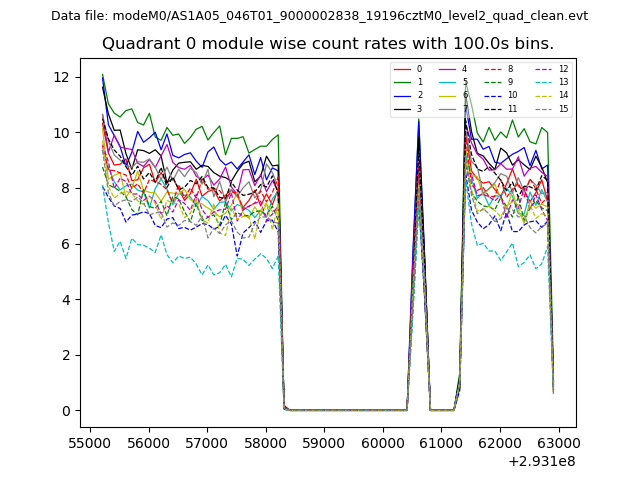
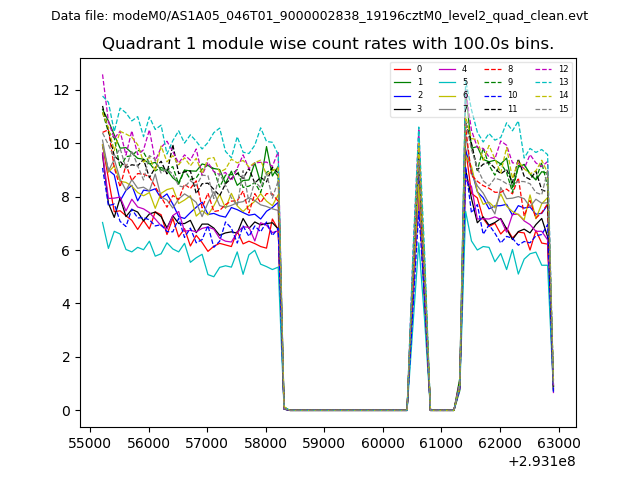
| Module-wise count rates for Quadrant A Data is divided into 100 sec bins |
 |
 |
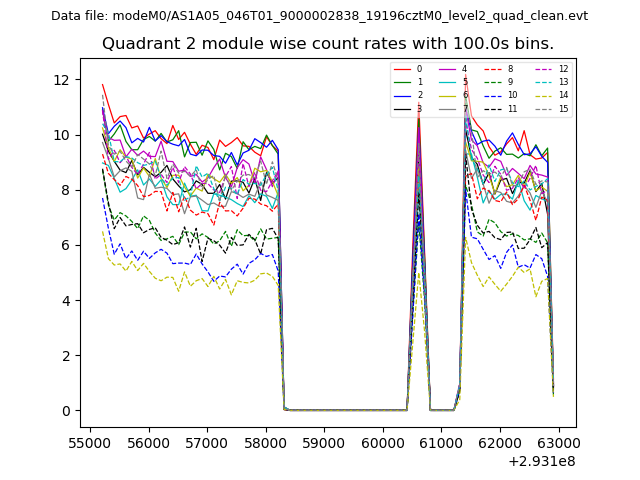
| Module-wise count rates for Quadrant B Data is divided into 100 sec bins |
 |
 |
| Module-wise count rates for Quadrant C Data is divided into 100 sec bins |
 |
 |
| Module-wise count rates for Quadrant D Data is divided into 100 sec bins |
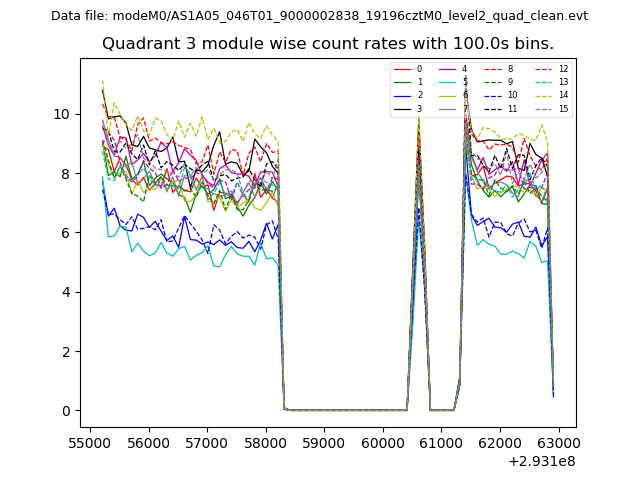 |
 |
| Parameter | Plot |
|---|---|
| CZT HV Monitor | 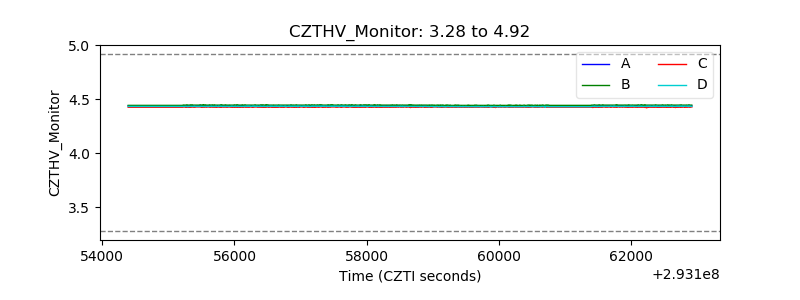 |
| D_VDD | 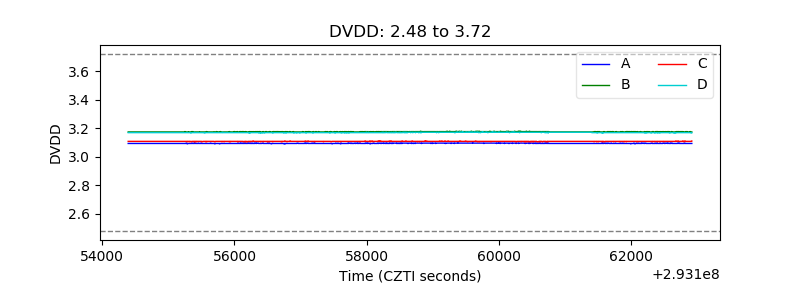 |
| Temperature 1 | 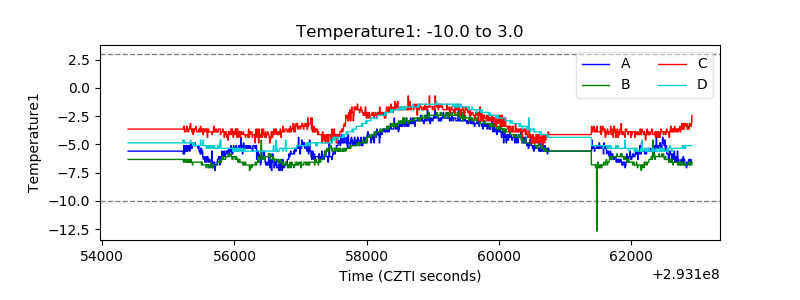 |
| Veto HV Monitor |  |
| Veto LLD | 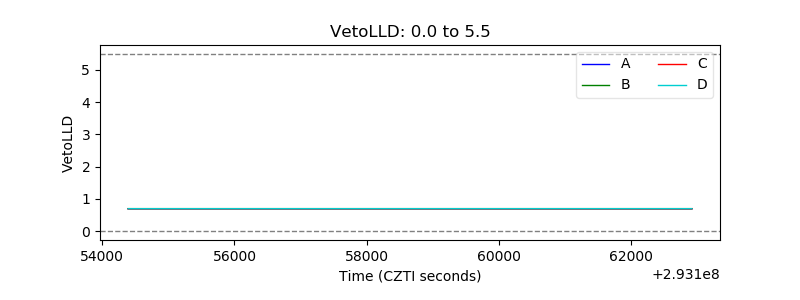 |
| Alpha Counter | 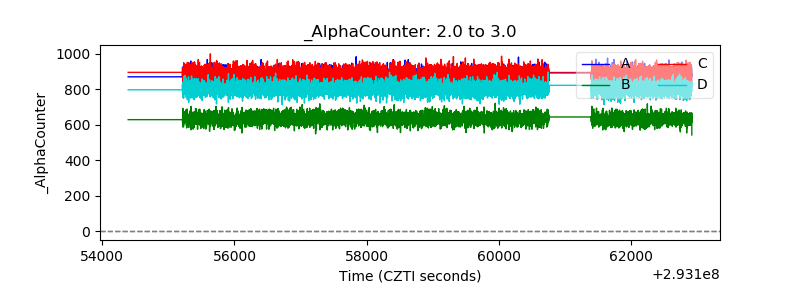 |
| _CPM_Rate | 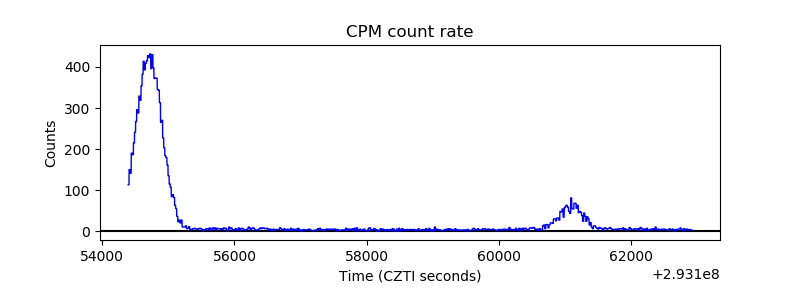 |
| CZT Counter | 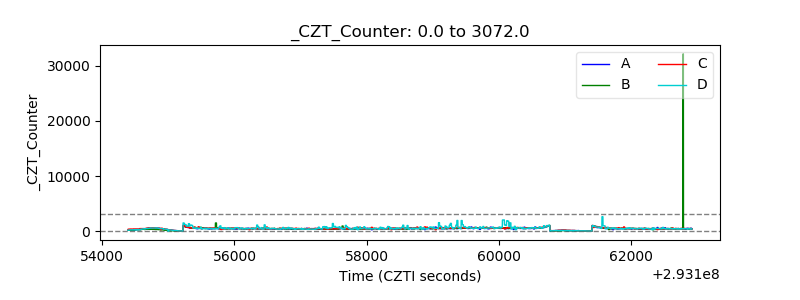 |
| +2.5 Volts monitor | 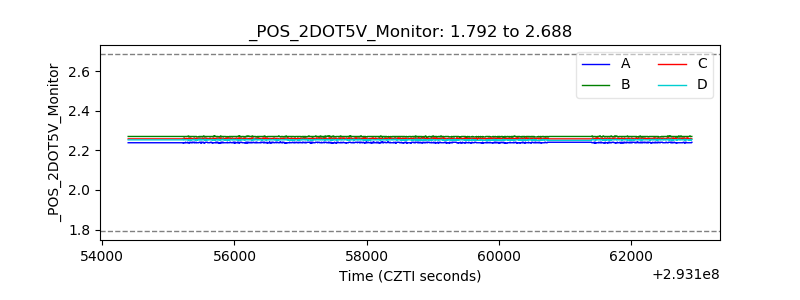 |
| +5 Volts monitor |  |
| _ROLL_ROT | 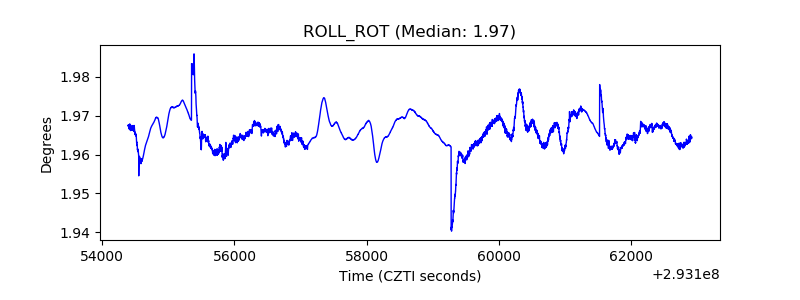 |
| _Roll_DEC | 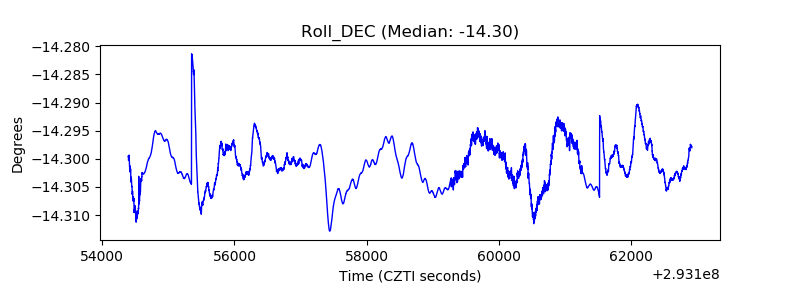 |
| _Roll_RA | 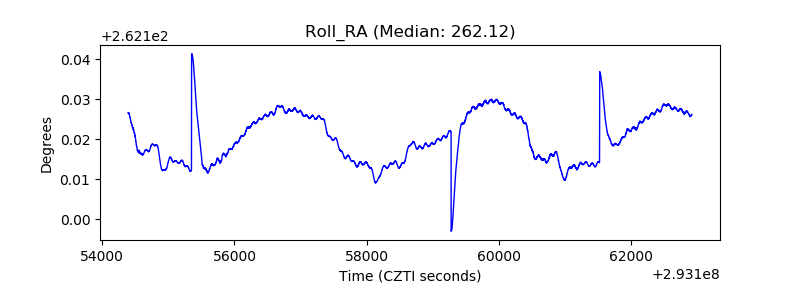 |
| Veto Counter | 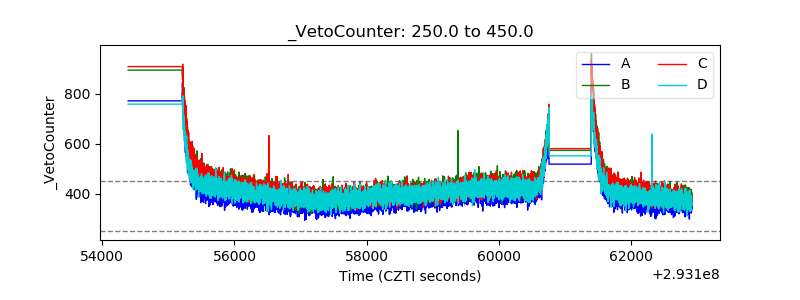 |