| Param | Original file | Final file |
|---|---|---|
| Filename | modeM0/AS1A05_046T01_9000002838_19198cztM0_level2.evt | modeM0/AS1A05_046T01_9000002838_19198cztM0_level2_quad_clean.evt |
| Size (bytes) | 408,277,440 | 66,761,280 |
| Size | 389.4 MB | 63.7 MB |
| Events in quadrant A | 3,592,779 | 398,592 |
| Events in quadrant B | 2,662,487 | 423,281 |
| Events in quadrant C | 2,826,125 | 409,520 |
| Events in quadrant D | 2,906,179 | 402,108 |
| Mode M0 | |||
|---|---|---|---|
| Quadrant | BADHDUFLAG | Total packets | Discarded packets |
| A | 0 | 23285 | 8818 |
| B | 0 | 17368 | 5911 |
| C | 0 | 18485 | 6719 |
| D | 0 | 18581 | 6258 |
| Mode SS | |||
|---|---|---|---|
| Quadrant | BADHDUFLAG | Total packets | Discarded packets |
| A | 0 | 139758944131976 | 46 |
| B | 0 | -1 | -1 |
| C | 0 | -1 | -1 |
| D | 0 | -1 | -1 |
| Mode M9 | |||
|---|---|---|---|
| Quadrant | BADHDUFLAG | Total packets | Discarded packets |
| A | 0 | 9 | 2 |
| B | 0 | 9 | 2 |
| C | 0 | 9 | 1 |
| D | 0 | 9 | 2 |
| Quadrant | Total seconds | Saturated seconds | Saturation percentage |
|---|---|---|---|
| A | 5279 | 60 | 1.136579% |
| B | 5417 | 82 | 1.513753% |
| C | 5411 | 85 | 1.570874% |
| D | 5409 | 64 | 1.183213% |
Noise dominated data is calculated using 1-second bins in cleaned event files. If a bin has >2000 counts, and if more than 50% of those come from <1% of pixels, then it is considered to be noise-dominated and hence unusable.
| Quadrant | # 1 sec bins | Bins with >0 counts | Bins with >2000 counts | High rate bins dominated by noise | Noise dominated (total time) | Noise dominated (detector-on time) | Marked lightcurve |
|---|---|---|---|---|---|---|---|
| A | 8658 | 5524 | 0 | 0 | 0.00% | 0.00% | 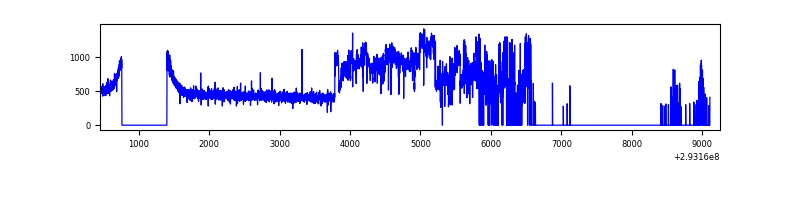 |
| B | 8675 | 5673 | 5 | 5 | 0.06% | 0.09% | 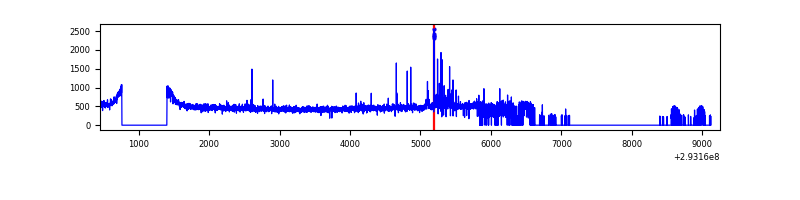 |
| C | 8589 | 5662 | 0 | 0 | 0.00% | 0.00% | 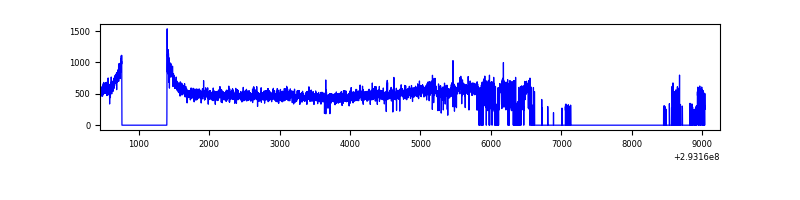 |
| D | 8801 | 5681 | 20 | 20 | 0.23% | 0.35% | 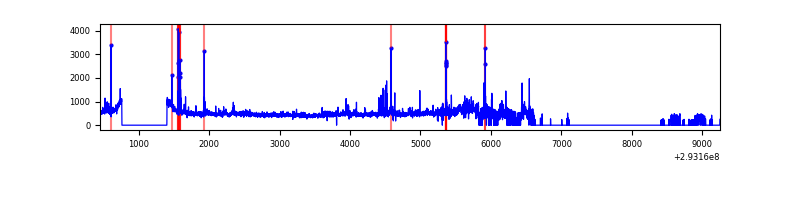 |
Top three noisy pixels from each quadrant. If the there are fewer than three noisy pixels in the level2.evt file, extra rows are filled as -1
| Pixel properties | Quadrant properties | ||||||
|---|---|---|---|---|---|---|---|
| Quadrant | DetID | PixID | Counts | Sigma | Mean | Median | Sigma |
| A | 8 | 192 | 1098569 | 8428.42 | 636 | 623 | 130.3 |
| A | 8 | 144 | 37906 | 286.2 | 636 | 623 | 130.3 |
| A | 13 | 254 | 8203 | 58.19 | 636 | 623 | 130.3 |
| B | 7 | 220 | 53742 | 415.76 | 655 | 637 | 127.7 |
| B | 12 | 111 | 15589 | 117.06 | 655 | 637 | 127.7 |
| B | 11 | 111 | 13534 | 100.97 | 655 | 637 | 127.7 |
| C | 3 | 233 | 249210 | 1641.45 | 635 | 638 | 151.4 |
| C | 14 | 238 | 98985 | 649.44 | 635 | 638 | 151.4 |
| C | 13 | 61 | 4463 | 25.26 | 635 | 638 | 151.4 |
| D | 10 | 66 | 319021 | 2025.36 | 641 | 623 | 157.2 |
| D | 11 | 176 | 148502 | 940.67 | 641 | 623 | 157.2 |
| D | 2 | 234 | 21778 | 134.57 | 641 | 623 | 157.2 |
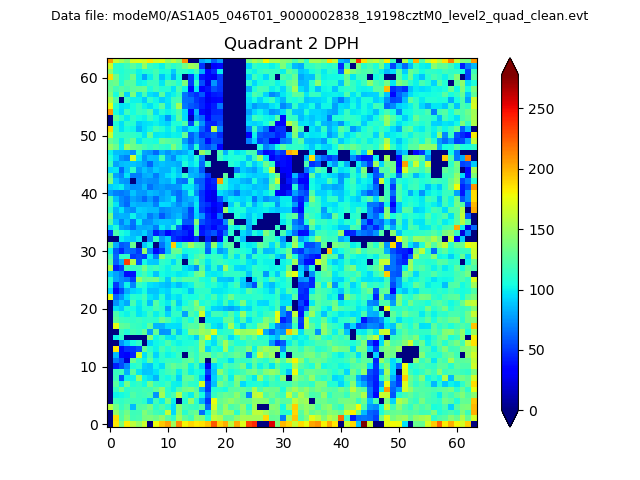
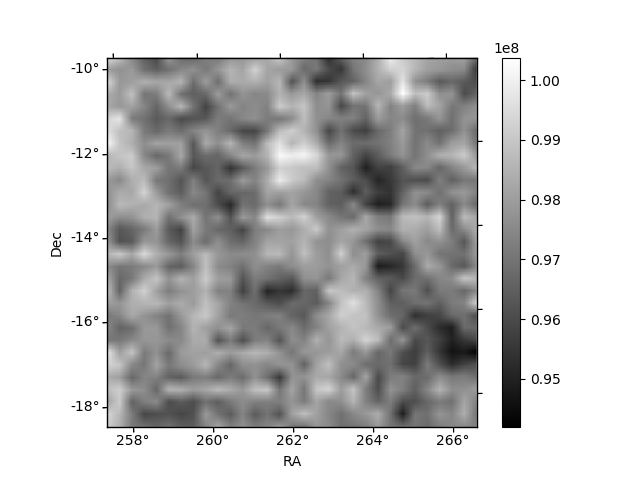
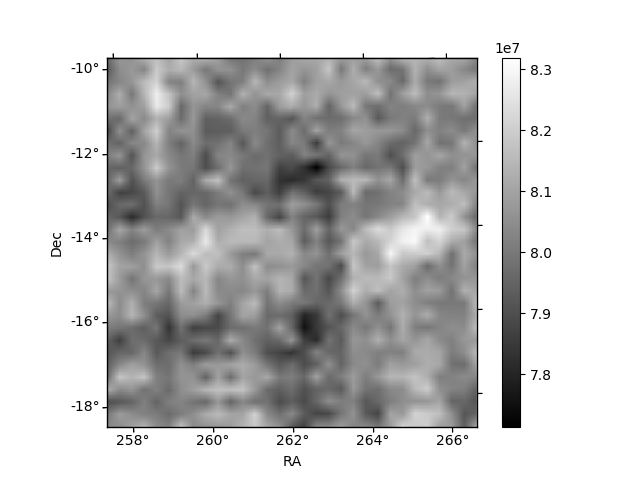
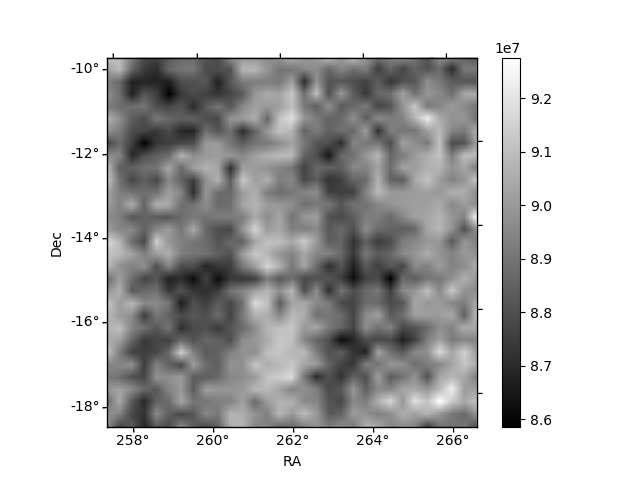
Histogram calculated using DETX and DETY for each event in the final _common_clean file
| Quadrant A | 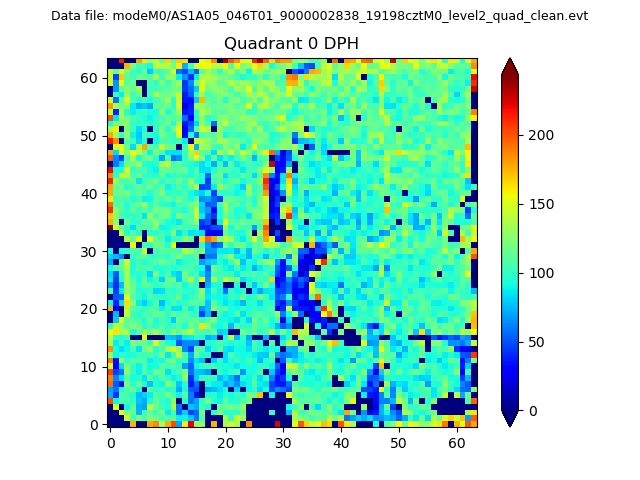 |
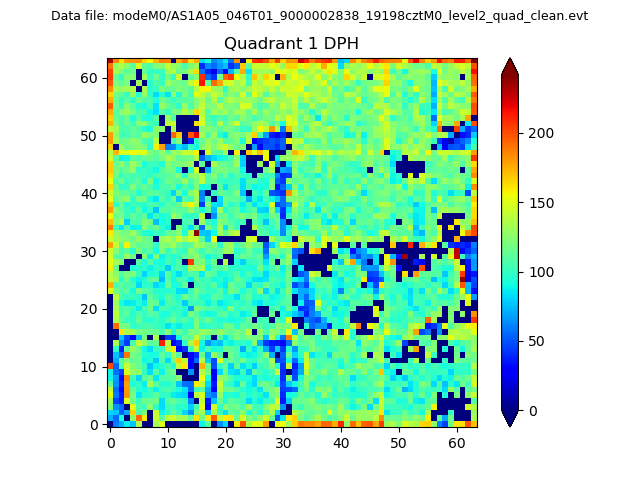 |
Quadrant B |
|---|---|---|---|
| Quadrant D | 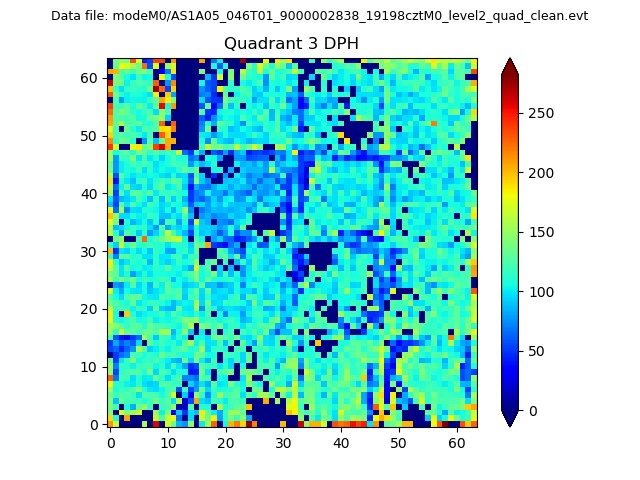 |
 |
Quadrant C |
| Plot type | Count rate plots | Images |
|---|---|---|
| Comparison with Poisson distribution Blue bars denote a histogram of data divided into 1 sec bins. Red curve is a Poisson curve with rate = median count rate of data. |
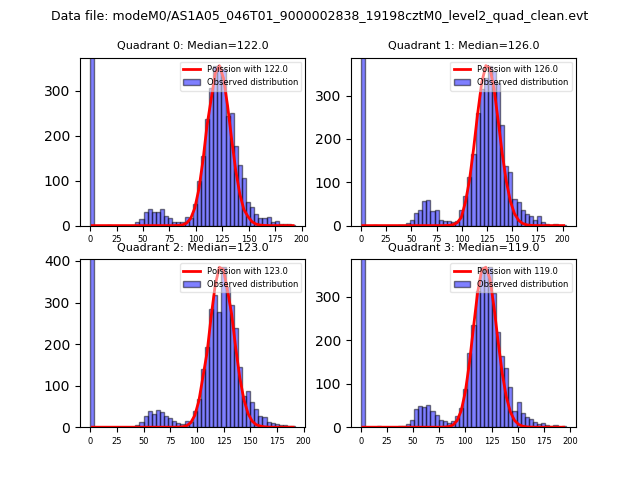 |
 |
| Quadrant-wise count rates Data is divided into 100 sec bins |
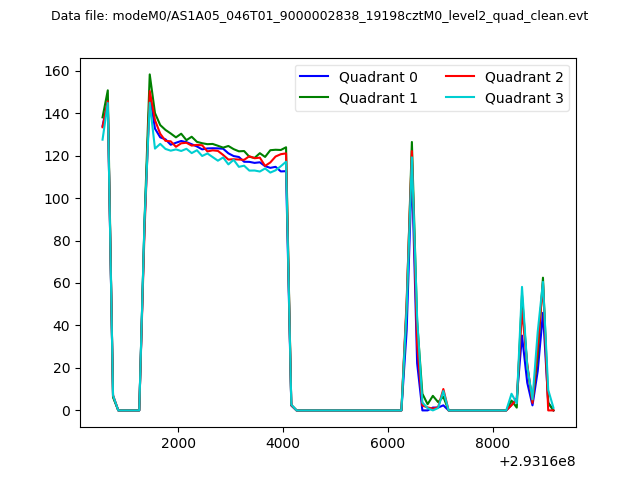 |
|
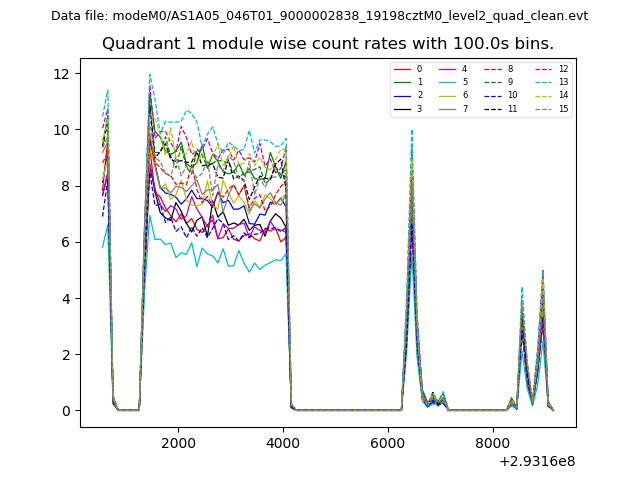
| Module-wise count rates for Quadrant A Data is divided into 100 sec bins |
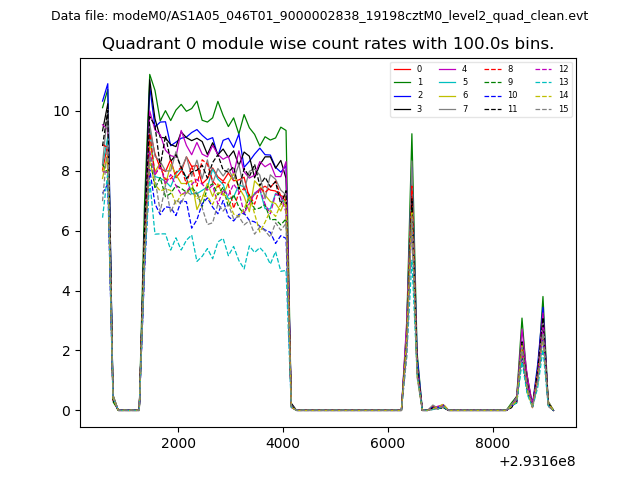 |
 |
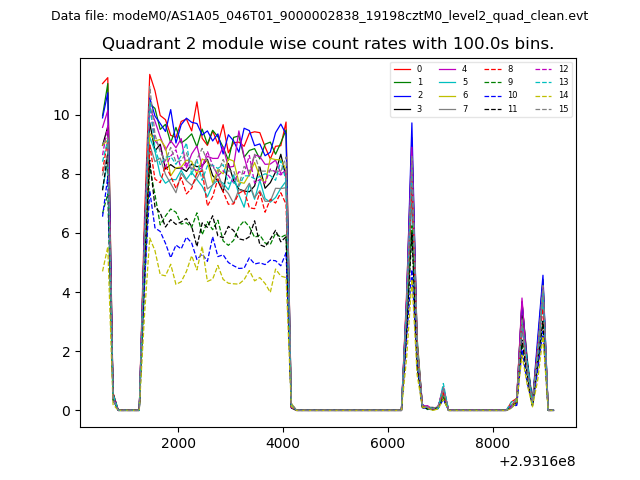
| Module-wise count rates for Quadrant B Data is divided into 100 sec bins |
 |
 |
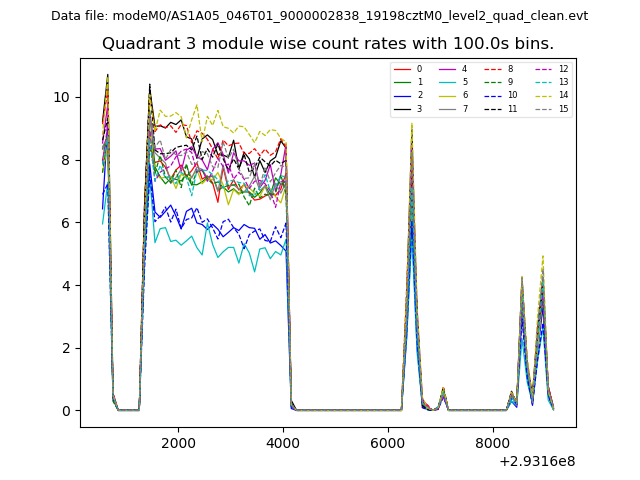
| Module-wise count rates for Quadrant C Data is divided into 100 sec bins |
 |
 |
| Module-wise count rates for Quadrant D Data is divided into 100 sec bins |
 |
 |
| Parameter | Plot |
|---|---|
| CZT HV Monitor | 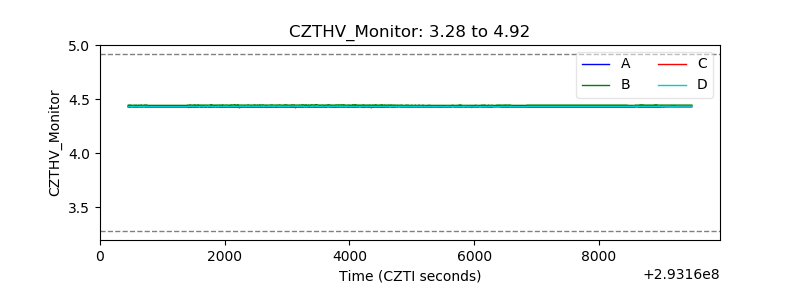 |
| D_VDD | 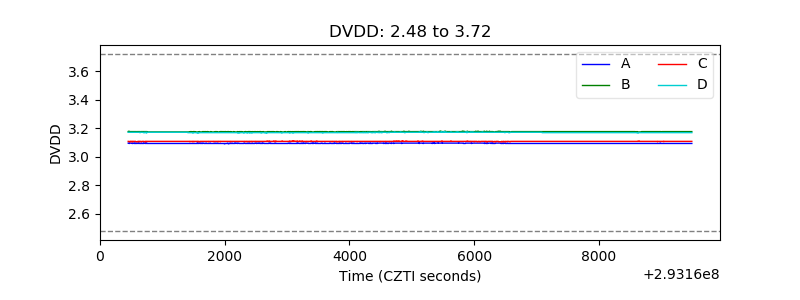 |
| Temperature 1 | 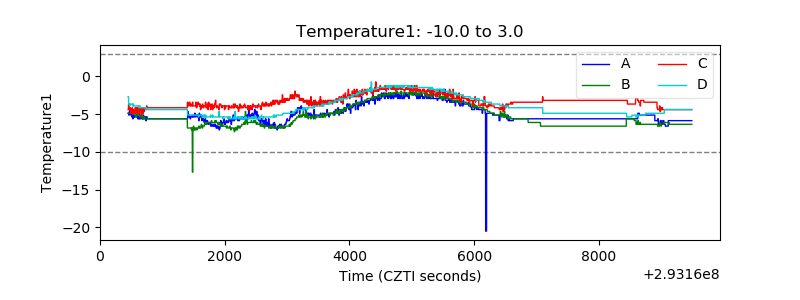 |
| Veto HV Monitor | 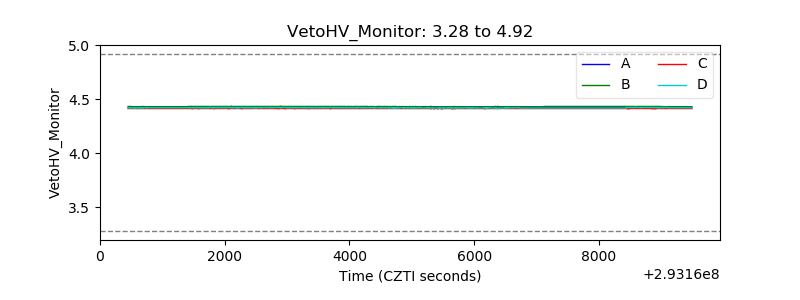 |
| Veto LLD | 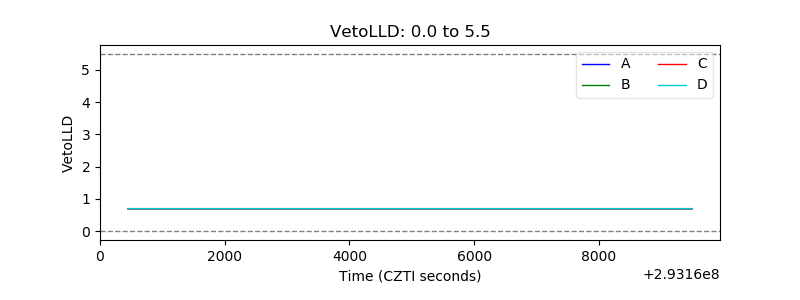 |
| Alpha Counter | 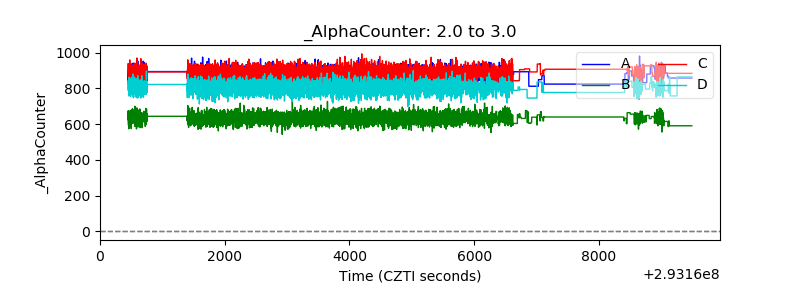 |
| _CPM_Rate | 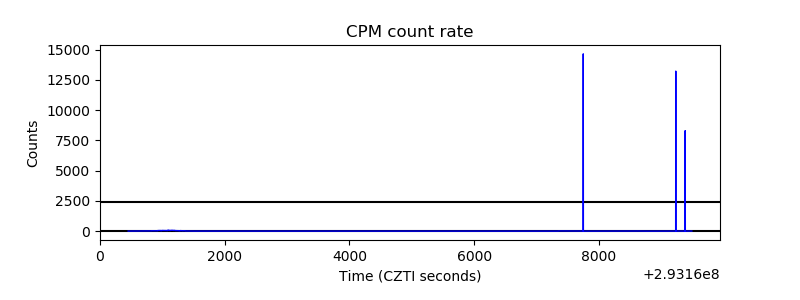 |
| CZT Counter | 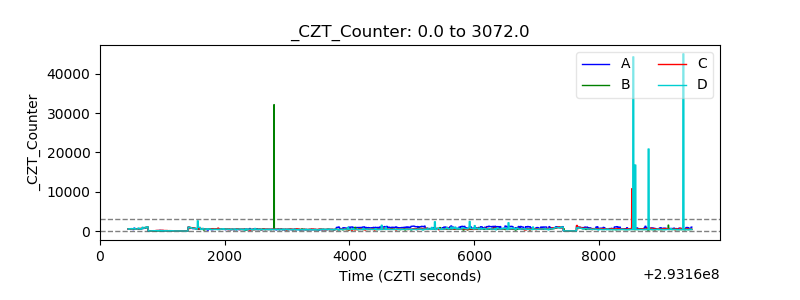 |
| +2.5 Volts monitor |  |
| +5 Volts monitor |  |
| _ROLL_ROT | 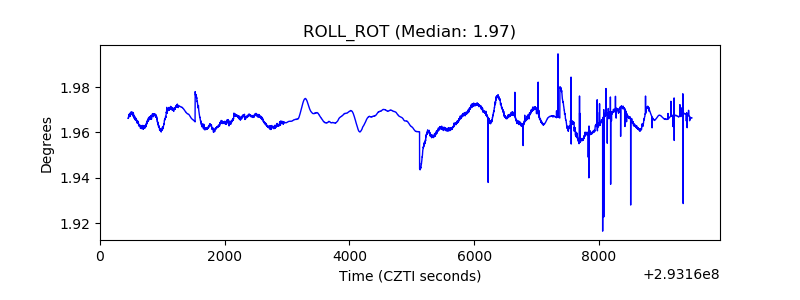 |
| _Roll_DEC | 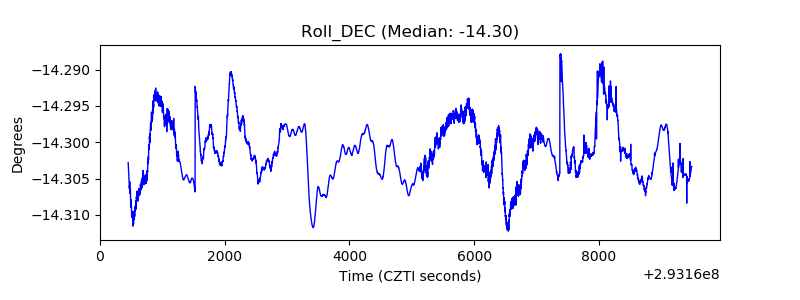 |
| _Roll_RA |  |
| Veto Counter | 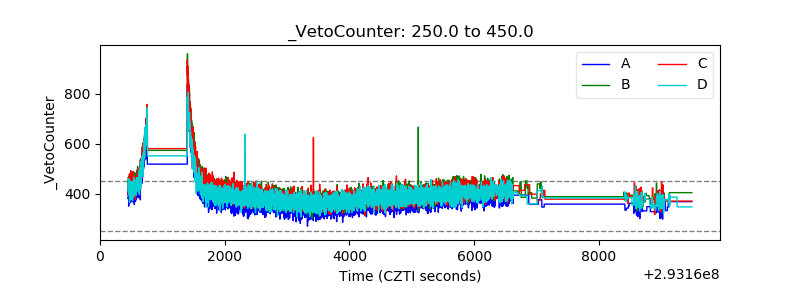 |