| Param | Original file | Final file |
|---|---|---|
| Filename | modeM0/AS1A05_046T01_9000002838_19201cztM0_level2.evt | modeM0/AS1A05_046T01_9000002838_19201cztM0_level2_quad_clean.evt |
| Size (bytes) | 1,494,558,720 | 223,194,240 |
| Size | 1.4 GB | 212.9 MB |
| Events in quadrant A | 14,402,848 | 1,351,091 |
| Events in quadrant B | 9,382,037 | 1,413,905 |
| Events in quadrant C | 10,977,539 | 1,360,791 |
| Events in quadrant D | 9,230,634 | 1,336,326 |
| Mode M0 | |||
|---|---|---|---|
| Quadrant | BADHDUFLAG | Total packets | Discarded packets |
| A | 0 | 55886 | 4 |
| B | 0 | 39686 | 3 |
| C | 0 | 44401 | 3 |
| D | 0 | 40052 | 3 |
| Mode SS | |||
|---|---|---|---|
| Quadrant | BADHDUFLAG | Total packets | Discarded packets |
| A | 0 | 384 | 0 |
| B | 0 | 384 | 0 |
| C | 0 | 384 | 0 |
| D | 0 | 384 | 0 |
| Mode M9 | |||
|---|---|---|---|
| Quadrant | BADHDUFLAG | Total packets | Discarded packets |
| A | 0 | 17 | 0 |
| B | 0 | 17 | 0 |
| C | 0 | 17 | 0 |
| D | 0 | 17 | 0 |
| Quadrant | Total seconds | Saturated seconds | Saturation percentage |
|---|---|---|---|
| A | 18825 | 384 | 2.039841% |
| B | 18825 | 316 | 1.678619% |
| C | 18825 | 390 | 2.071713% |
| D | 18825 | 224 | 1.189907% |
Noise dominated data is calculated using 1-second bins in cleaned event files. If a bin has >2000 counts, and if more than 50% of those come from <1% of pixels, then it is considered to be noise-dominated and hence unusable.
| Quadrant | # 1 sec bins | Bins with >0 counts | Bins with >2000 counts | High rate bins dominated by noise | Noise dominated (total time) | Noise dominated (detector-on time) | Marked lightcurve |
|---|---|---|---|---|---|---|---|
| A | 20535 | 18825 | 0 | 0 | 0.00% | 0.00% | 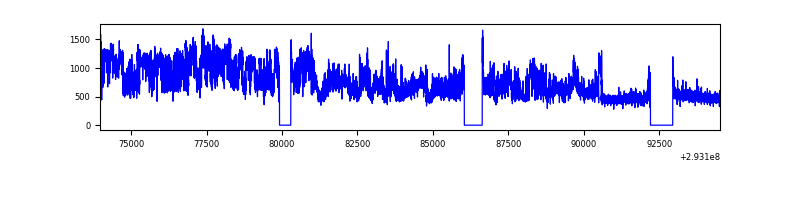 |
| B | 20535 | 18827 | 30 | 30 | 0.15% | 0.16% | 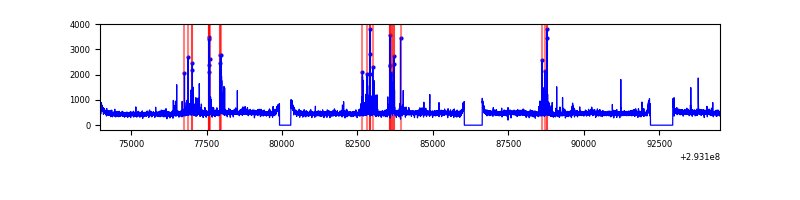 |
| C | 20535 | 18827 | 2 | 2 | 0.01% | 0.01% | 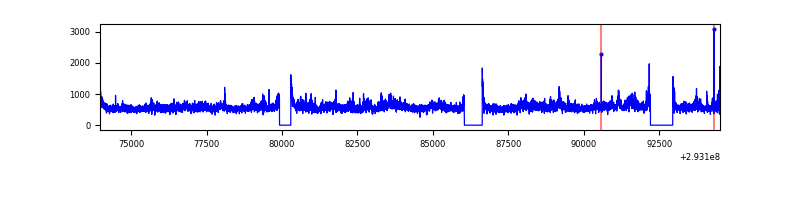 |
| D | 20535 | 18827 | 44 | 44 | 0.21% | 0.23% | 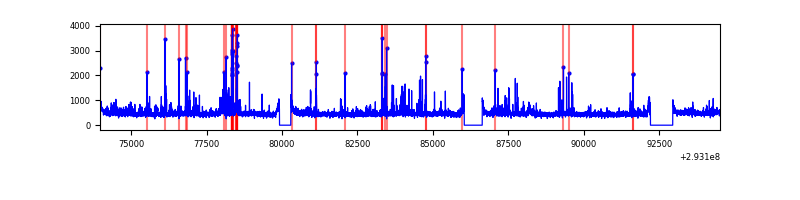 |
Top three noisy pixels from each quadrant. If the there are fewer than three noisy pixels in the level2.evt file, extra rows are filled as -1
| Pixel properties | Quadrant properties | ||||||
|---|---|---|---|---|---|---|---|
| Quadrant | DetID | PixID | Counts | Sigma | Mean | Median | Sigma |
| A | 8 | 192 | 5651441 | 12476.8 | 2248 | 2197 | 452.8 |
| A | 8 | 144 | 60109 | 127.9 | 2248 | 2197 | 452.8 |
| A | 13 | 254 | 26400 | 53.45 | 2248 | 2197 | 452.8 |
| B | 7 | 220 | 259045 | 589.01 | 2260 | 2195 | 436.1 |
| B | 6 | 36 | 69881 | 155.22 | 2260 | 2195 | 436.1 |
| B | 0 | 197 | 69469 | 154.27 | 2260 | 2195 | 436.1 |
| C | 3 | 233 | 2090572 | 4083.75 | 2183 | 2194 | 511.4 |
| C | 14 | 238 | 337009 | 654.72 | 2183 | 2194 | 511.4 |
| C | 0 | 207 | 21603 | 37.95 | 2183 | 2194 | 511.4 |
| D | 10 | 66 | 274636 | 506.57 | 2218 | 2151 | 537.9 |
| D | 9 | 68 | 204463 | 376.11 | 2218 | 2151 | 537.9 |
| D | 11 | 176 | 112969 | 206.02 | 2218 | 2151 | 537.9 |
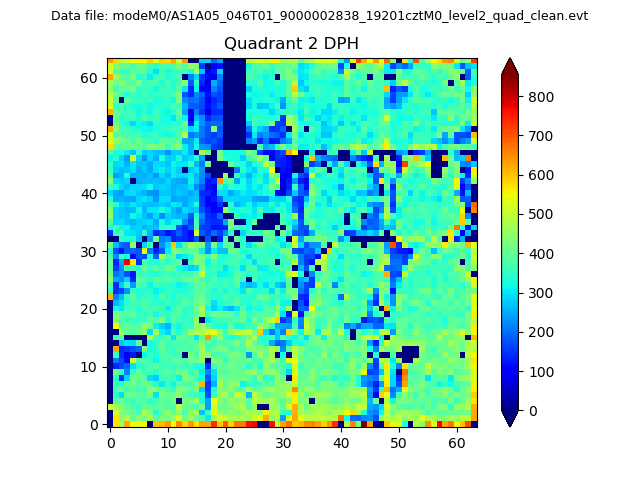
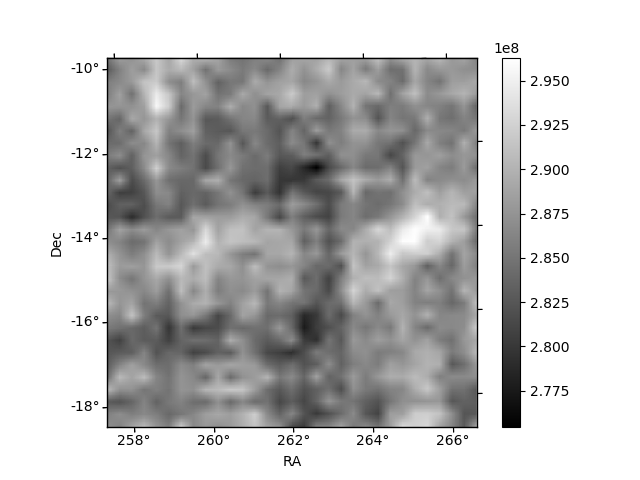
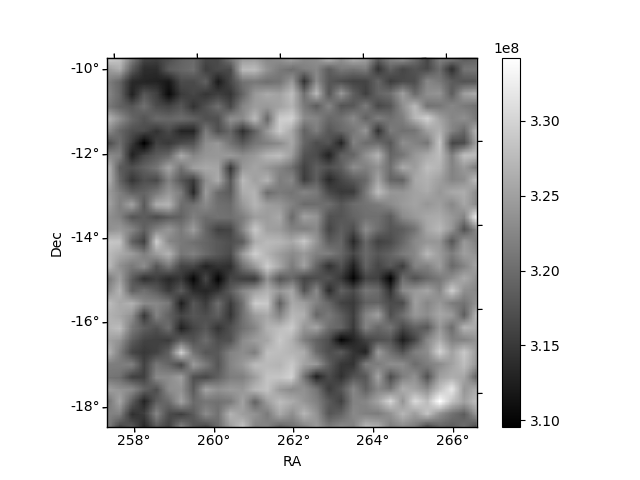
Histogram calculated using DETX and DETY for each event in the final _common_clean file
| Quadrant A | 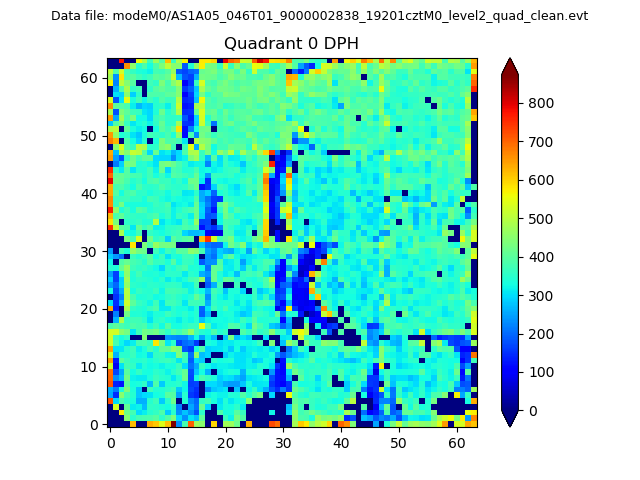 |
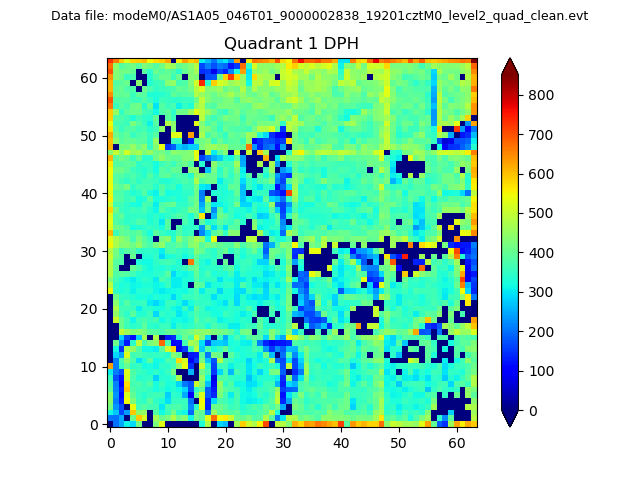 |
Quadrant B |
|---|---|---|---|
| Quadrant D | 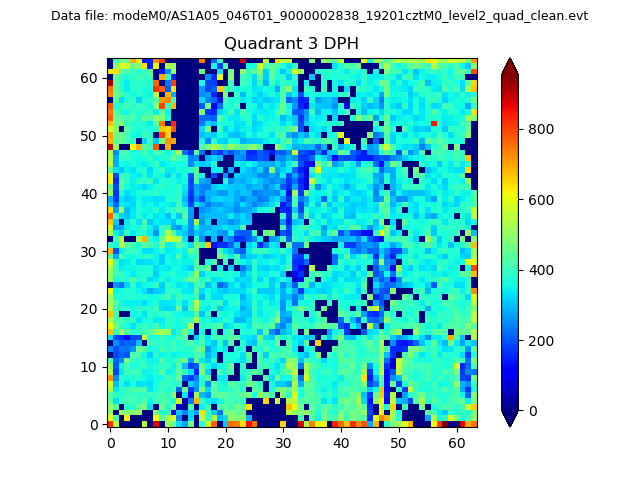 |
 |
Quadrant C |
| Plot type | Count rate plots | Images |
|---|---|---|
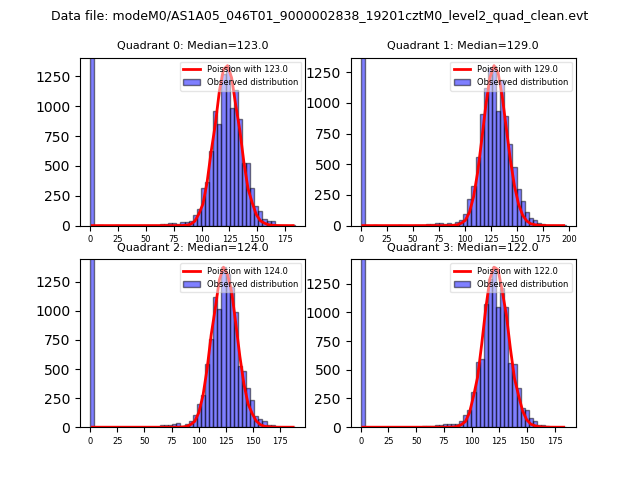
| Comparison with Poisson distribution Blue bars denote a histogram of data divided into 1 sec bins. Red curve is a Poisson curve with rate = median count rate of data. |
 |
 |
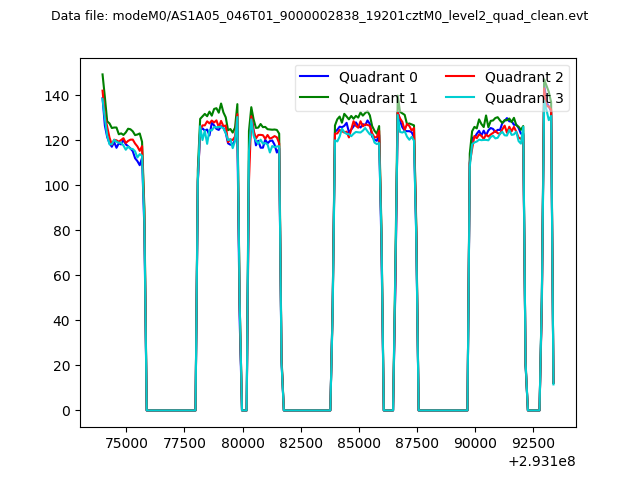
| Quadrant-wise count rates Data is divided into 100 sec bins |
 |
|
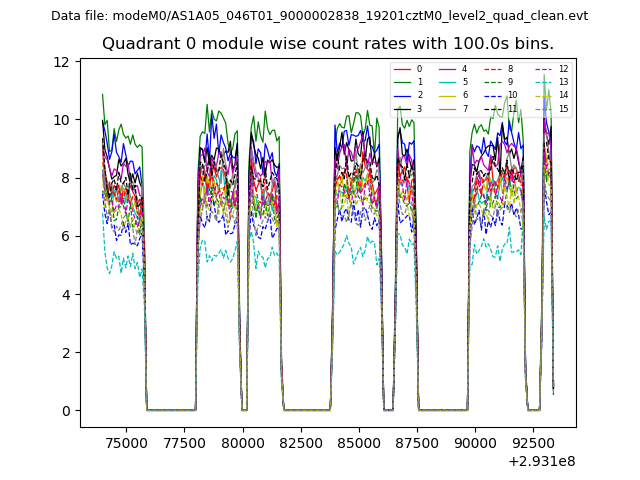
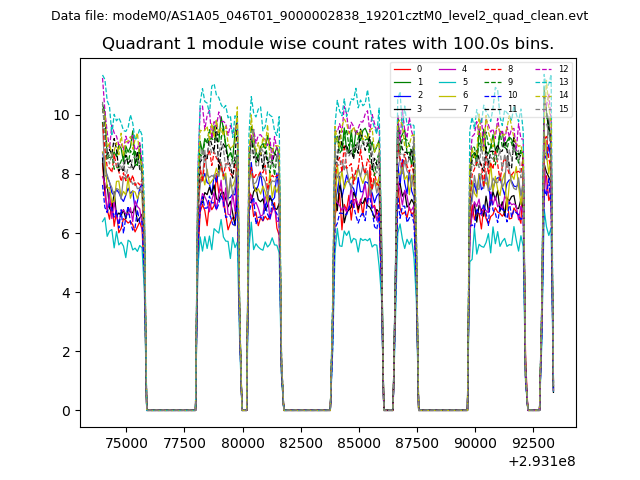
| Module-wise count rates for Quadrant A Data is divided into 100 sec bins |
 |
 |
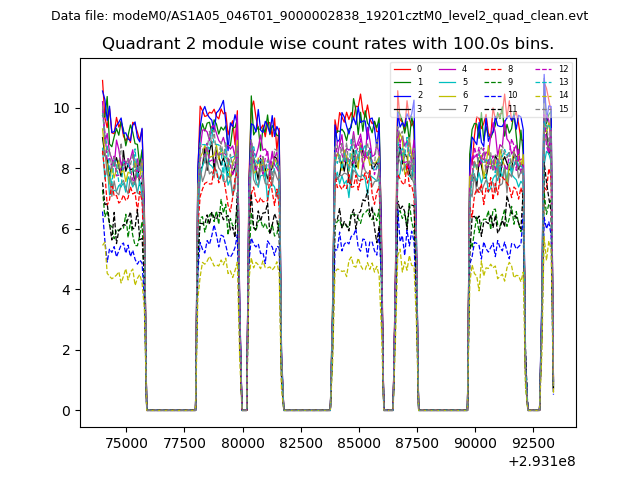
| Module-wise count rates for Quadrant B Data is divided into 100 sec bins |
 |
 |
| Module-wise count rates for Quadrant C Data is divided into 100 sec bins |
 |
 |
| Module-wise count rates for Quadrant D Data is divided into 100 sec bins |
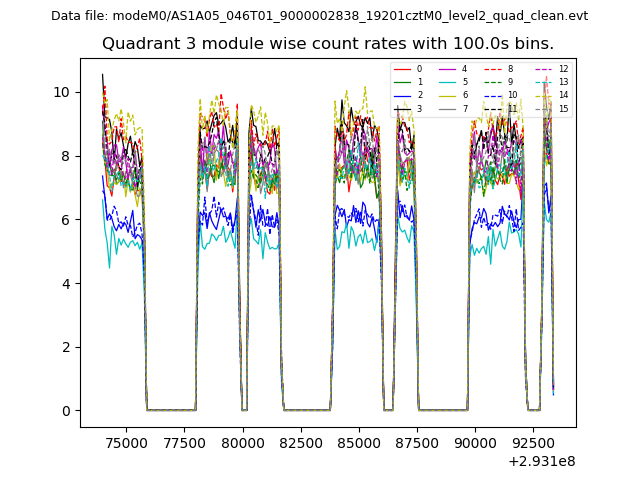 |
 |
| Parameter | Plot |
|---|---|
| CZT HV Monitor | 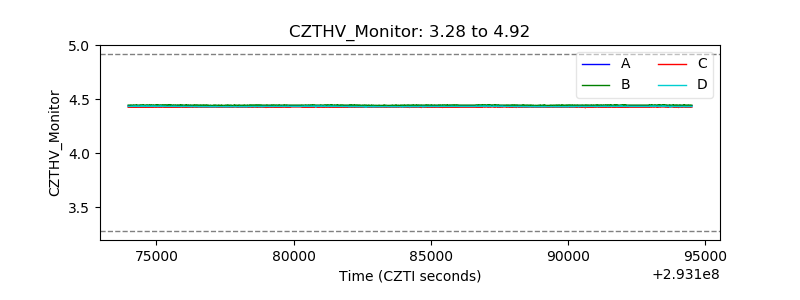 |
| D_VDD | 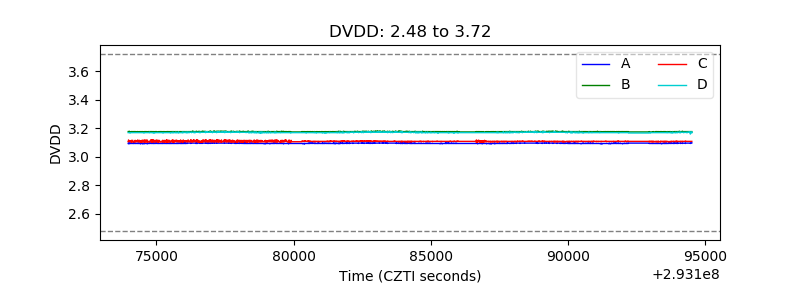 |
| Temperature 1 | 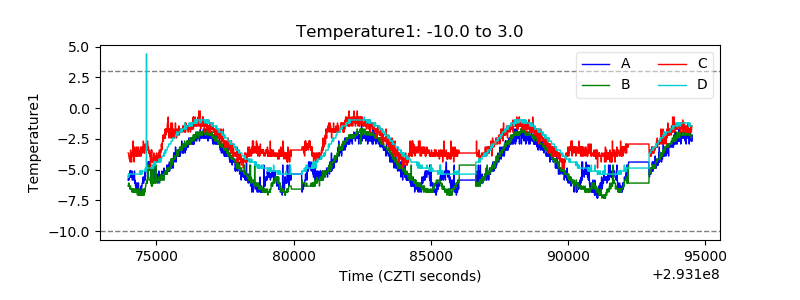 |
| Veto HV Monitor | 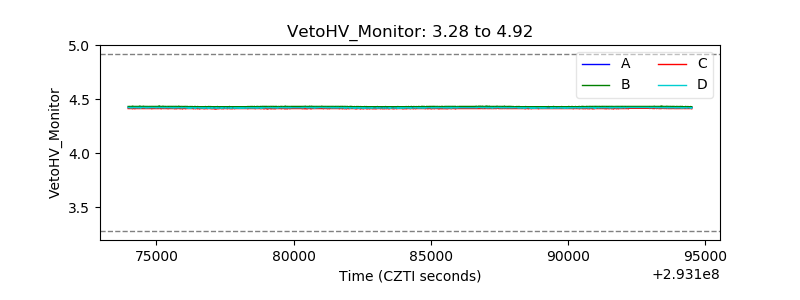 |
| Veto LLD | 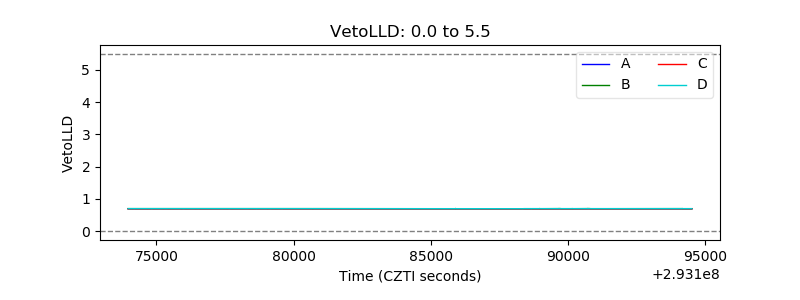 |
| Alpha Counter | 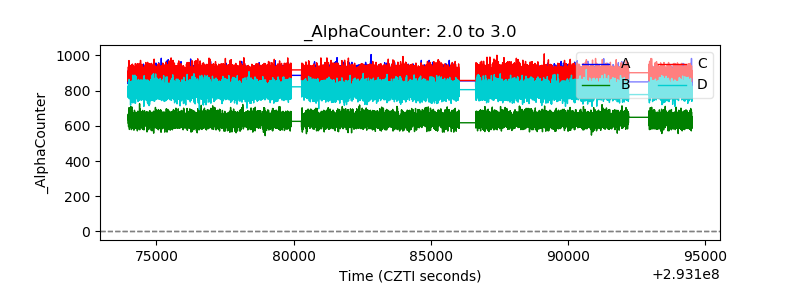 |
| _CPM_Rate | 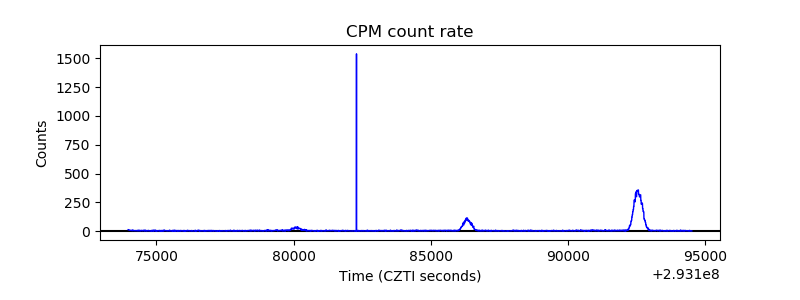 |
| CZT Counter | 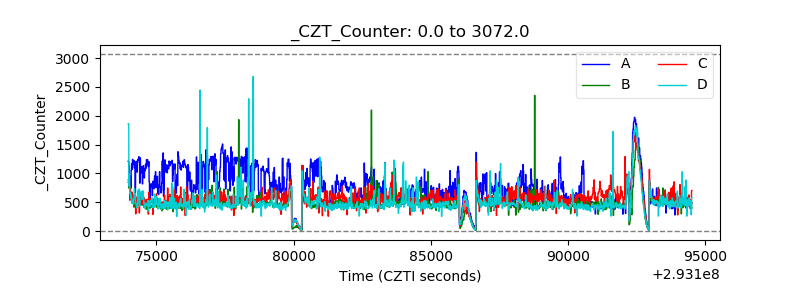 |
| +2.5 Volts monitor |  |
| +5 Volts monitor |  |
| _ROLL_ROT | 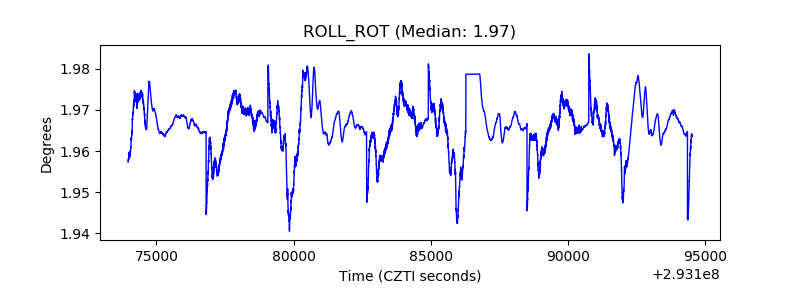 |
| _Roll_DEC | 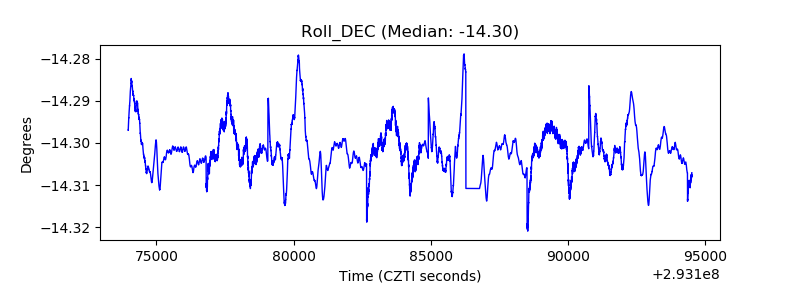 |
| _Roll_RA | 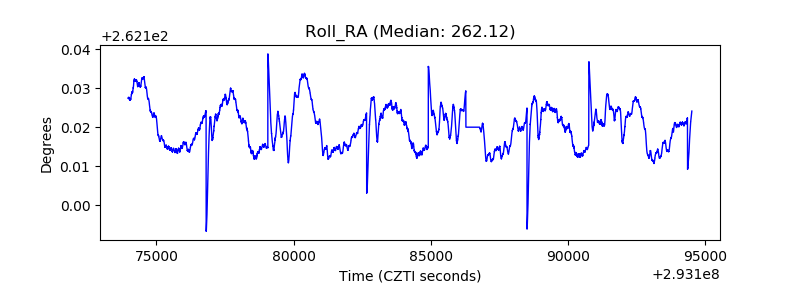 |
| Veto Counter | 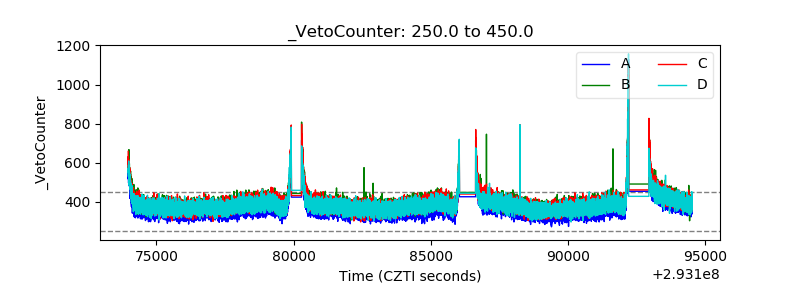 |