| Param | Original file | Final file |
|---|---|---|
| Filename | modeM0/AS1A05_046T01_9000002838_19202cztM0_level2.evt | modeM0/AS1A05_046T01_9000002838_19202cztM0_level2_quad_clean.evt |
| Size (bytes) | 2,967,315,840 | 442,788,480 |
| Size | 2.8 GB | 422.3 MB |
| Events in quadrant A | 27,641,726 | 2,676,423 |
| Events in quadrant B | 18,897,791 | 2,801,789 |
| Events in quadrant C | 21,755,326 | 2,698,163 |
| Events in quadrant D | 19,033,165 | 2,646,918 |
| Mode M0 | |||
|---|---|---|---|
| Quadrant | BADHDUFLAG | Total packets | Discarded packets |
| A | 0 | 108204 | 7 |
| B | 0 | 79924 | 7 |
| C | 0 | 88338 | 7 |
| D | 0 | 82054 | 7 |
| Mode SS | |||
|---|---|---|---|
| Quadrant | BADHDUFLAG | Total packets | Discarded packets |
| A | 0 | 766 | 0 |
| B | 0 | 766 | 0 |
| C | 0 | 766 | 0 |
| D | 0 | 766 | 0 |
| Mode M9 | |||
|---|---|---|---|
| Quadrant | BADHDUFLAG | Total packets | Discarded packets |
| A | 0 | 35 | 0 |
| B | 0 | 35 | 0 |
| C | 0 | 35 | 0 |
| D | 0 | 35 | 0 |
| Quadrant | Total seconds | Saturated seconds | Saturation percentage |
|---|---|---|---|
| A | 37668 | 980 | 2.601678% |
| B | 37669 | 840 | 2.229950% |
| C | 37668 | 1027 | 2.726452% |
| D | 37668 | 697 | 1.850377% |
Noise dominated data is calculated using 1-second bins in cleaned event files. If a bin has >2000 counts, and if more than 50% of those come from <1% of pixels, then it is considered to be noise-dominated and hence unusable.
| Quadrant | # 1 sec bins | Bins with >0 counts | Bins with >2000 counts | High rate bins dominated by noise | Noise dominated (total time) | Noise dominated (detector-on time) | Marked lightcurve |
|---|---|---|---|---|---|---|---|
| A | 41198 | 37671 | 1 | 1 | 0.00% | 0.00% | 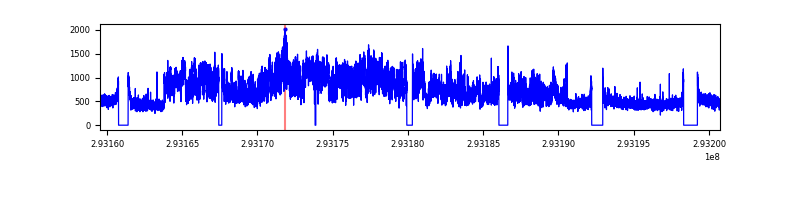 |
| B | 41199 | 37674 | 45 | 45 | 0.11% | 0.12% | 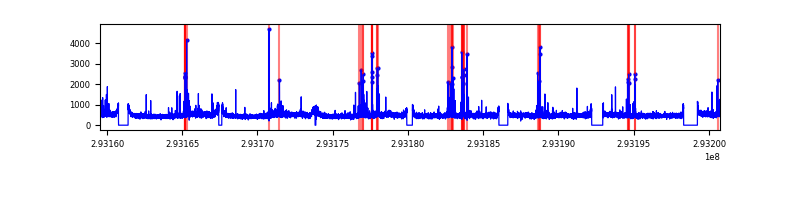 |
| C | 41198 | 37674 | 11 | 11 | 0.03% | 0.03% | 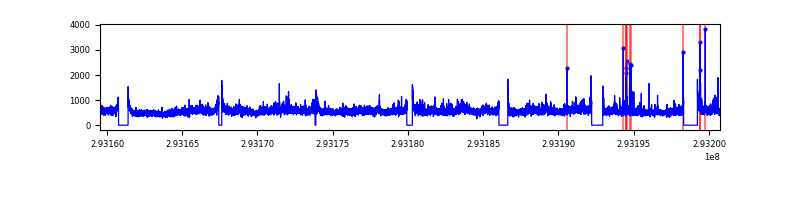 |
| D | 41198 | 37674 | 123 | 123 | 0.30% | 0.33% | 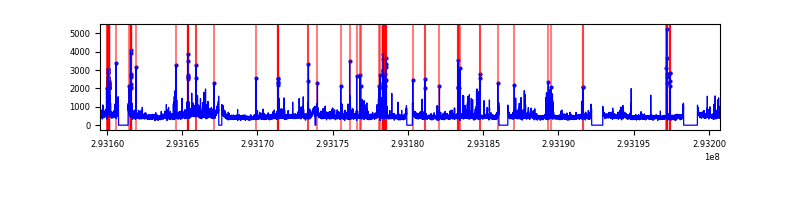 |
Top three noisy pixels from each quadrant. If the there are fewer than three noisy pixels in the level2.evt file, extra rows are filled as -1
| Pixel properties | Quadrant properties | ||||||
|---|---|---|---|---|---|---|---|
| Quadrant | DetID | PixID | Counts | Sigma | Mean | Median | Sigma |
| A | 8 | 192 | 9758995 | 10637.97 | 4569 | 4471 | 917.0 |
| A | 8 | 144 | 241754 | 258.77 | 4569 | 4471 | 917.0 |
| A | 13 | 254 | 53922 | 53.93 | 4569 | 4471 | 917.0 |
| B | 7 | 220 | 402162 | 447.56 | 4599 | 4470 | 888.6 |
| B | 12 | 111 | 109303 | 117.98 | 4599 | 4470 | 888.6 |
| B | 0 | 189 | 107795 | 116.28 | 4599 | 4470 | 888.6 |
| C | 3 | 233 | 3654211 | 3513.94 | 4436 | 4457 | 1038.6 |
| C | 14 | 238 | 685499 | 655.7 | 4436 | 4457 | 1038.6 |
| C | 0 | 207 | 113430 | 104.92 | 4436 | 4457 | 1038.6 |
| D | 10 | 66 | 837944 | 763.88 | 4514 | 4380 | 1091.2 |
| D | 11 | 176 | 311548 | 281.49 | 4514 | 4380 | 1091.2 |
| D | 1 | 52 | 246295 | 221.69 | 4514 | 4380 | 1091.2 |
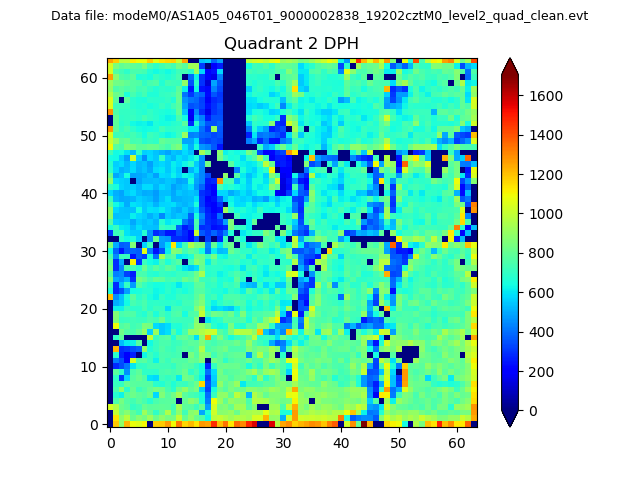
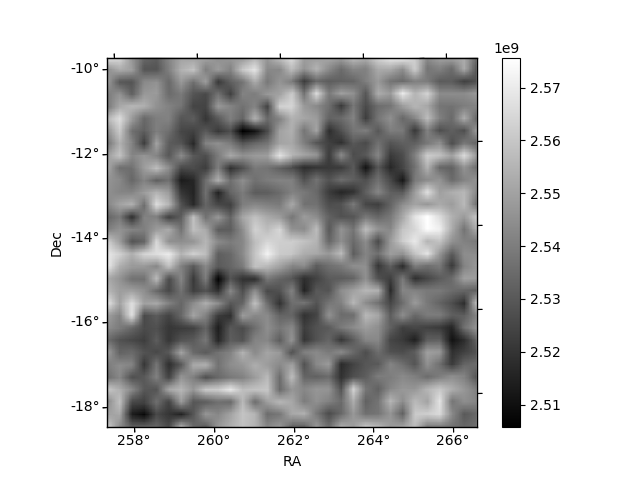
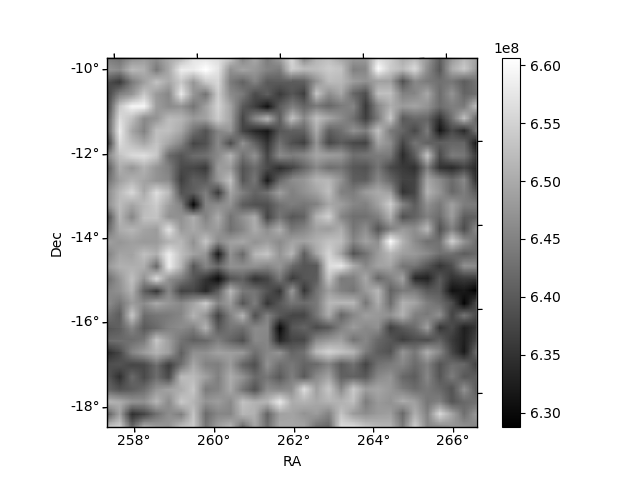
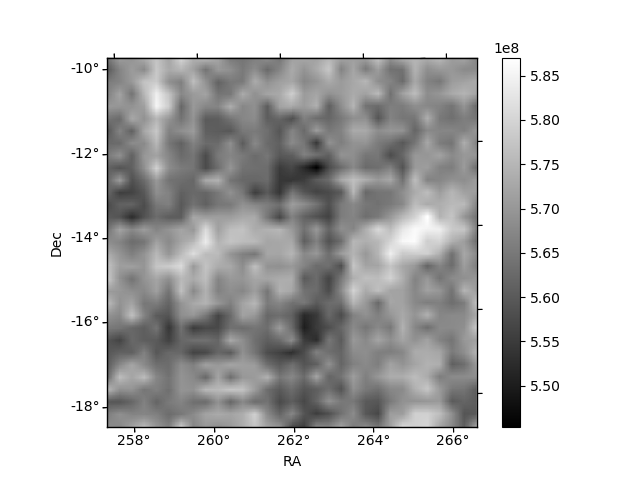
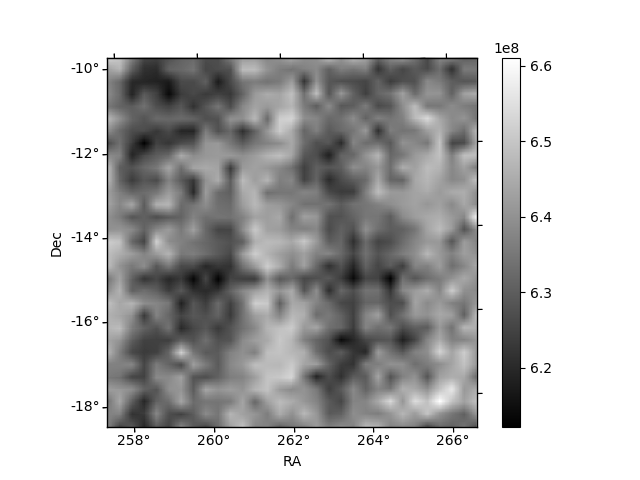
Histogram calculated using DETX and DETY for each event in the final _common_clean file
| Quadrant A | 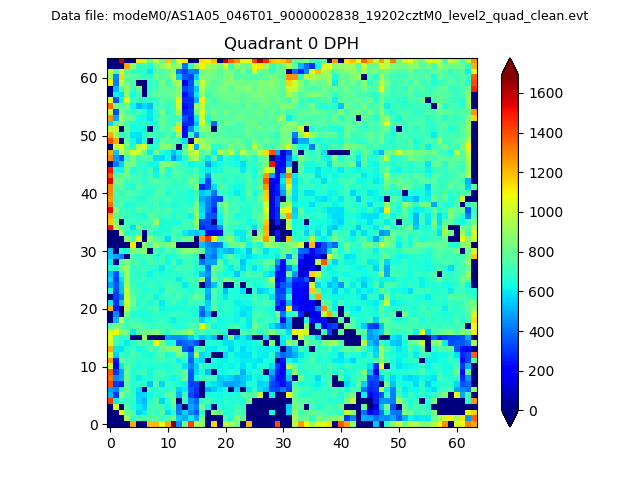 |
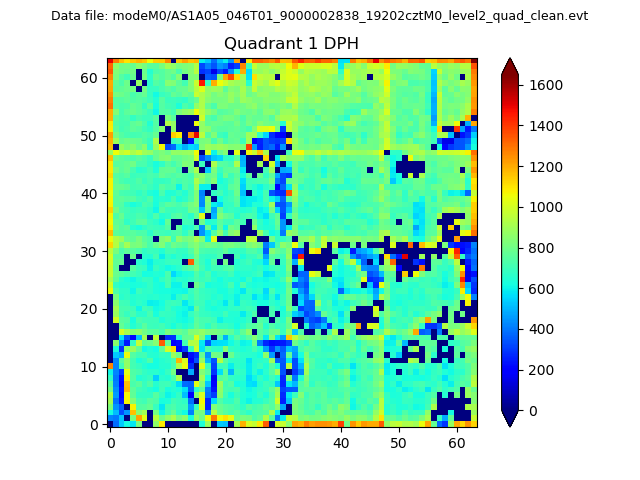 |
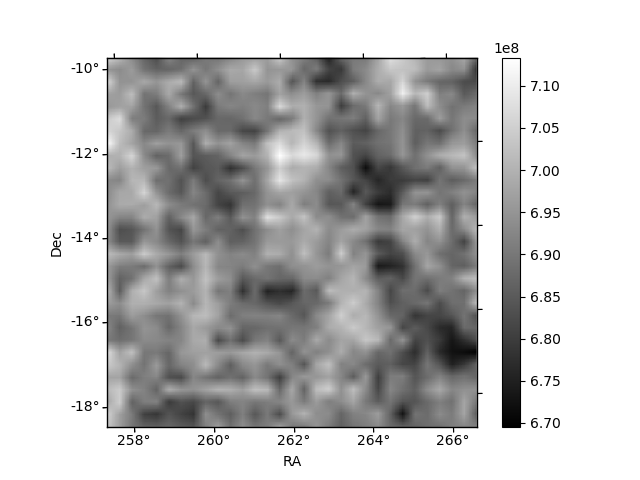
Quadrant B |
|---|---|---|---|
| Quadrant D | 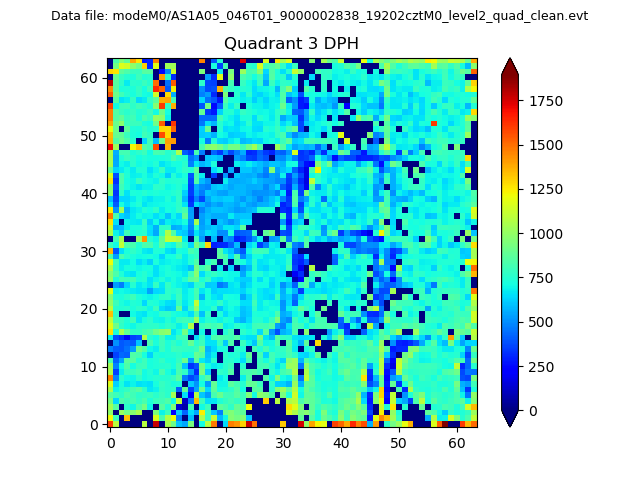 |
 |
Quadrant C |
| Plot type | Count rate plots | Images |
|---|---|---|
| Comparison with Poisson distribution Blue bars denote a histogram of data divided into 1 sec bins. Red curve is a Poisson curve with rate = median count rate of data. |
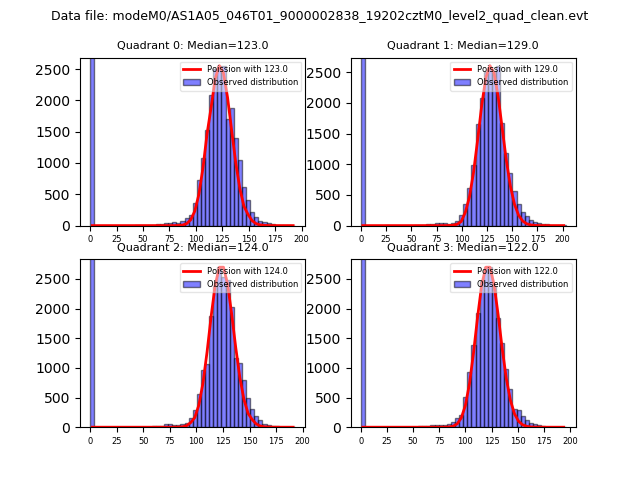 |
 |
| Quadrant-wise count rates Data is divided into 100 sec bins |
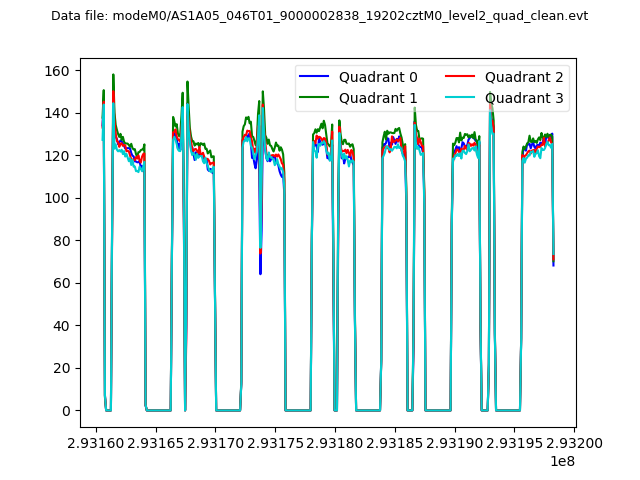 |
|
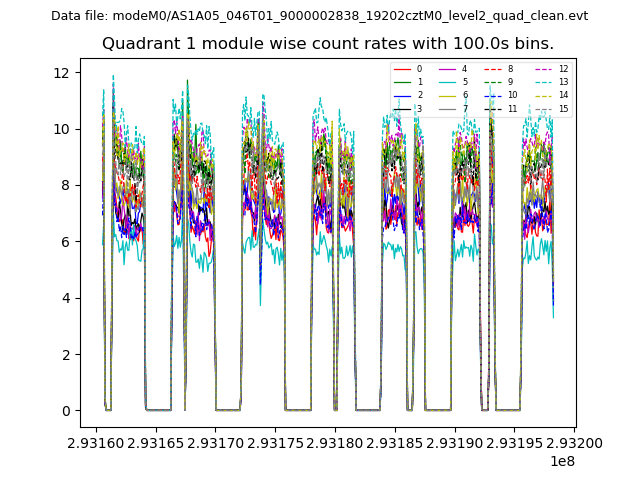
| Module-wise count rates for Quadrant A Data is divided into 100 sec bins |
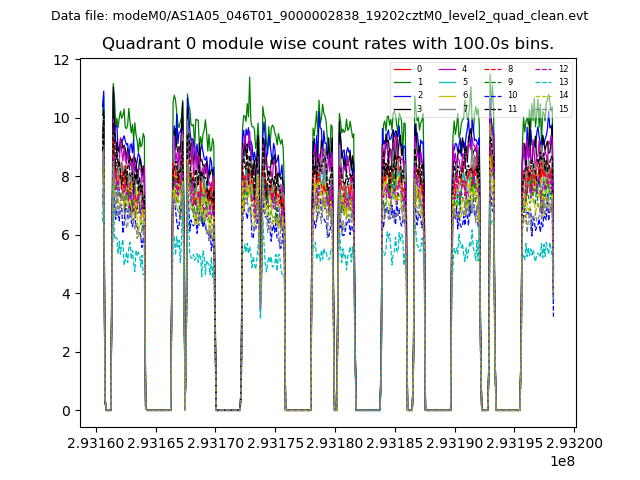 |
 |
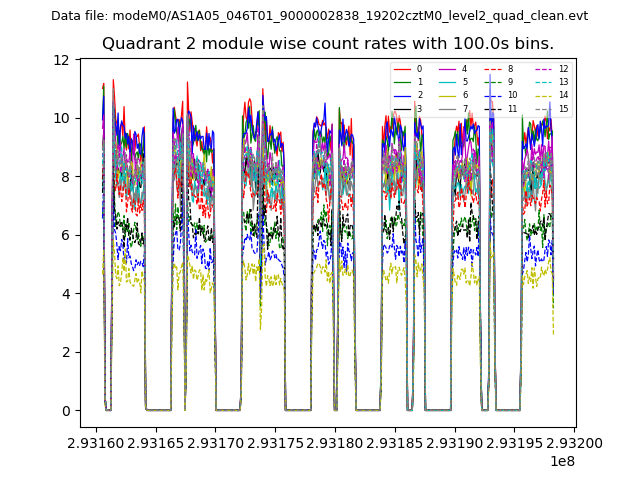
| Module-wise count rates for Quadrant B Data is divided into 100 sec bins |
 |
 |
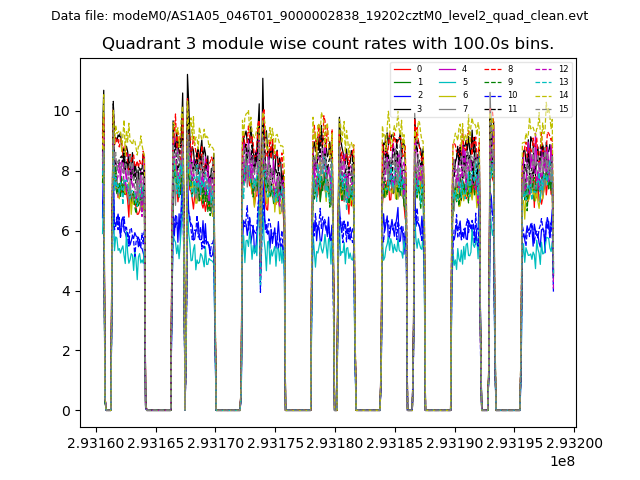
| Module-wise count rates for Quadrant C Data is divided into 100 sec bins |
 |
 |
| Module-wise count rates for Quadrant D Data is divided into 100 sec bins |
 |
 |
| Parameter | Plot |
|---|---|
| CZT HV Monitor | 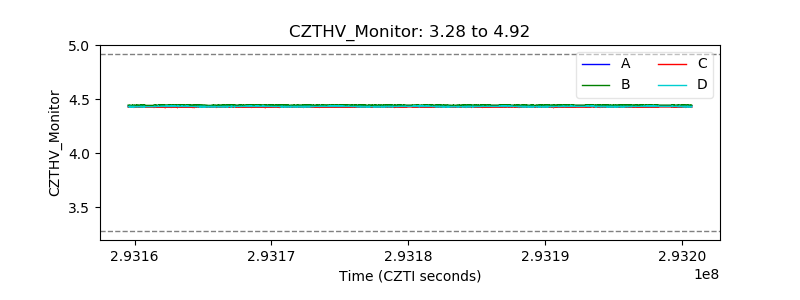 |
| D_VDD | 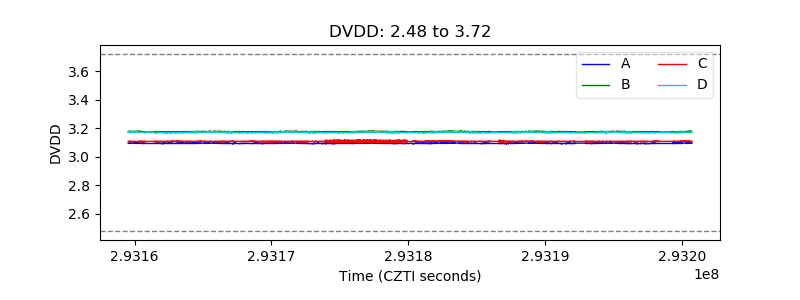 |
| Temperature 1 | 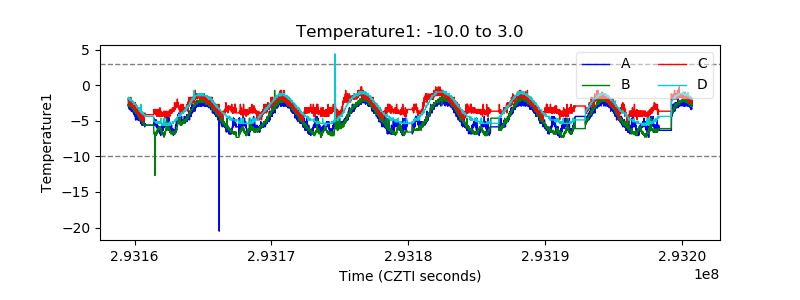 |
| Veto HV Monitor | 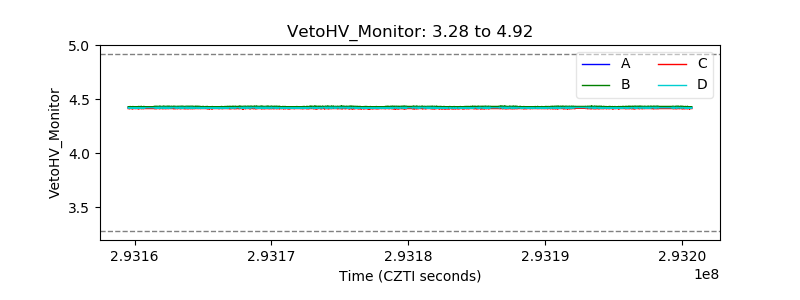 |
| Veto LLD | 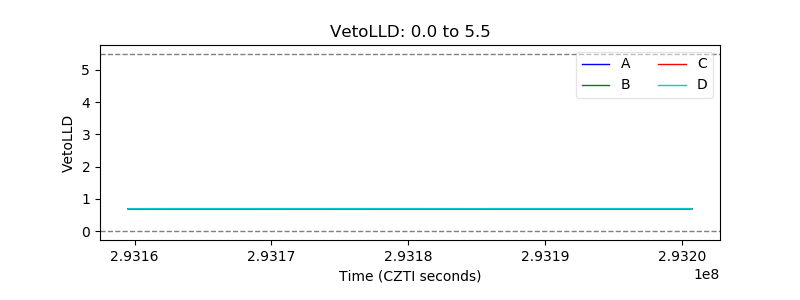 |
| Alpha Counter | 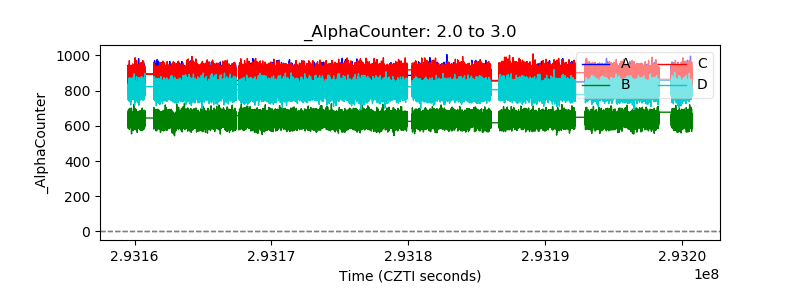 |
| _CPM_Rate | 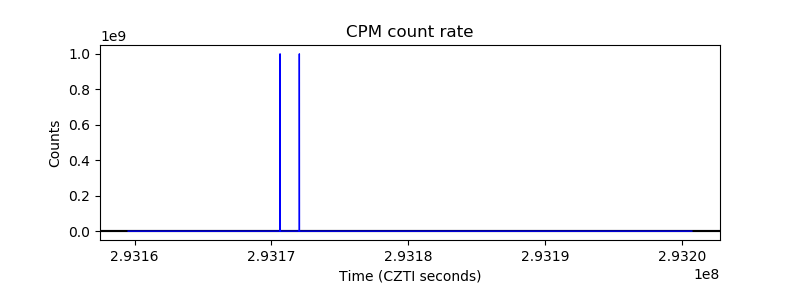 |
| CZT Counter | 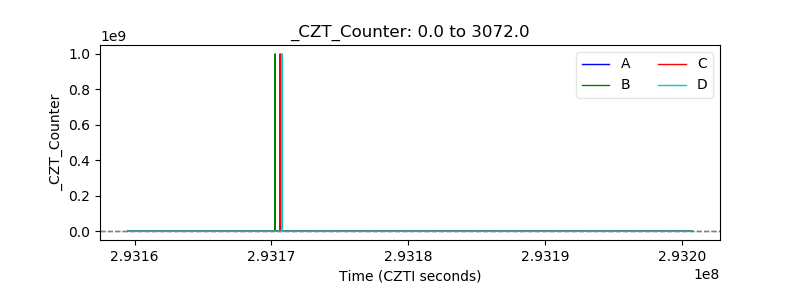 |
| +2.5 Volts monitor | 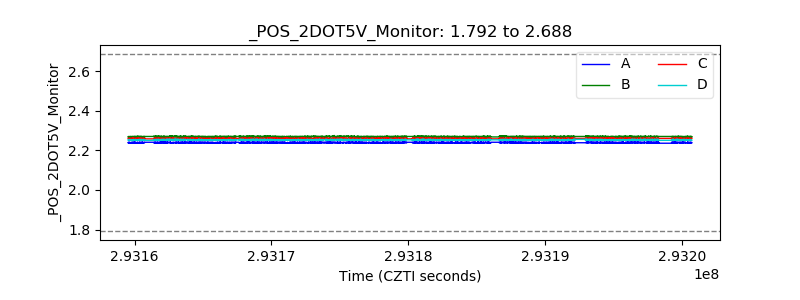 |
| +5 Volts monitor |  |
| _ROLL_ROT | 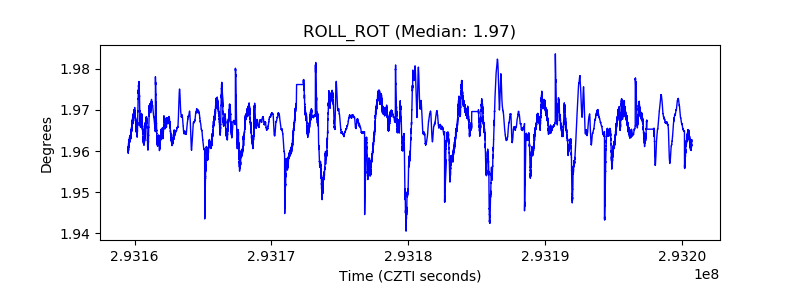 |
| _Roll_DEC | 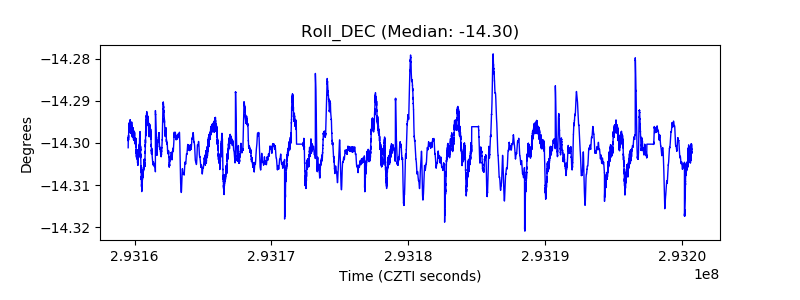 |
| _Roll_RA | 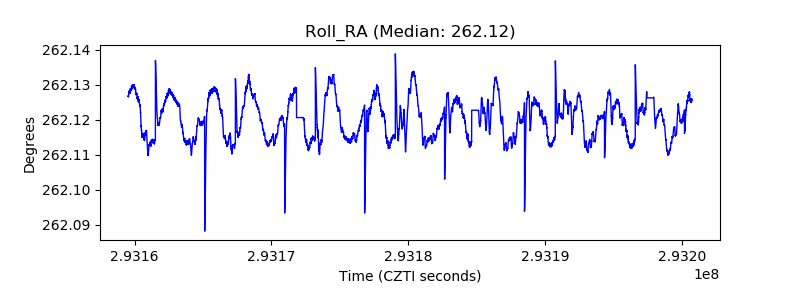 |
| Veto Counter | 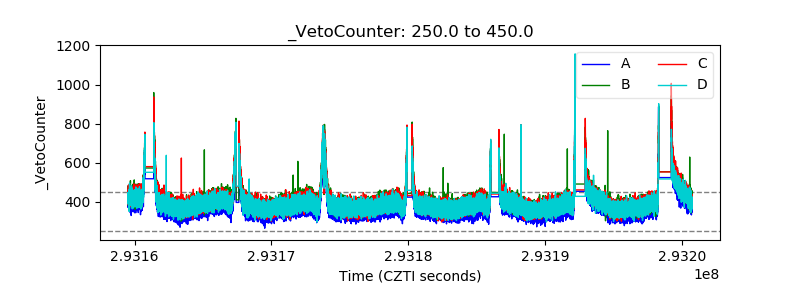 |