| Param | Original file | Final file |
|---|---|---|
| Filename | modeM0/AS1A05_046T01_9000002838_19205cztM0_level2.evt | modeM0/AS1A05_046T01_9000002838_19205cztM0_level2_quad_clean.evt |
| Size (bytes) | 494,556,480 | 71,409,600 |
| Size | 471.6 MB | 68.1 MB |
| Events in quadrant A | 3,230,178 | 434,463 |
| Events in quadrant B | 3,319,389 | 445,118 |
| Events in quadrant C | 4,286,981 | 423,248 |
| Events in quadrant D | 3,713,409 | 419,429 |
| Mode M0 | |||
|---|---|---|---|
| Quadrant | BADHDUFLAG | Total packets | Discarded packets |
| A | 0 | 13745 | 2 |
| B | 0 | 13933 | 2 |
| C | 0 | 17366 | 2 |
| D | 0 | 15321 | 2 |
| Mode SS | |||
|---|---|---|---|
| Quadrant | BADHDUFLAG | Total packets | Discarded packets |
| A | 0 | 130 | 0 |
| B | 0 | 130 | 0 |
| C | 0 | 130 | 0 |
| D | 0 | 130 | 0 |
| Mode M9 | |||
|---|---|---|---|
| Quadrant | BADHDUFLAG | Total packets | Discarded packets |
| A | 0 | 23 | 0 |
| B | 0 | 23 | 0 |
| C | 0 | 23 | 0 |
| D | 0 | 23 | 0 |
| Quadrant | Total seconds | Saturated seconds | Saturation percentage |
|---|---|---|---|
| A | 6303 | 60 | 0.951928% |
| B | 6304 | 66 | 1.046954% |
| C | 6304 | 170 | 2.696701% |
| D | 6304 | 132 | 2.093909% |
Noise dominated data is calculated using 1-second bins in cleaned event files. If a bin has >2000 counts, and if more than 50% of those come from <1% of pixels, then it is considered to be noise-dominated and hence unusable.
| Quadrant | # 1 sec bins | Bins with >0 counts | Bins with >2000 counts | High rate bins dominated by noise | Noise dominated (total time) | Noise dominated (detector-on time) | Marked lightcurve |
|---|---|---|---|---|---|---|---|
| A | 8583 | 6304 | 0 | 0 | 0.00% | 0.00% | 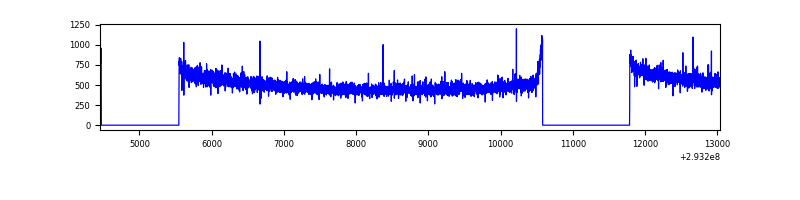 |
| B | 8584 | 6305 | 1 | 1 | 0.01% | 0.02% | 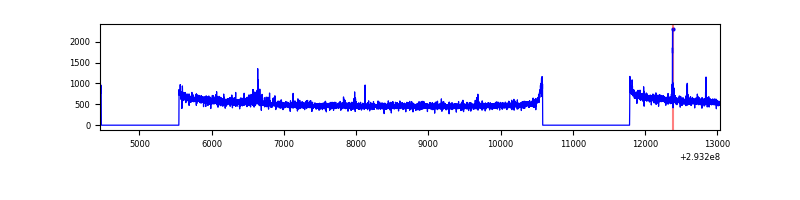 |
| C | 8584 | 6305 | 7 | 7 | 0.08% | 0.11% | 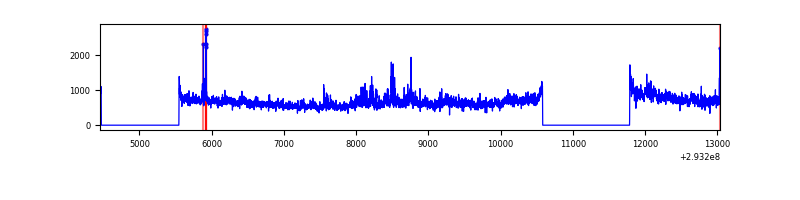 |
| D | 8584 | 6305 | 61 | 61 | 0.71% | 0.97% | 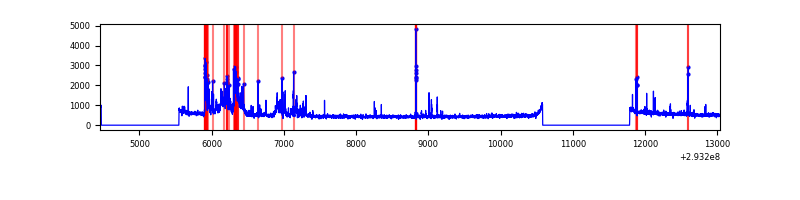 |
Top three noisy pixels from each quadrant. If the there are fewer than three noisy pixels in the level2.evt file, extra rows are filled as -1
| Pixel properties | Quadrant properties | ||||||
|---|---|---|---|---|---|---|---|
| Quadrant | DetID | PixID | Counts | Sigma | Mean | Median | Sigma |
| A | 13 | 254 | 9669 | 53.11 | 836 | 820 | 166.6 |
| A | 0 | 226 | 7339 | 39.13 | 836 | 820 | 166.6 |
| A | 14 | 235 | 7308 | 38.94 | 836 | 820 | 166.6 |
| B | 0 | 190 | 20373 | 124.08 | 837 | 820 | 157.6 |
| B | 12 | 111 | 18346 | 111.22 | 837 | 820 | 157.6 |
| B | 11 | 111 | 16047 | 96.63 | 837 | 820 | 157.6 |
| C | 3 | 233 | 1017848 | 5502.17 | 799 | 804 | 184.8 |
| C | 14 | 238 | 125923 | 676.89 | 799 | 804 | 184.8 |
| C | 0 | 207 | 27781 | 145.94 | 799 | 804 | 184.8 |
| D | 12 | 16 | 479889 | 2463.68 | 810 | 788 | 194.5 |
| D | 9 | 68 | 87533 | 446.07 | 810 | 788 | 194.5 |
| D | 7 | 96 | 35399 | 177.98 | 810 | 788 | 194.5 |
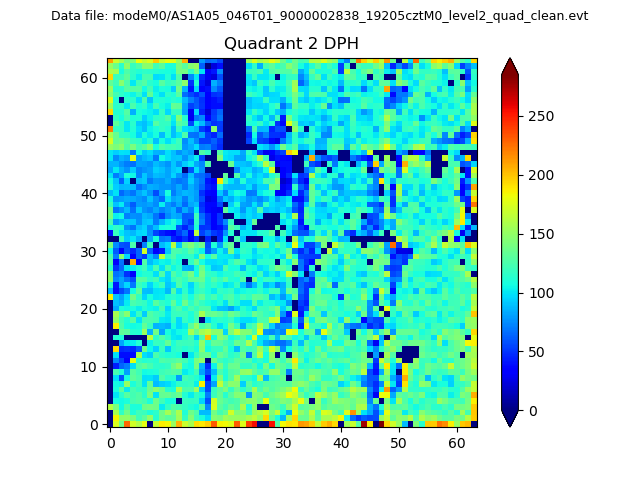
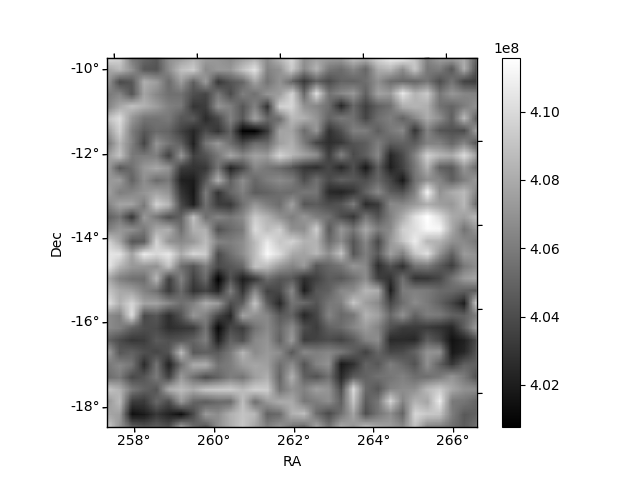
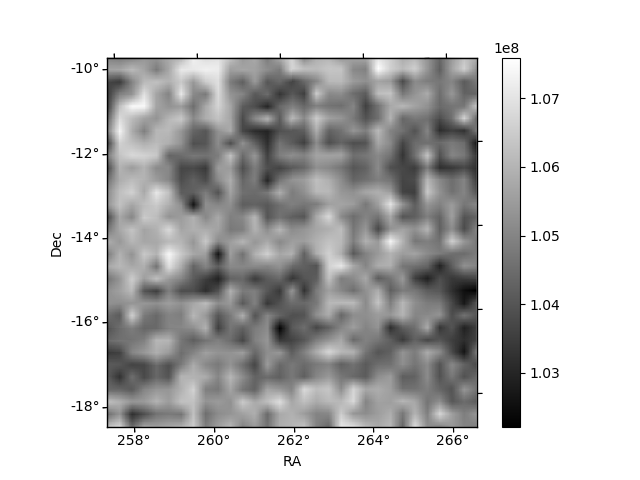
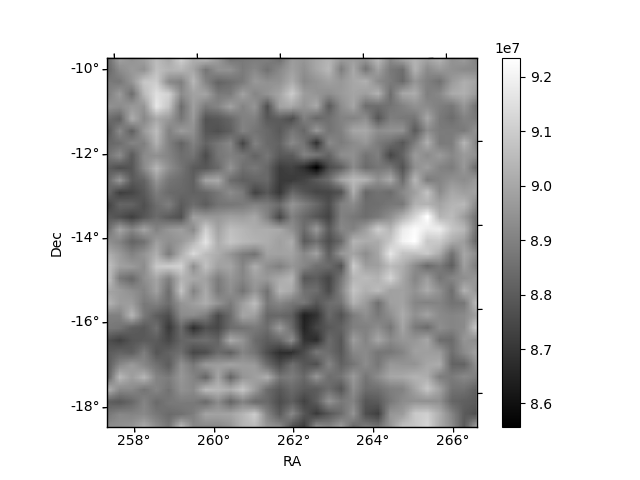
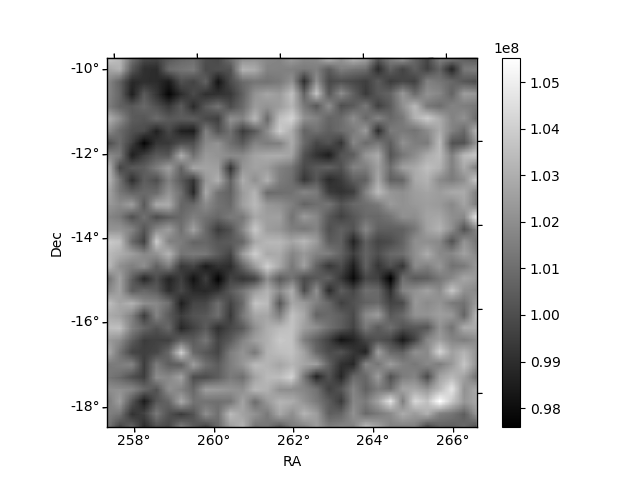
Histogram calculated using DETX and DETY for each event in the final _common_clean file
| Quadrant A | 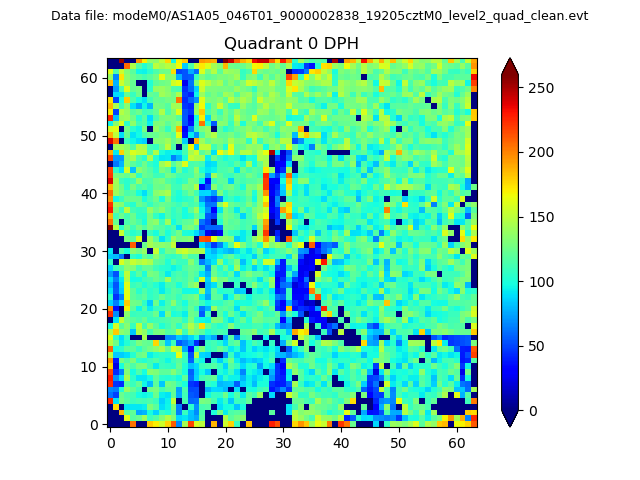 |
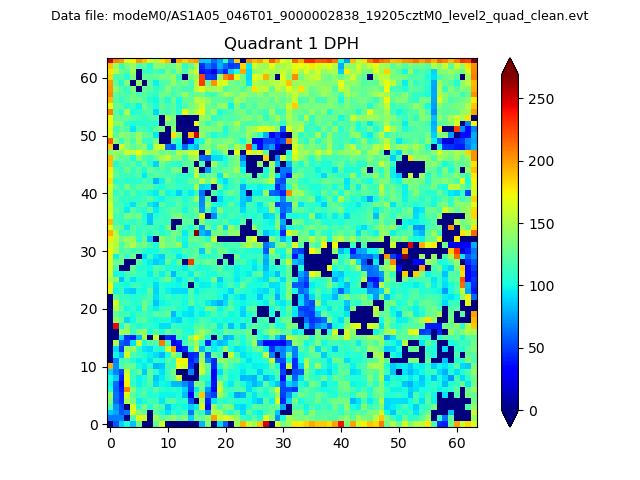 |
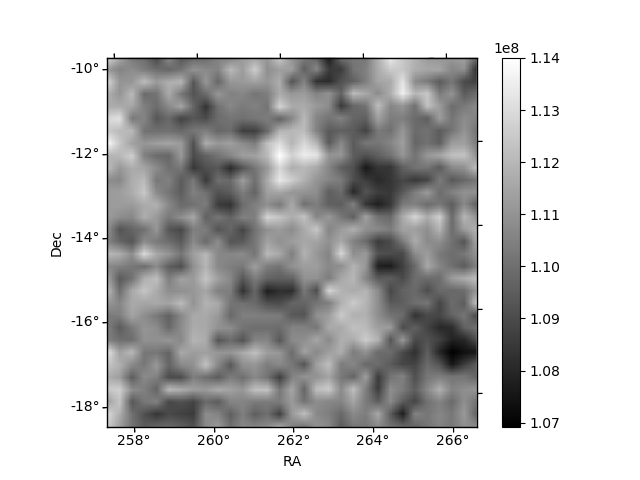
Quadrant B |
|---|---|---|---|
| Quadrant D | 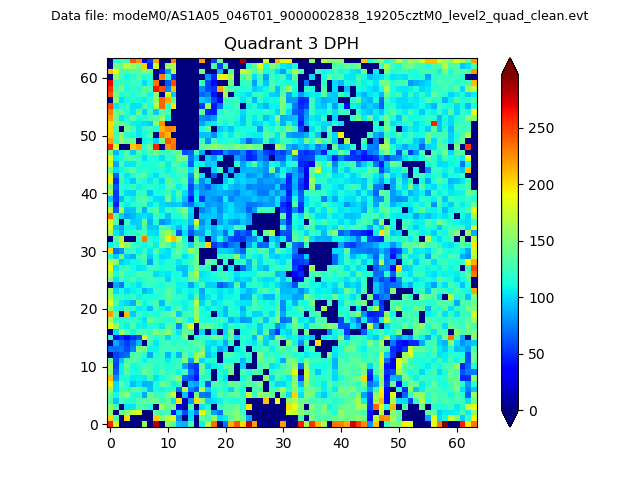 |
 |
Quadrant C |
| Plot type | Count rate plots | Images |
|---|---|---|
| Comparison with Poisson distribution Blue bars denote a histogram of data divided into 1 sec bins. Red curve is a Poisson curve with rate = median count rate of data. |
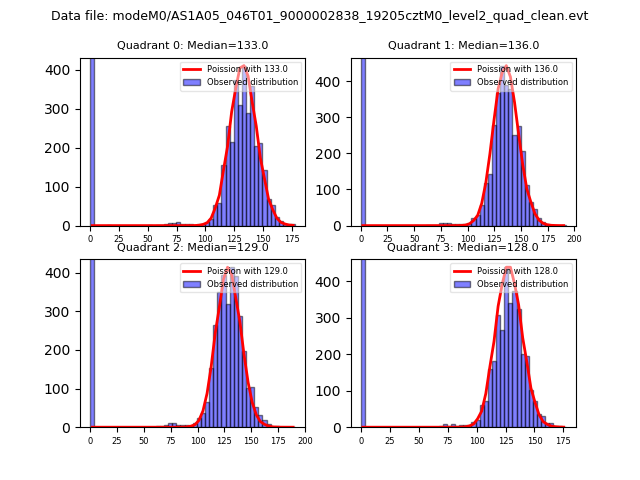 |
 |
| Quadrant-wise count rates Data is divided into 100 sec bins |
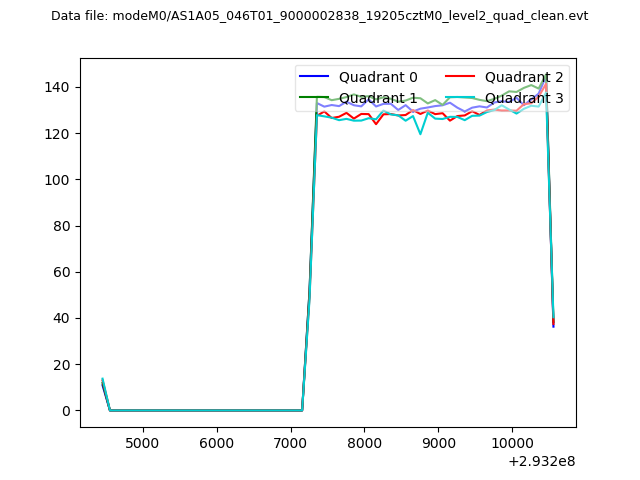 |
|
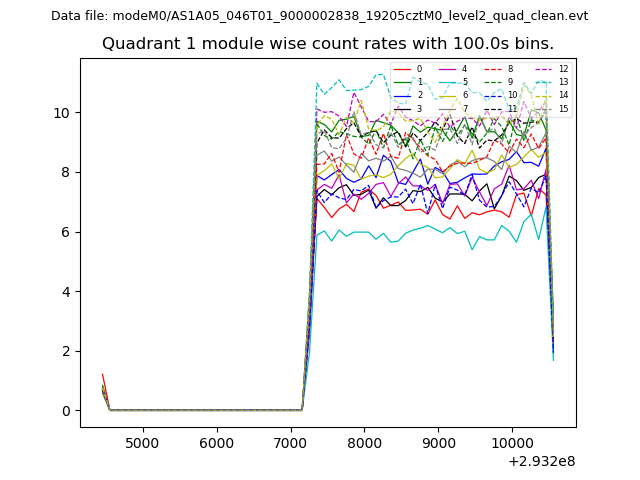
| Module-wise count rates for Quadrant A Data is divided into 100 sec bins |
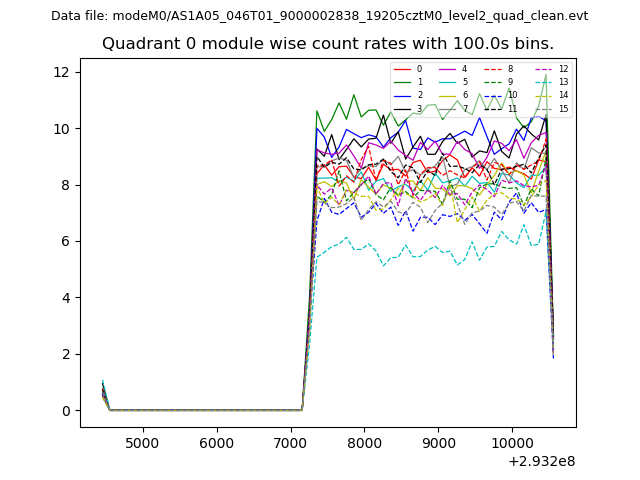 |
 |
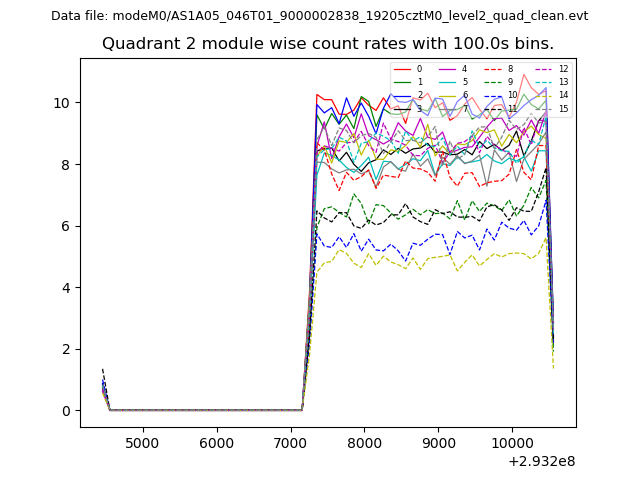
| Module-wise count rates for Quadrant B Data is divided into 100 sec bins |
 |
 |
| Module-wise count rates for Quadrant C Data is divided into 100 sec bins |
 |
 |
| Module-wise count rates for Quadrant D Data is divided into 100 sec bins |
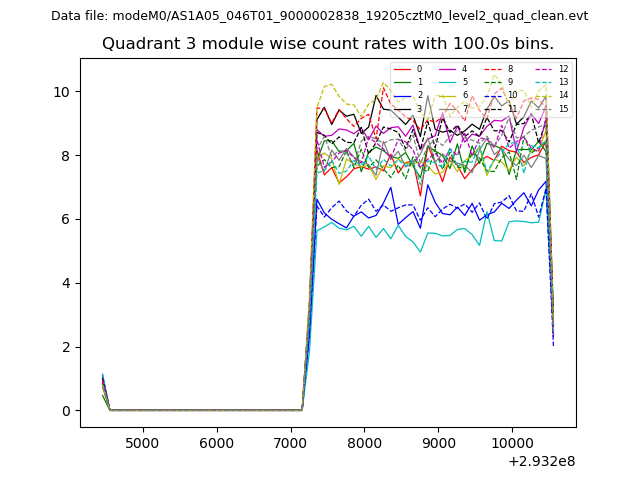 |
 |
| Parameter | Plot |
|---|---|
| CZT HV Monitor | 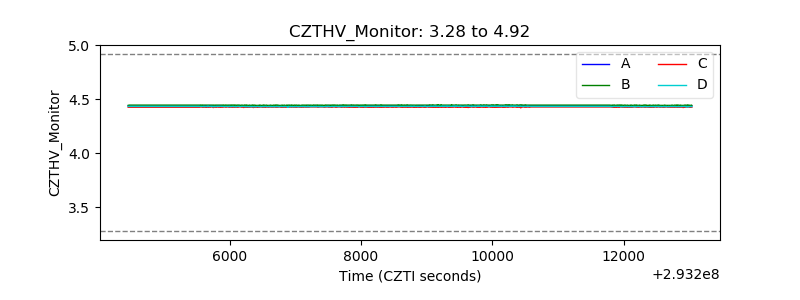 |
| D_VDD | 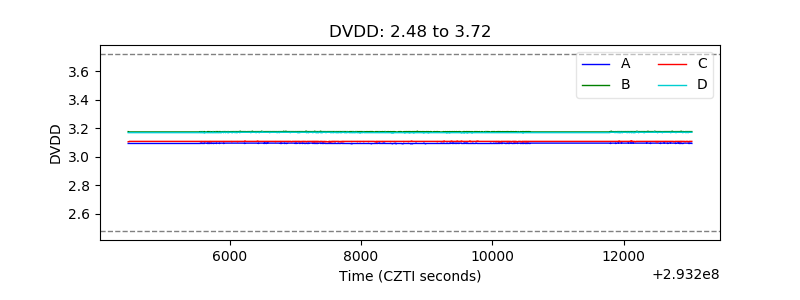 |
| Temperature 1 | 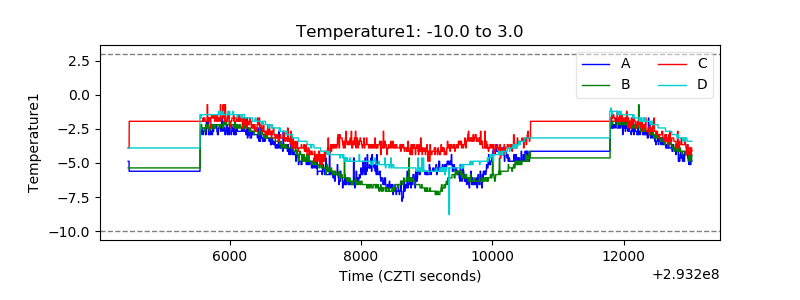 |
| Veto HV Monitor | 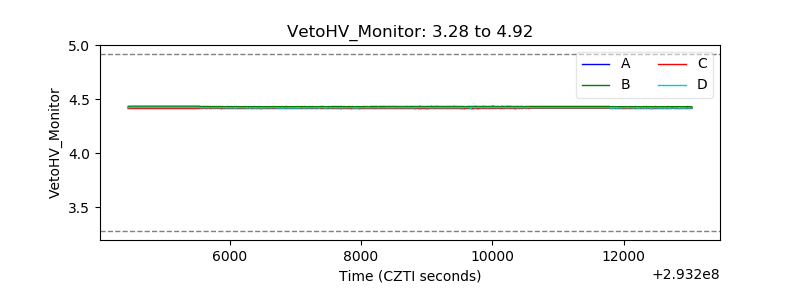 |
| Veto LLD | 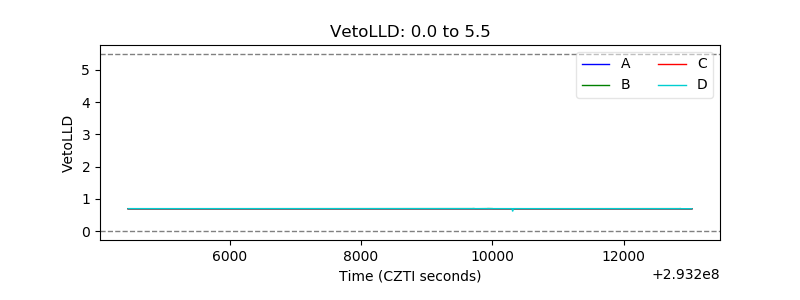 |
| Alpha Counter | 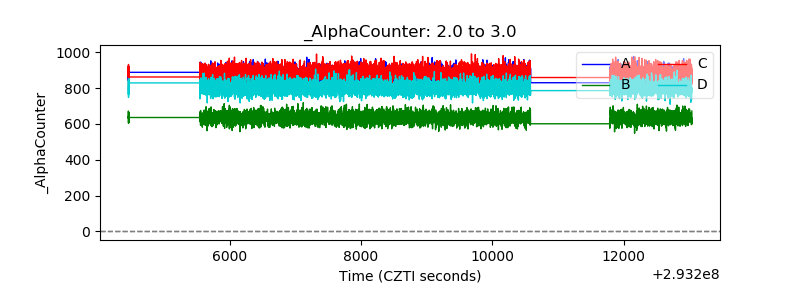 |
| _CPM_Rate | 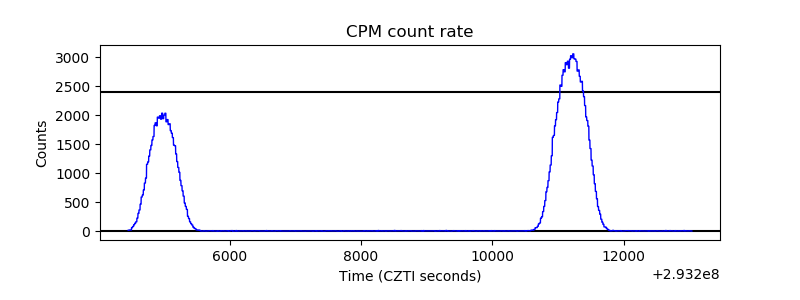 |
| CZT Counter | 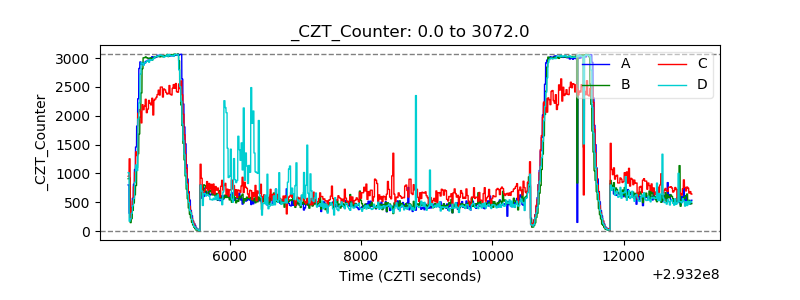 |
| +2.5 Volts monitor |  |
| +5 Volts monitor |  |
| _ROLL_ROT | 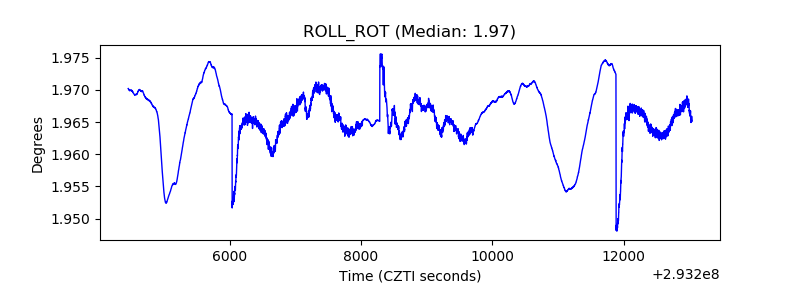 |
| _Roll_DEC | 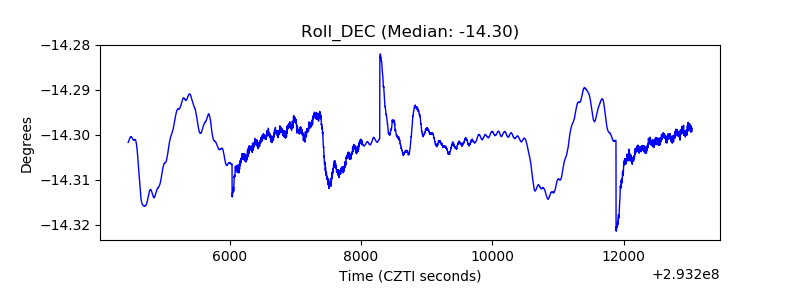 |
| _Roll_RA | 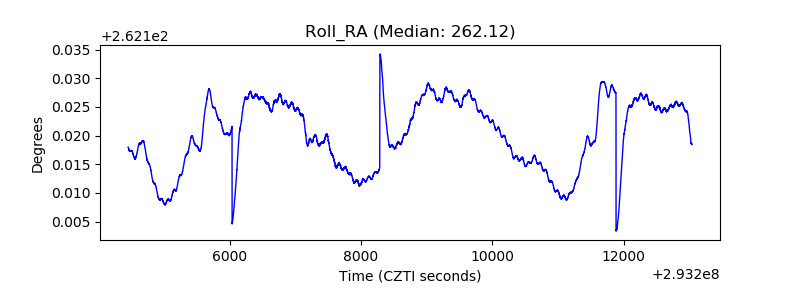 |
| Veto Counter | 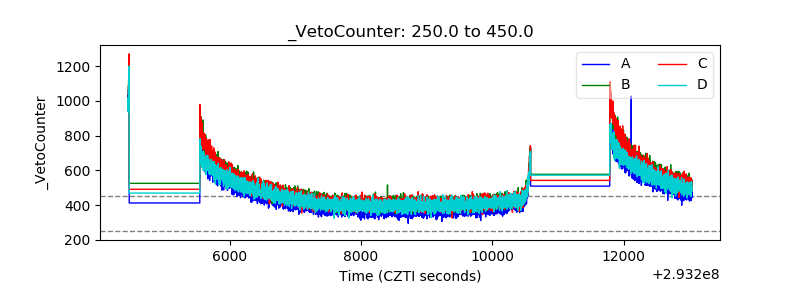 |