| Param | Original file | Final file |
|---|---|---|
| Filename | modeM0/AS1A05_046T01_9000002838_19206cztM0_level2.evt | modeM0/AS1A05_046T01_9000002838_19206cztM0_level2_quad_clean.evt |
| Size (bytes) | 487,736,640 | 86,175,360 |
| Size | 465.1 MB | 82.2 MB |
| Events in quadrant A | 3,320,466 | 547,034 |
| Events in quadrant B | 3,461,161 | 561,716 |
| Events in quadrant C | 4,287,854 | 535,269 |
| Events in quadrant D | 3,277,304 | 529,132 |
| Mode M0 | |||
|---|---|---|---|
| Quadrant | BADHDUFLAG | Total packets | Discarded packets |
| A | 0 | 13925 | 2 |
| B | 0 | 14313 | 2 |
| C | 0 | 17366 | 2 |
| D | 0 | 13784 | 2 |
| Mode SS | |||
|---|---|---|---|
| Quadrant | BADHDUFLAG | Total packets | Discarded packets |
| A | 0 | 128 | 0 |
| B | 0 | 128 | 0 |
| C | 0 | 128 | 0 |
| D | 0 | 128 | 0 |
| Mode M9 | |||
|---|---|---|---|
| Quadrant | BADHDUFLAG | Total packets | Discarded packets |
| A | 0 | 25 | 0 |
| B | 0 | 25 | 0 |
| C | 0 | 25 | 0 |
| D | 0 | 25 | 0 |
| Quadrant | Total seconds | Saturated seconds | Saturation percentage |
|---|---|---|---|
| A | 6257 | 93 | 1.486335% |
| B | 6258 | 120 | 1.917546% |
| C | 6258 | 214 | 3.419623% |
| D | 6257 | 86 | 1.374461% |
Noise dominated data is calculated using 1-second bins in cleaned event files. If a bin has >2000 counts, and if more than 50% of those come from <1% of pixels, then it is considered to be noise-dominated and hence unusable.
| Quadrant | # 1 sec bins | Bins with >0 counts | Bins with >2000 counts | High rate bins dominated by noise | Noise dominated (total time) | Noise dominated (detector-on time) | Marked lightcurve |
|---|---|---|---|---|---|---|---|
| A | 8712 | 6258 | 0 | 0 | 0.00% | 0.00% | 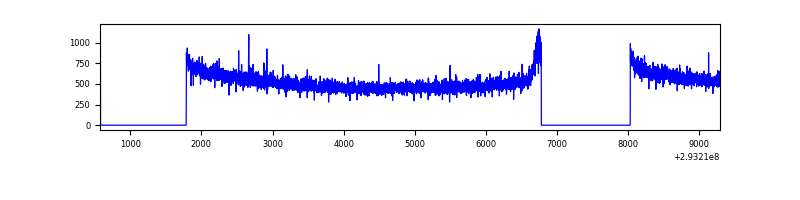 |
| B | 8713 | 6259 | 7 | 7 | 0.08% | 0.11% | 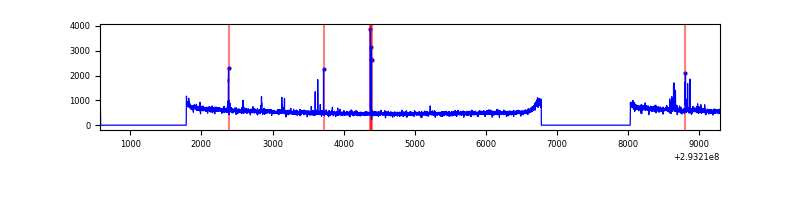 |
| C | 8713 | 6259 | 1 | 1 | 0.01% | 0.02% | 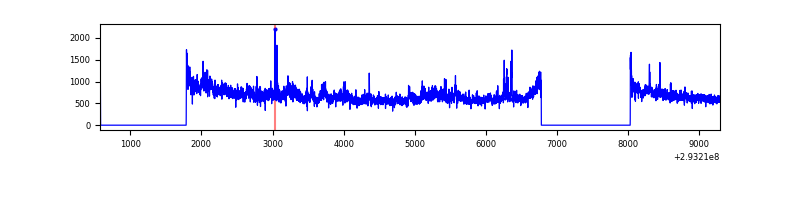 |
| D | 8712 | 6259 | 18 | 18 | 0.21% | 0.29% | 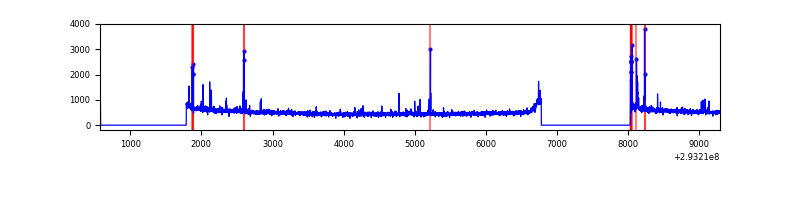 |
Top three noisy pixels from each quadrant. If the there are fewer than three noisy pixels in the level2.evt file, extra rows are filled as -1
| Pixel properties | Quadrant properties | ||||||
|---|---|---|---|---|---|---|---|
| Quadrant | DetID | PixID | Counts | Sigma | Mean | Median | Sigma |
| A | 13 | 254 | 8661 | 45.57 | 859 | 843 | 171.5 |
| A | 14 | 235 | 7672 | 39.81 | 859 | 843 | 171.5 |
| A | 0 | 226 | 7595 | 39.36 | 859 | 843 | 171.5 |
| B | 3 | 64 | 27906 | 166.95 | 863 | 845 | 162.1 |
| B | 12 | 111 | 18664 | 109.93 | 863 | 845 | 162.1 |
| B | 0 | 190 | 17899 | 105.22 | 863 | 845 | 162.1 |
| C | 3 | 233 | 937797 | 4911.56 | 825 | 833 | 190.8 |
| C | 14 | 238 | 129737 | 675.71 | 825 | 833 | 190.8 |
| C | 13 | 61 | 5702 | 25.52 | 825 | 833 | 190.8 |
| D | 7 | 96 | 50819 | 244.71 | 838 | 813 | 204.4 |
| D | 11 | 176 | 37765 | 180.83 | 838 | 813 | 204.4 |
| D | 2 | 234 | 26519 | 125.79 | 838 | 813 | 204.4 |
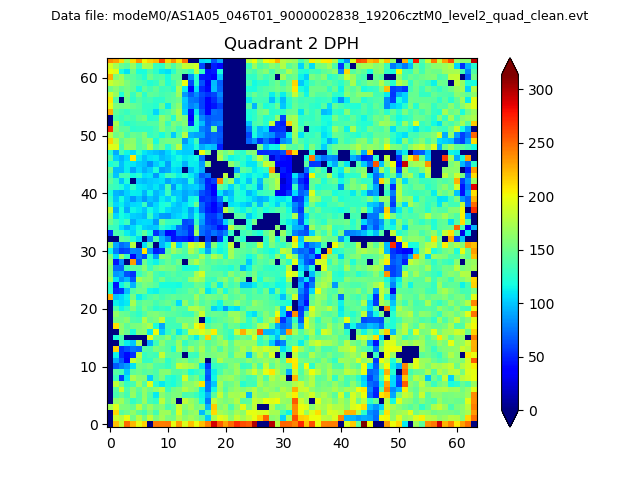
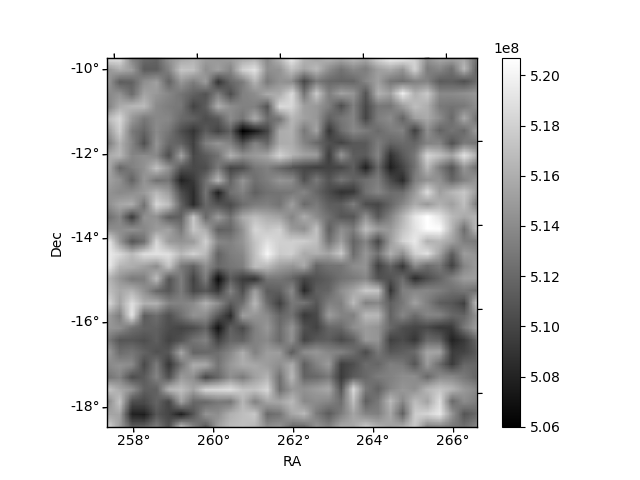
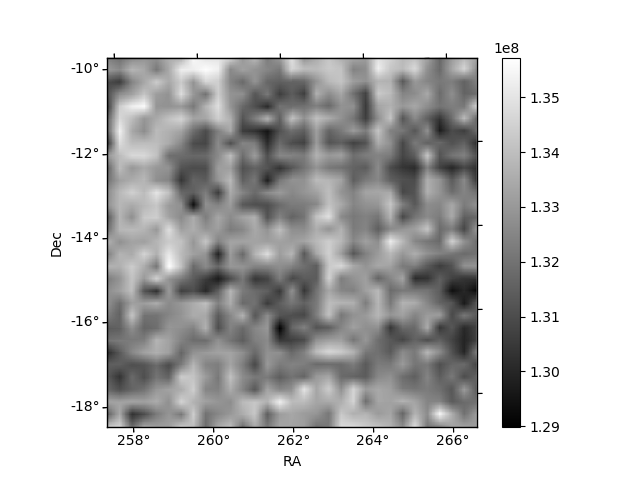
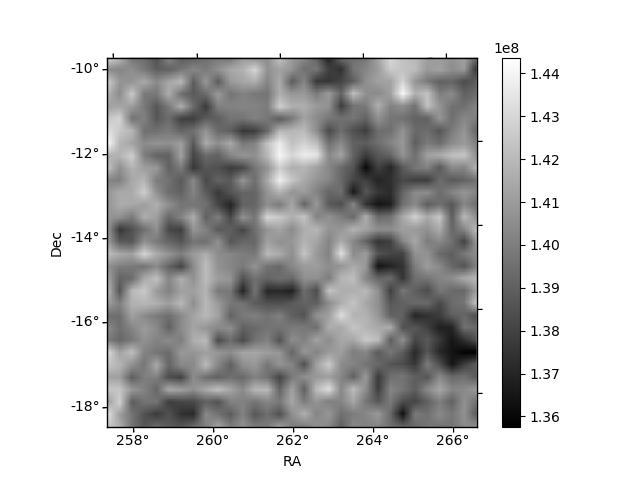
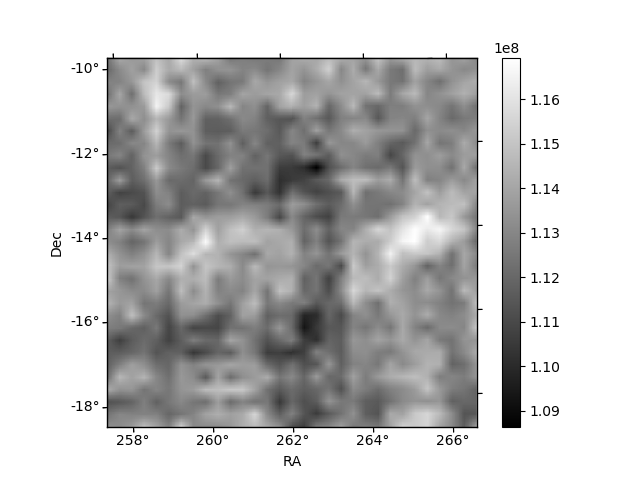
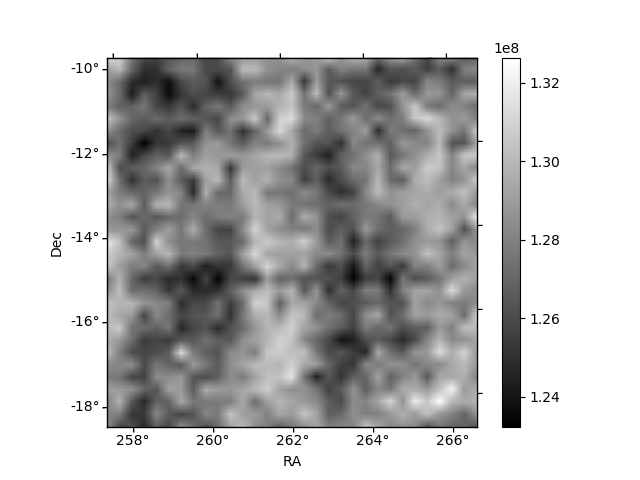
Histogram calculated using DETX and DETY for each event in the final _common_clean file
| Quadrant A | 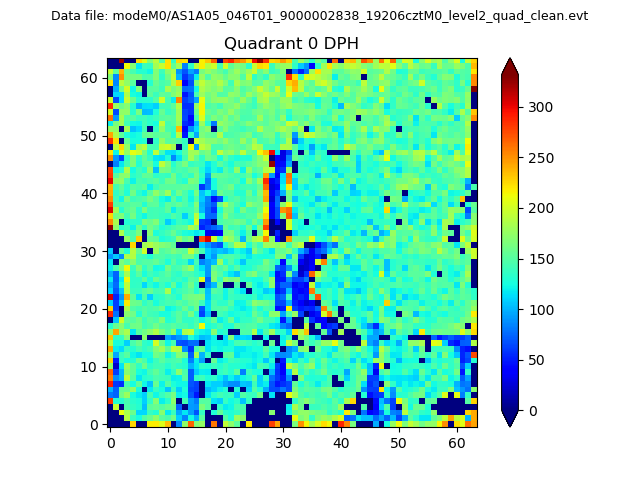 |
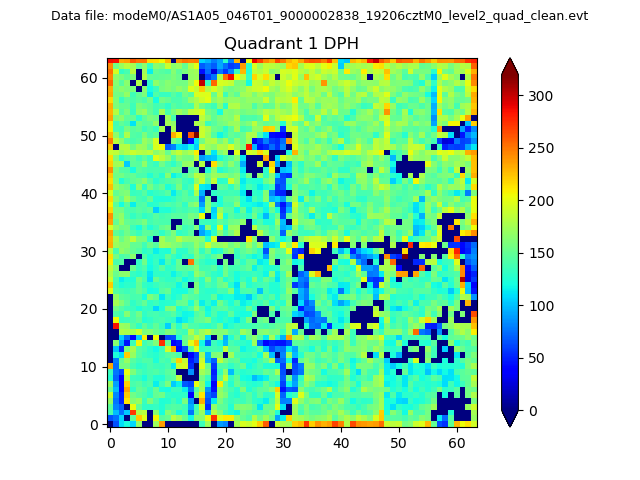 |
Quadrant B |
|---|---|---|---|
| Quadrant D | 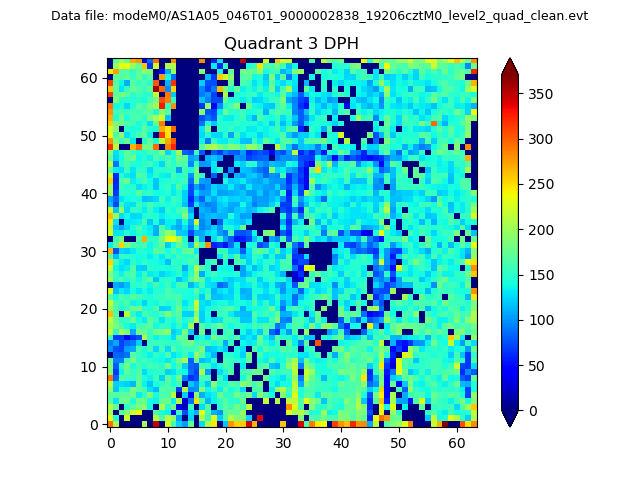 |
 |
Quadrant C |
| Plot type | Count rate plots | Images |
|---|---|---|
| Comparison with Poisson distribution Blue bars denote a histogram of data divided into 1 sec bins. Red curve is a Poisson curve with rate = median count rate of data. |
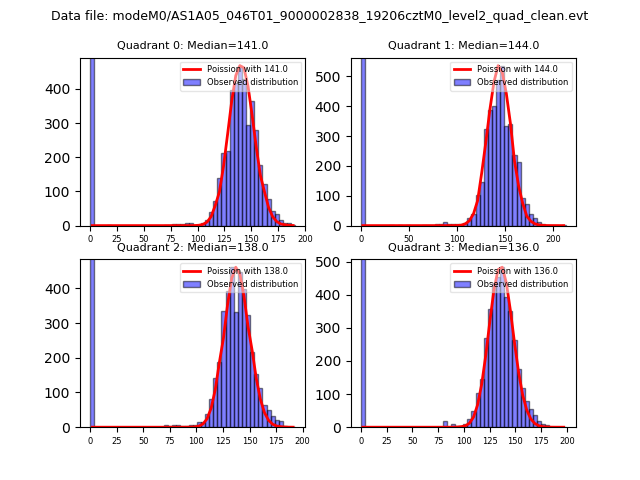 |
 |
| Quadrant-wise count rates Data is divided into 100 sec bins |
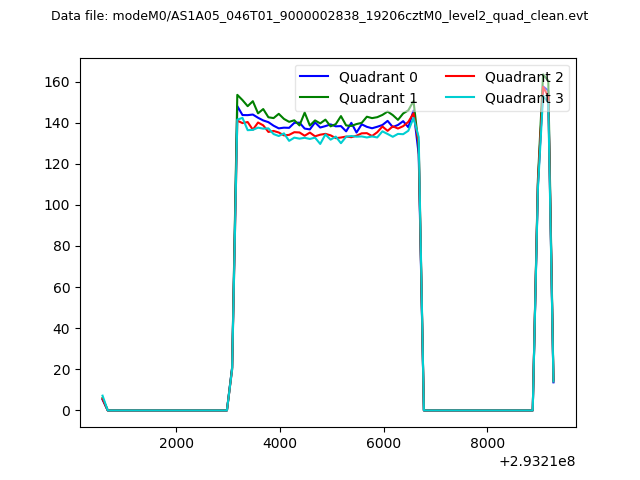 |
|
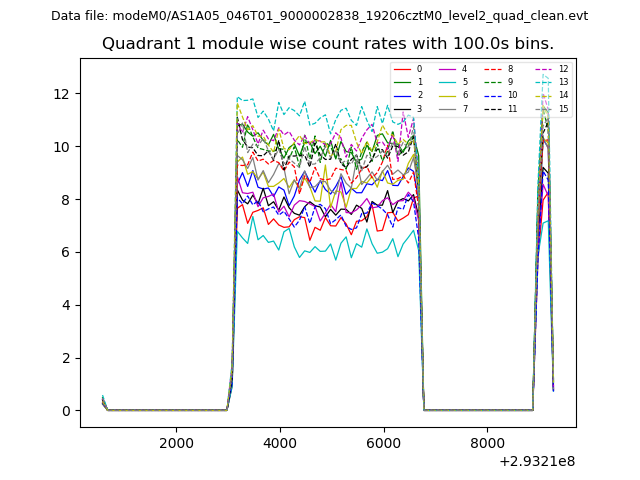
| Module-wise count rates for Quadrant A Data is divided into 100 sec bins |
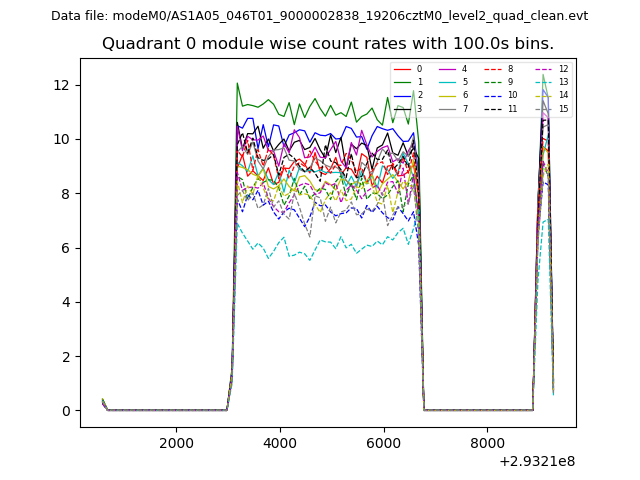 |
 |
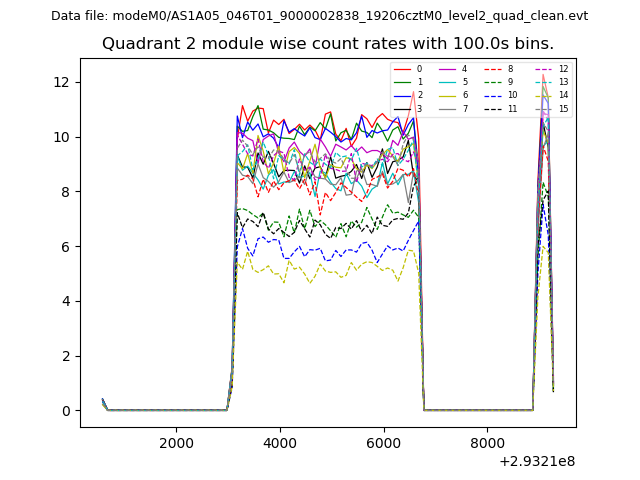
| Module-wise count rates for Quadrant B Data is divided into 100 sec bins |
 |
 |
| Module-wise count rates for Quadrant C Data is divided into 100 sec bins |
 |
 |
| Module-wise count rates for Quadrant D Data is divided into 100 sec bins |
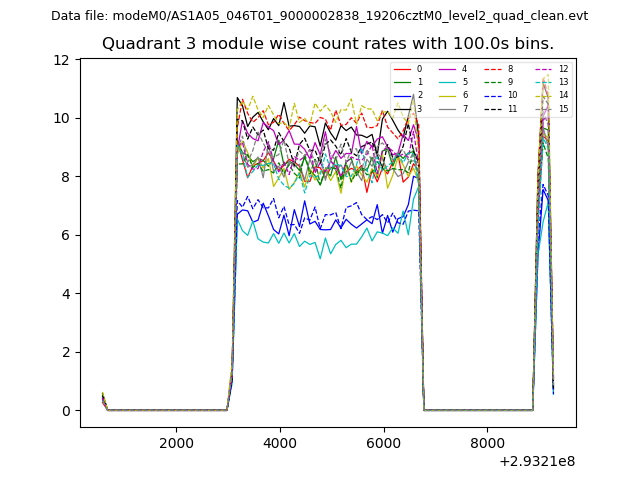 |
 |
| Parameter | Plot |
|---|---|
| CZT HV Monitor | 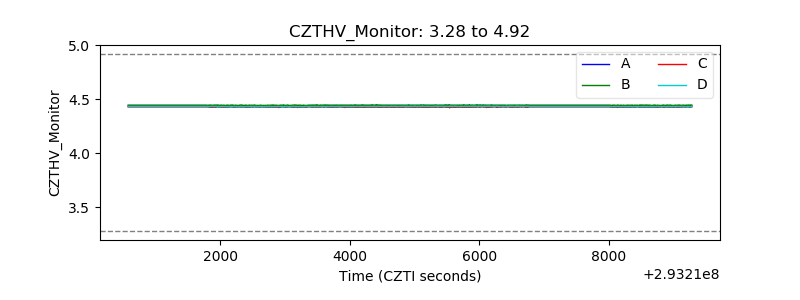 |
| D_VDD | 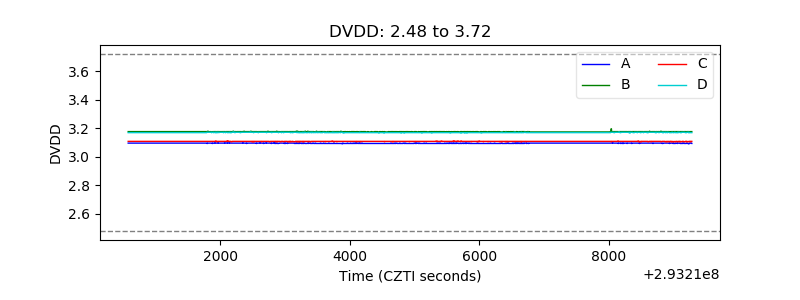 |
| Temperature 1 | 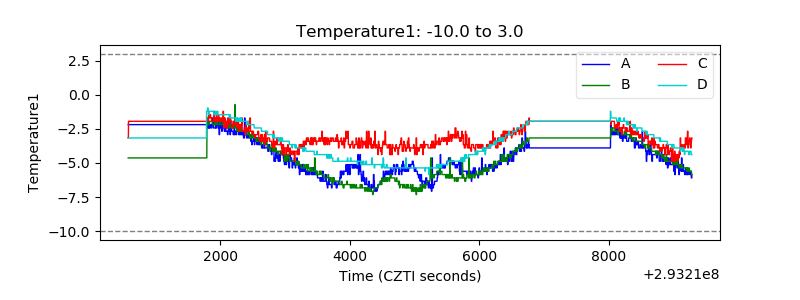 |
| Veto HV Monitor | 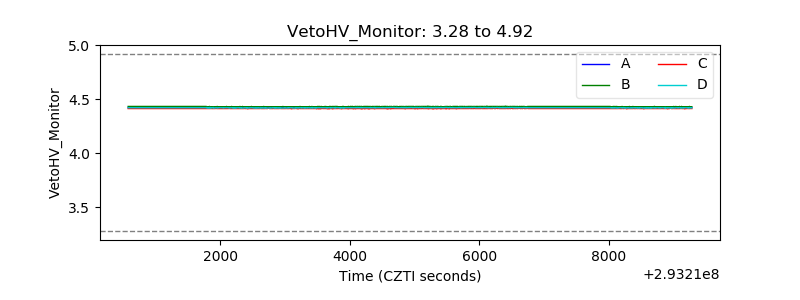 |
| Veto LLD | 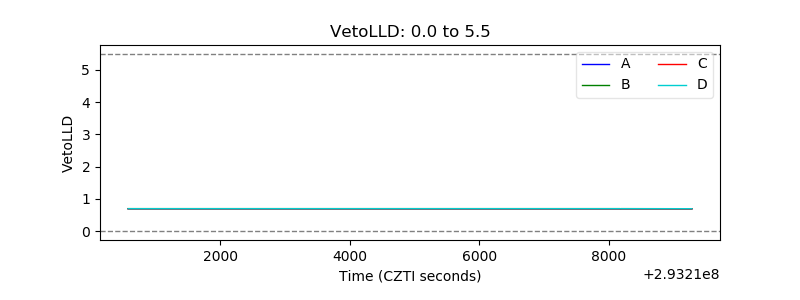 |
| Alpha Counter | 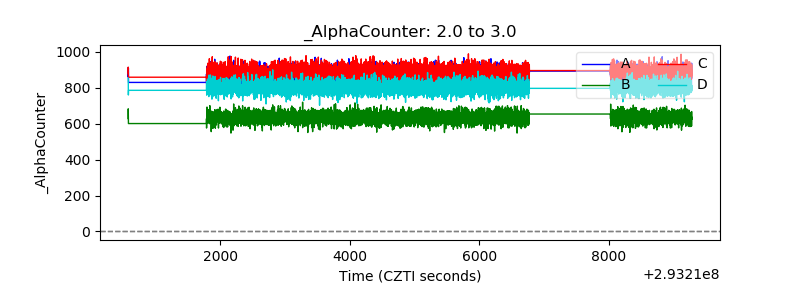 |
| _CPM_Rate | 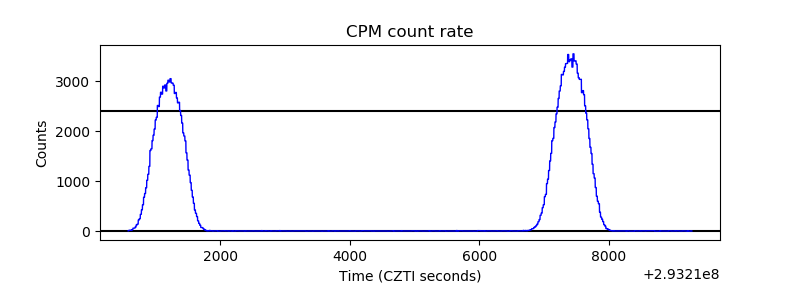 |
| CZT Counter | 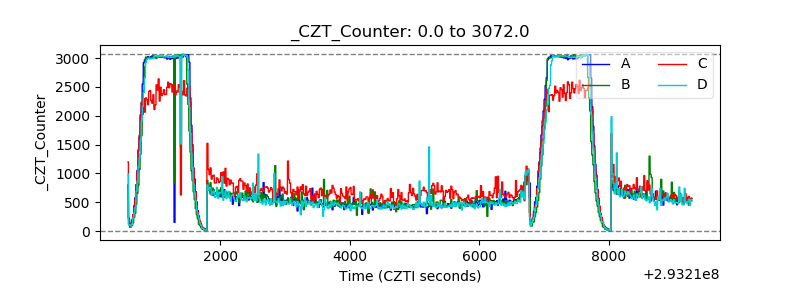 |
| +2.5 Volts monitor | 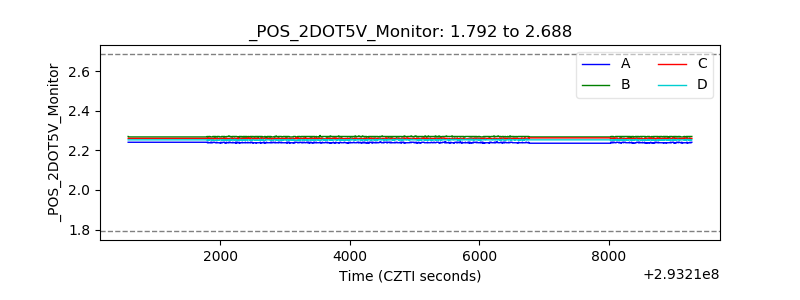 |
| +5 Volts monitor |  |
| _ROLL_ROT | 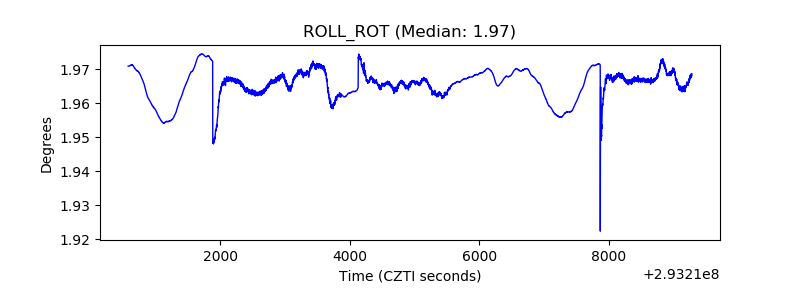 |
| _Roll_DEC | 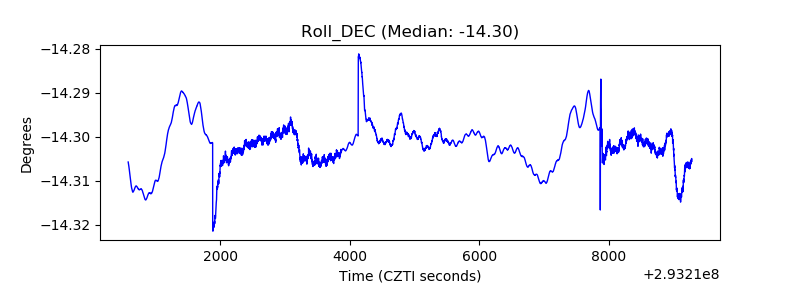 |
| _Roll_RA | 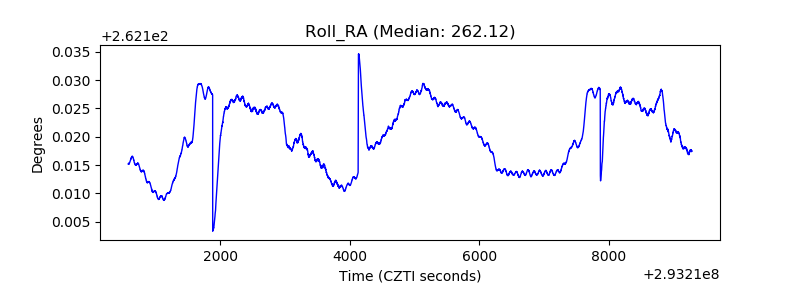 |
| Veto Counter | 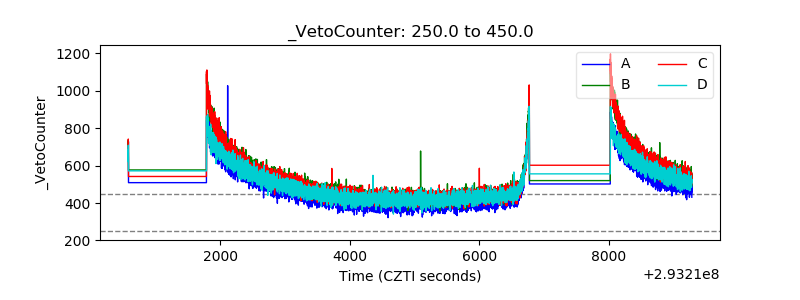 |