| Param | Original file | Final file |
|---|---|---|
| Filename | modeM0/AS1A05_046T01_9000002838_19211cztM0_level2.evt | modeM0/AS1A05_046T01_9000002838_19211cztM0_level2_quad_clean.evt |
| Size (bytes) | 222,603,840 | 57,706,560 |
| Size | 212.3 MB | 55.0 MB |
| Events in quadrant A | 1,514,175 | 374,944 |
| Events in quadrant B | 1,559,351 | 385,470 |
| Events in quadrant C | 1,944,658 | 376,681 |
| Events in quadrant D | 1,487,969 | 366,700 |
| Mode M0 | |||
|---|---|---|---|
| Quadrant | BADHDUFLAG | Total packets | Discarded packets |
| A | 0 | 6979 | 1 |
| B | 0 | 6997 | 1 |
| C | 0 | 7875 | 1 |
| D | 0 | 7000 | 1 |
| Mode SS | |||
|---|---|---|---|
| Quadrant | BADHDUFLAG | Total packets | Discarded packets |
| A | 0 | 68 | 0 |
| B | 0 | 68 | 0 |
| C | 0 | 68 | 0 |
| D | 0 | 68 | 0 |
| Mode M9 | |||
|---|---|---|---|
| Quadrant | BADHDUFLAG | Total packets | Discarded packets |
| A | 0 | 8 | 0 |
| B | 0 | 8 | 0 |
| C | 0 | 8 | 0 |
| D | 0 | 8 | 0 |
| Quadrant | Total seconds | Saturated seconds | Saturation percentage |
|---|---|---|---|
| A | 3437 | 7 | 0.203666% |
| B | 3437 | 7 | 0.203666% |
| C | 3437 | 31 | 0.901949% |
| D | 3437 | 4 | 0.116381% |
Noise dominated data is calculated using 1-second bins in cleaned event files. If a bin has >2000 counts, and if more than 50% of those come from <1% of pixels, then it is considered to be noise-dominated and hence unusable.
| Quadrant | # 1 sec bins | Bins with >0 counts | Bins with >2000 counts | High rate bins dominated by noise | Noise dominated (total time) | Noise dominated (detector-on time) | Marked lightcurve |
|---|---|---|---|---|---|---|---|
| A | 3437 | 3437 | 0 | 0 | 0.00% | 0.00% | 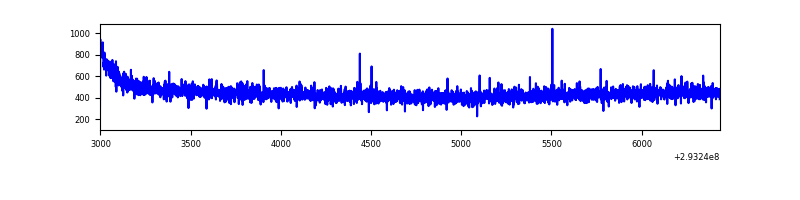 |
| B | 3437 | 3437 | 0 | 0 | 0.00% | 0.00% | 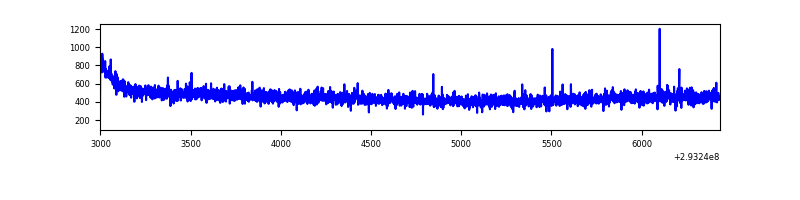 |
| C | 3437 | 3437 | 0 | 0 | 0.00% | 0.00% | 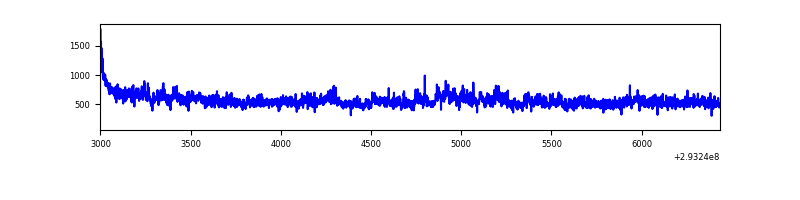 |
| D | 3437 | 3437 | 0 | 0 | 0.00% | 0.00% | 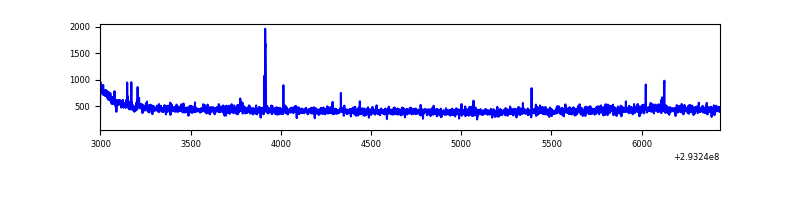 |
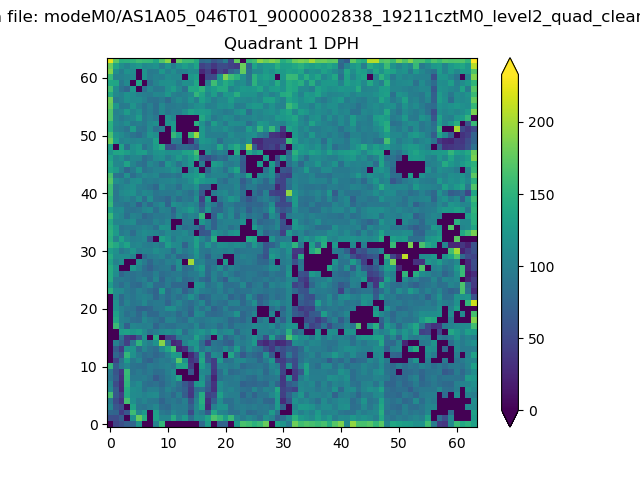
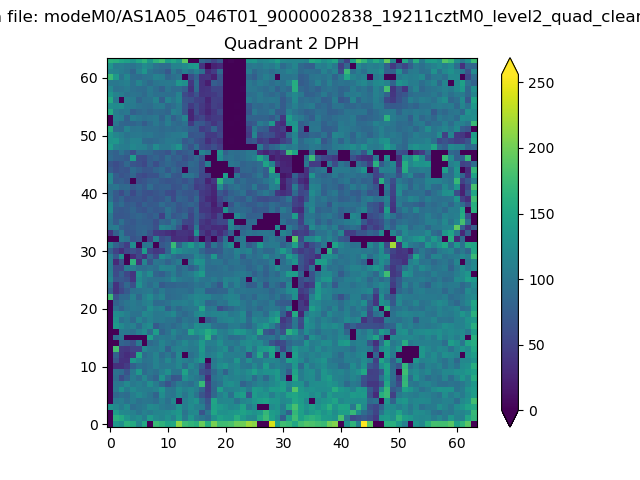
Top three noisy pixels from each quadrant. If the there are fewer than three noisy pixels in the level2.evt file, extra rows are filled as -1
| Pixel properties | Quadrant properties | ||||||
|---|---|---|---|---|---|---|---|
| Quadrant | DetID | PixID | Counts | Sigma | Mean | Median | Sigma |
| A | 13 | 254 | 3978 | 44.23 | 392 | 383 | 81.3 |
| A | 0 | 226 | 3382 | 36.89 | 392 | 383 | 81.3 |
| A | 3 | 137 | 2999 | 32.18 | 392 | 383 | 81.3 |
| B | 12 | 111 | 9259 | 114.93 | 395 | 385 | 77.2 |
| B | 0 | 198 | 8369 | 103.4 | 395 | 385 | 77.2 |
| B | 11 | 111 | 8231 | 101.62 | 395 | 385 | 77.2 |
| C | 3 | 233 | 366032 | 3935.1 | 387 | 390 | 92.9 |
| C | 14 | 238 | 59087 | 631.71 | 387 | 390 | 92.9 |
| C | 7 | 220 | 13075 | 136.52 | 387 | 390 | 92.9 |
| D | 10 | 66 | 14605 | 149.56 | 387 | 377 | 95.1 |
| D | 2 | 234 | 11577 | 117.73 | 387 | 377 | 95.1 |
| D | 13 | 238 | 8068 | 80.85 | 387 | 377 | 95.1 |
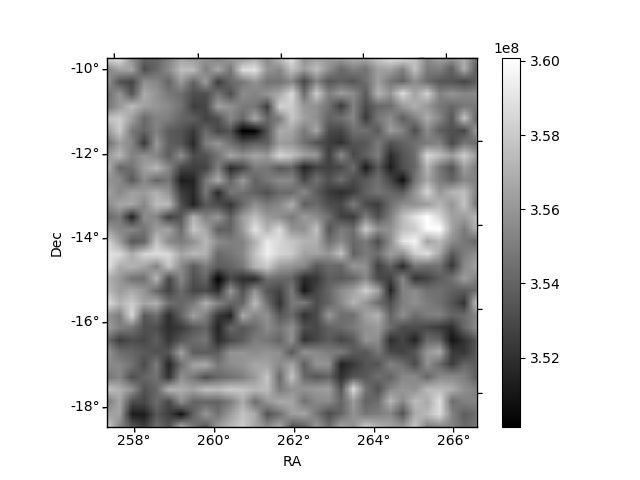
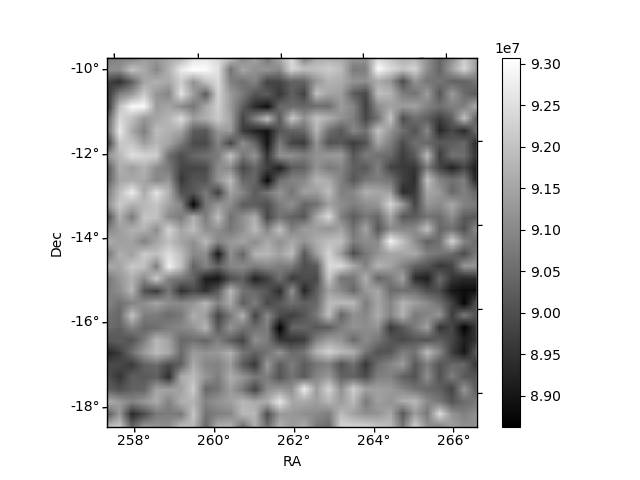
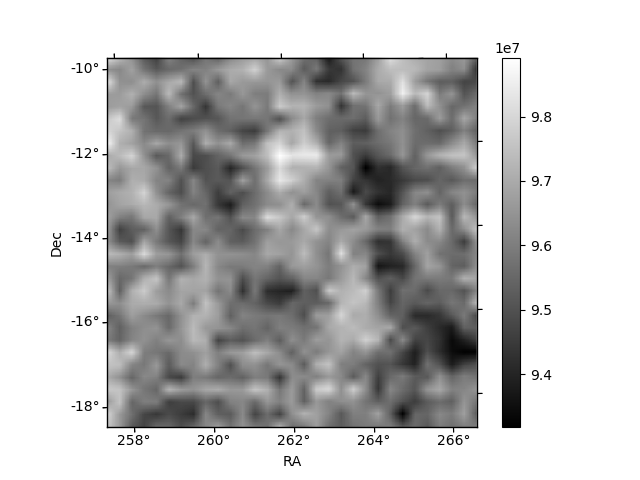
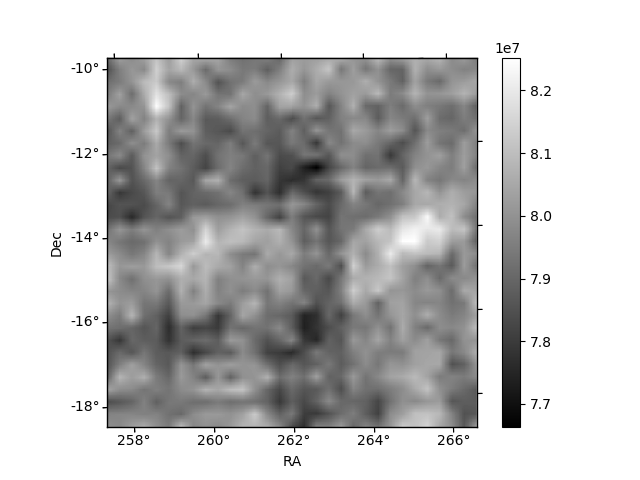
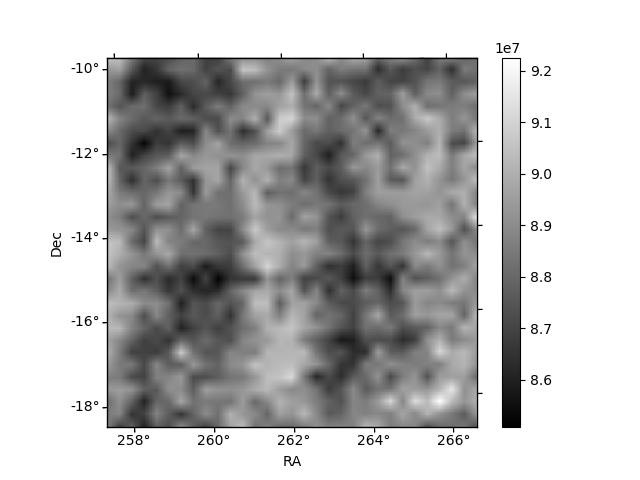
Histogram calculated using DETX and DETY for each event in the final _common_clean file
| Quadrant A | 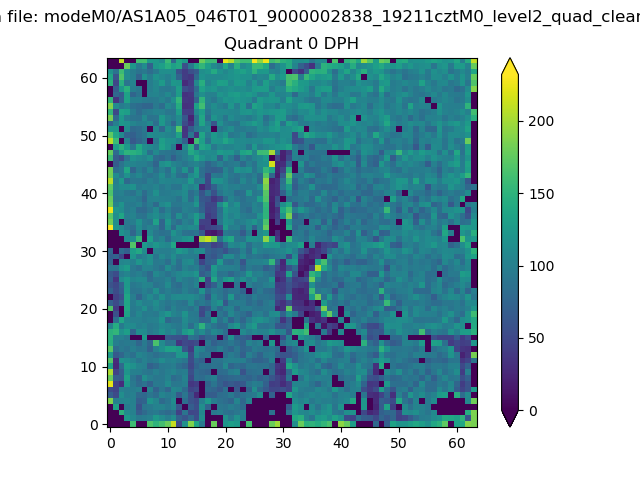 |
 |
Quadrant B |
|---|---|---|---|
| Quadrant D | 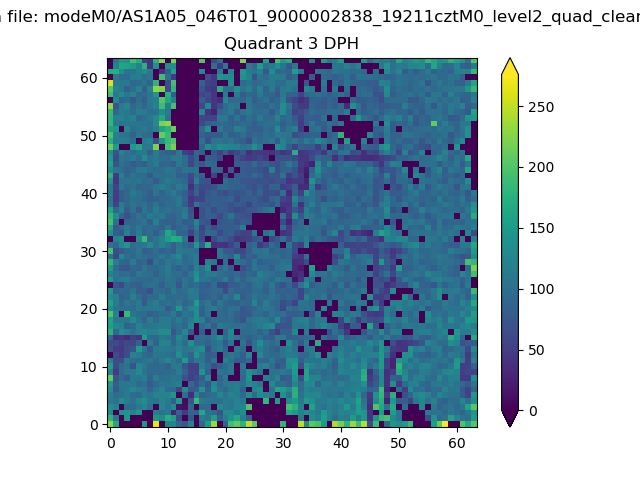 |
 |
Quadrant C |
| Plot type | Count rate plots | Images |
|---|---|---|
| Comparison with Poisson distribution Blue bars denote a histogram of data divided into 1 sec bins. Red curve is a Poisson curve with rate = median count rate of data. |
 |
 |
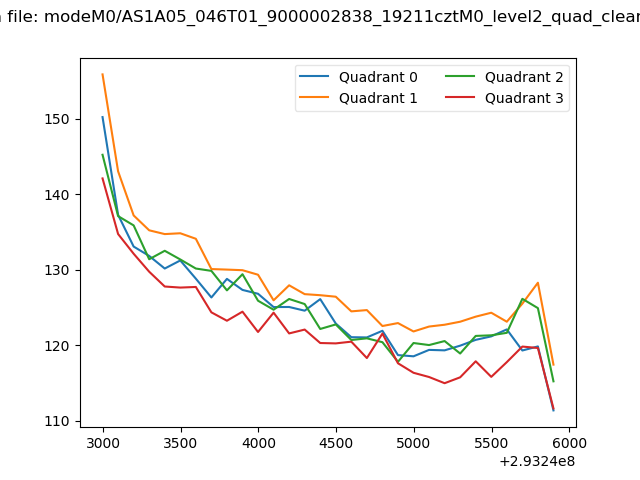
| Quadrant-wise count rates Data is divided into 100 sec bins |
 |
|
| Module-wise count rates for Quadrant A Data is divided into 100 sec bins |
 |
 |
| Module-wise count rates for Quadrant B Data is divided into 100 sec bins |
 |
 |
| Module-wise count rates for Quadrant C Data is divided into 100 sec bins |
 |
 |
| Module-wise count rates for Quadrant D Data is divided into 100 sec bins |
 |
 |
| Parameter | Plot |
|---|---|
| CZT HV Monitor |  |
| D_VDD |  |
| Temperature 1 | 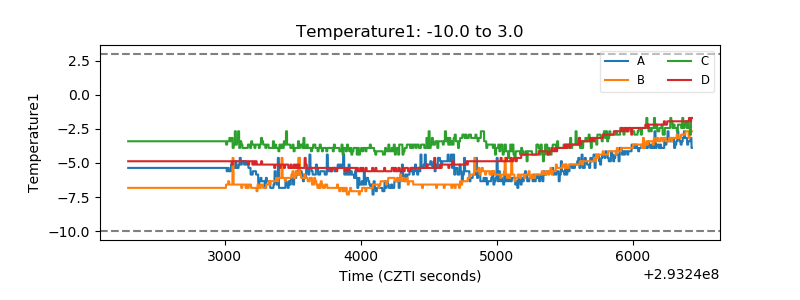 |
| Veto HV Monitor | 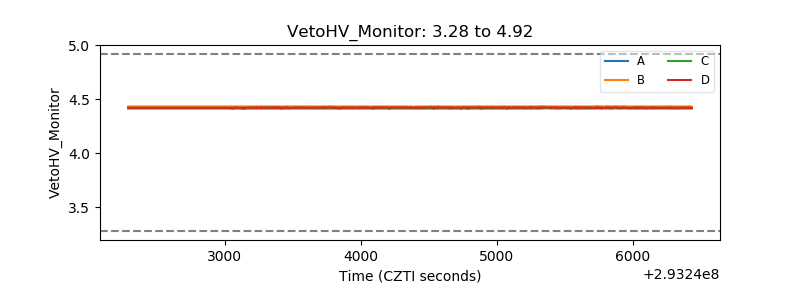 |
| Veto LLD |  |
| Alpha Counter | 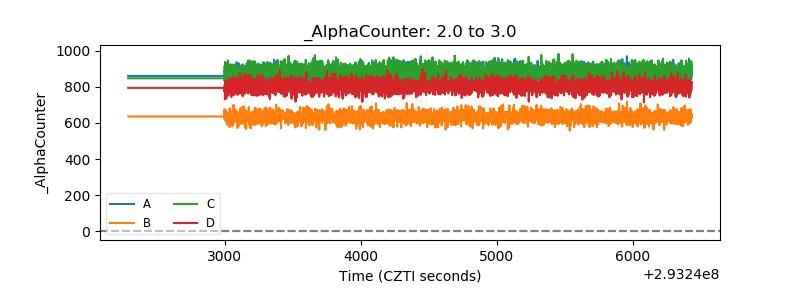 |
| _CPM_Rate | 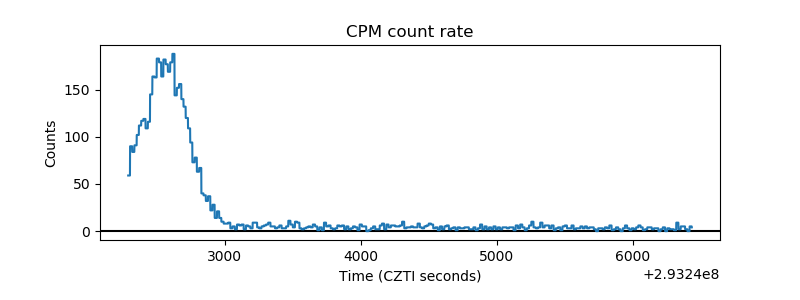 |
| CZT Counter | 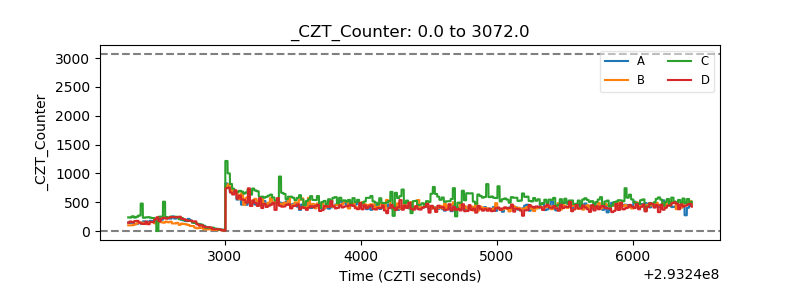 |
| +2.5 Volts monitor |  |
| +5 Volts monitor | 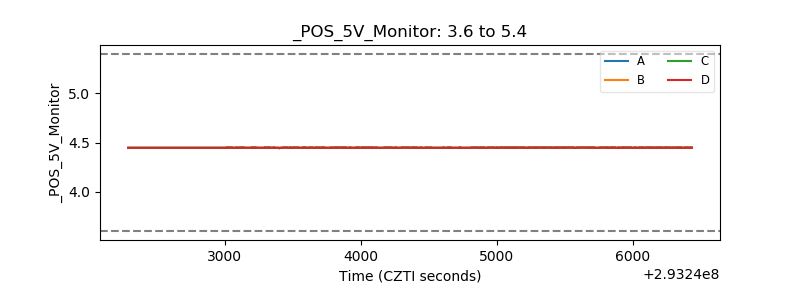 |
| _ROLL_ROT |  |
| _Roll_DEC | 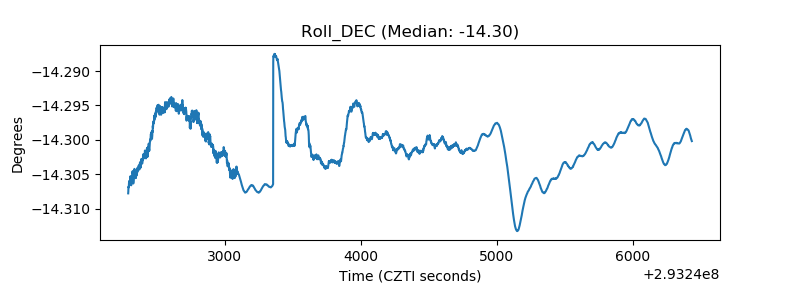 |
| _Roll_RA | 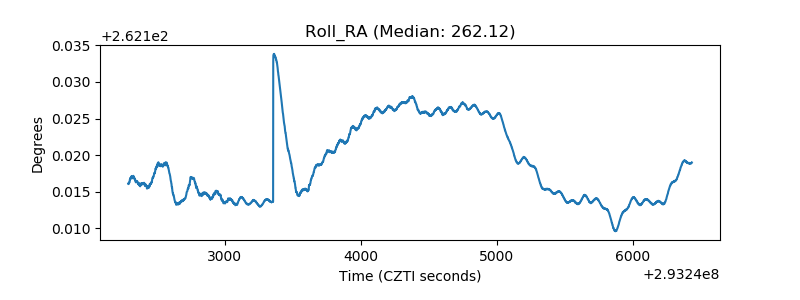 |
| Veto Counter |  |