| Param | Original file | Final file |
|---|---|---|
| Filename | modeM0/AS1A05_007T06_9000002844cztM0_level2.fits | modeM0/AS1A05_007T06_9000002844cztM0_level2_quad_clean.evt |
| Size (bytes) | 489,614,400 | 509,518,080 |
| Size | 466.9 MB | 485.9 MB |
| Events in quadrant A | 2,958,582 | 3,048,046 |
| Events in quadrant B | 2,872,140 | 3,102,644 |
| Events in quadrant C | 2,927,226 | 3,008,875 |
| Events in quadrant D | 2,546,434 | 2,748,148 |
| Mode SS | |||
|---|---|---|---|
| Quadrant | BADHDUFLAG | Total packets | Discarded packets |
| A | 0 | 1042 | 0 |
| B | 0 | 1042 | 0 |
| C | 0 | 1042 | 0 |
| D | 0 | 1042 | 0 |
| Mode M9 | |||
|---|---|---|---|
| Quadrant | BADHDUFLAG | Total packets | Discarded packets |
| A | 0 | 67 | 0 |
| B | 0 | 67 | 0 |
| C | 0 | 67 | 0 |
| D | 0 | 67 | 0 |
| Mode M0 | |||
|---|---|---|---|
| Quadrant | BADHDUFLAG | Total packets | Discarded packets |
| A | 0 | 106171 | 0 |
| B | 0 | 106468 | 0 |
| C | 0 | 122492 | 0 |
| D | 0 | 117179 | 0 |
| Quadrant | Total seconds | Saturated seconds | Saturation percentage |
|---|---|---|---|
| A | 51366 | 534 | 1.039598% |
| B | 51366 | 597 | 1.162247% |
| C | 51366 | 980 | 1.907877% |
| D | 51366 | 1275 | 2.482187% |
Noise dominated data is calculated using 1-second bins in cleaned event files. If a bin has >2000 counts, and if more than 50% of those come from <1% of pixels, then it is considered to be noise-dominated and hence unusable.
| Quadrant | # 1 sec bins | Bins with >0 counts | Bins with >2000 counts | High rate bins dominated by noise | Noise dominated (total time) | Noise dominated (detector-on time) | Marked lightcurve |
|---|---|---|---|---|---|---|---|
| A | 57871 | 51363 | 0 | 0 | 0.00% | 0.00% |  |
| B | 57871 | 51365 | 0 | 0 | 0.00% | 0.00% |  |
| C | 57871 | 51365 | 0 | 0 | 0.00% | 0.00% |  |
| D | 57871 | 51347 | 0 | 0 | 0.00% | 0.00% |  |
Top three noisy pixels from each quadrant. If the there are fewer than three noisy pixels in the level2.evt file, extra rows are filled as -1
| Pixel properties | Quadrant properties | ||||||
|---|---|---|---|---|---|---|---|
| Quadrant | DetID | PixID | Counts | Sigma | Mean | Median | Sigma |
| A | 0 | 29 | 2792 | 10.73 | 770 | 722 | 192.8 |
| A | 7 | 110 | 2395 | 8.68 | 770 | 722 | 192.8 |
| A | 0 | 30 | 2223 | 7.78 | 770 | 722 | 192.8 |
| B | 2 | 9 | 2305 | 10.62 | 758 | 722 | 149.1 |
| B | 2 | 8 | 1984 | 8.46 | 758 | 722 | 149.1 |
| B | 3 | 17 | 1931 | 8.11 | 758 | 722 | 149.1 |
| C | 1 | 80 | 2143 | 7.19 | 771 | 723 | 197.4 |
| C | 1 | 81 | 2133 | 7.14 | 771 | 723 | 197.4 |
| C | 12 | 241 | 2055 | 6.75 | 771 | 723 | 197.4 |
| D | 3 | 14 | 1948 | 6.64 | 725 | 661 | 193.9 |
| D | 10 | 190 | 1933 | 6.56 | 725 | 661 | 193.9 |
| D | 6 | 67 | 1862 | 6.19 | 725 | 661 | 193.9 |
Histogram calculated using DETX and DETY for each event in the final _common_clean file
| Quadrant A |  |
 |
Quadrant B |
|---|---|---|---|
| Quadrant D |  |
 |
Quadrant C |
| Plot type | Count rate plots | Images |
|---|---|---|
| Comparison with Poisson distribution Blue bars denote a histogram of data divided into 1 sec bins. Red curve is a Poisson curve with rate = median count rate of data. |
 |
 |
| Quadrant-wise count rates Data is divided into 100 sec bins |
 |
|
| Module-wise count rates for Quadrant A Data is divided into 100 sec bins |
 |
 |
| Module-wise count rates for Quadrant B Data is divided into 100 sec bins |
 |
 |
| Module-wise count rates for Quadrant C Data is divided into 100 sec bins |
 |
 |
| Module-wise count rates for Quadrant D Data is divided into 100 sec bins |
 |
 |
| Parameter | Plot |
|---|---|
| CZT HV Monitor |  |
| D_VDD | 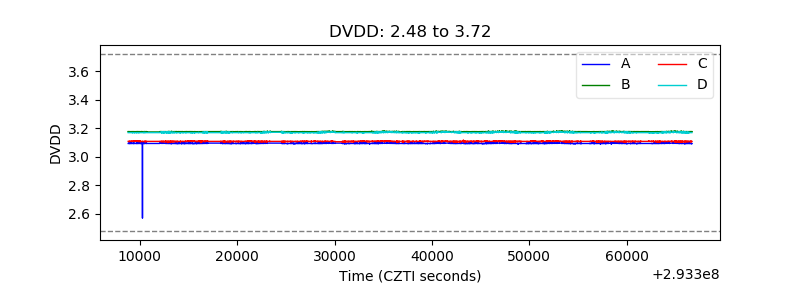 |
| Temperature 1 |  |
| Veto HV Monitor |  |
| Veto LLD |  |
| Alpha Counter |  |
| _CPM_Rate |  |
| CZT Counter |  |
| +2.5 Volts monitor |  |
| +5 Volts monitor | 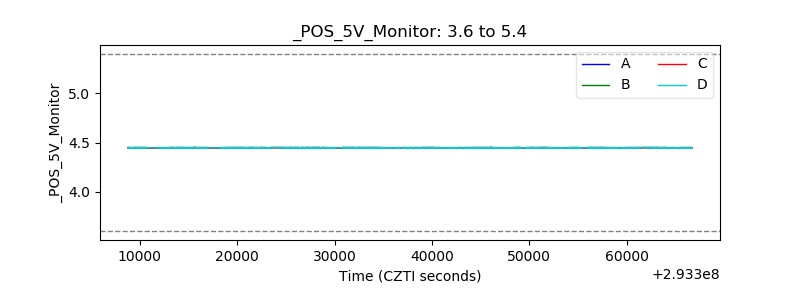 |
| _ROLL_ROT |  |
| _Roll_DEC |  |
| _Roll_RA |  |
| Veto Counter |  |