| Param | Original file | Final file |
|---|---|---|
| Filename | modeM0/AS1A05_007T06_9000002844_19222cztM0_level2.evt | modeM0/AS1A05_007T06_9000002844_19222cztM0_level2_quad_clean.evt |
| Size (bytes) | 233,881,920 | 60,361,920 |
| Size | 223.0 MB | 57.6 MB |
| Events in quadrant A | 1,650,423 | 398,873 |
| Events in quadrant B | 1,658,258 | 413,916 |
| Events in quadrant C | 1,951,953 | 401,474 |
| Events in quadrant D | 1,608,485 | 391,368 |
| Mode SS | |||
|---|---|---|---|
| Quadrant | BADHDUFLAG | Total packets | Discarded packets |
| A | 0 | 64 | 0 |
| B | 0 | 64 | 0 |
| C | 0 | 64 | 0 |
| D | 0 | 64 | 0 |
| Mode M9 | |||
|---|---|---|---|
| Quadrant | BADHDUFLAG | Total packets | Discarded packets |
| A | 0 | 13 | 0 |
| B | 0 | 13 | 0 |
| C | 0 | 13 | 0 |
| D | 0 | 13 | 0 |
| Mode M0 | |||
|---|---|---|---|
| Quadrant | BADHDUFLAG | Total packets | Discarded packets |
| A | 0 | 6881 | 1 |
| B | 0 | 6917 | 1 |
| C | 0 | 8036 | 1 |
| D | 0 | 6819 | 1 |
| Quadrant | Total seconds | Saturated seconds | Saturation percentage |
|---|---|---|---|
| A | 3125 | 76 | 2.432000% |
| B | 3125 | 81 | 2.592000% |
| C | 3124 | 126 | 4.033291% |
| D | 3124 | 62 | 1.984635% |
Noise dominated data is calculated using 1-second bins in cleaned event files. If a bin has >2000 counts, and if more than 50% of those come from <1% of pixels, then it is considered to be noise-dominated and hence unusable.
| Quadrant | # 1 sec bins | Bins with >0 counts | Bins with >2000 counts | High rate bins dominated by noise | Noise dominated (total time) | Noise dominated (detector-on time) | Marked lightcurve |
|---|---|---|---|---|---|---|---|
| A | 4460 | 3126 | 4 | 4 | 0.09% | 0.13% | 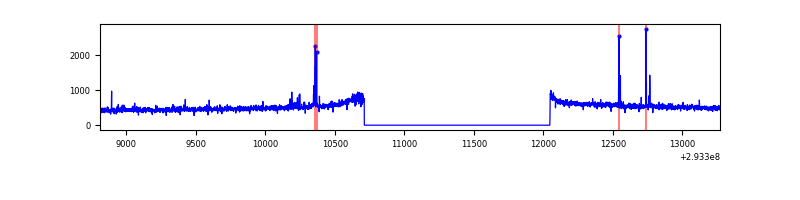 |
| B | 4460 | 3126 | 0 | 0 | 0.00% | 0.00% | 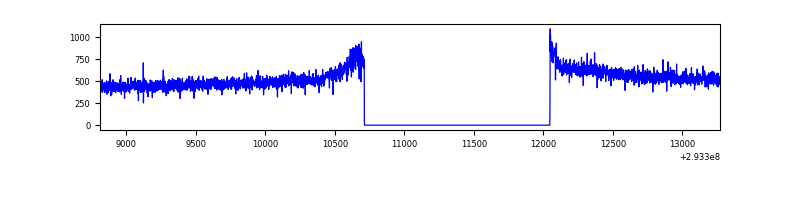 |
| C | 4459 | 3125 | 1 | 1 | 0.02% | 0.03% | 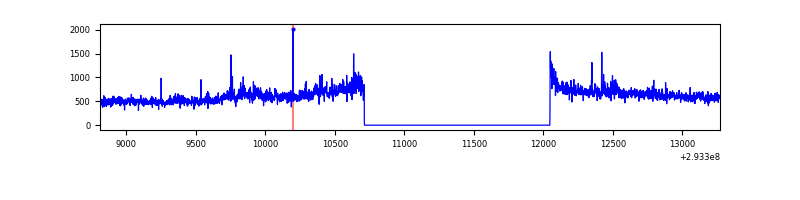 |
| D | 4459 | 3125 | 3 | 3 | 0.07% | 0.10% | 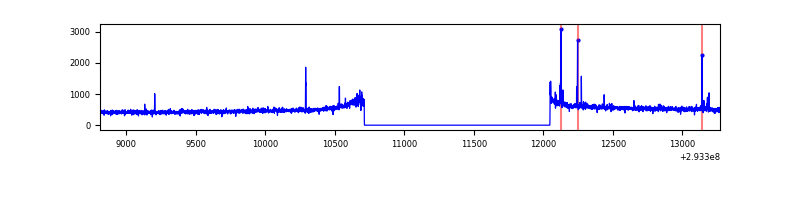 |
Top three noisy pixels from each quadrant. If the there are fewer than three noisy pixels in the level2.evt file, extra rows are filled as -1
| Pixel properties | Quadrant properties | ||||||
|---|---|---|---|---|---|---|---|
| Quadrant | DetID | PixID | Counts | Sigma | Mean | Median | Sigma |
| A | 9 | 143 | 33233 | 385.44 | 419 | 411 | 85.2 |
| A | 11 | 29 | 4284 | 45.48 | 419 | 411 | 85.2 |
| A | 13 | 254 | 4268 | 45.29 | 419 | 411 | 85.2 |
| B | 12 | 111 | 9231 | 110.71 | 422 | 411 | 79.7 |
| B | 0 | 229 | 8326 | 99.35 | 422 | 411 | 79.7 |
| B | 11 | 111 | 8086 | 96.34 | 422 | 411 | 79.7 |
| C | 3 | 233 | 285002 | 2980.38 | 409 | 412 | 95.5 |
| C | 14 | 238 | 64249 | 668.54 | 409 | 412 | 95.5 |
| C | 0 | 207 | 2910 | 26.16 | 409 | 412 | 95.5 |
| D | 1 | 52 | 18521 | 182.16 | 414 | 403 | 99.5 |
| D | 11 | 176 | 17968 | 176.6 | 414 | 403 | 99.5 |
| D | 2 | 234 | 12099 | 117.59 | 414 | 403 | 99.5 |
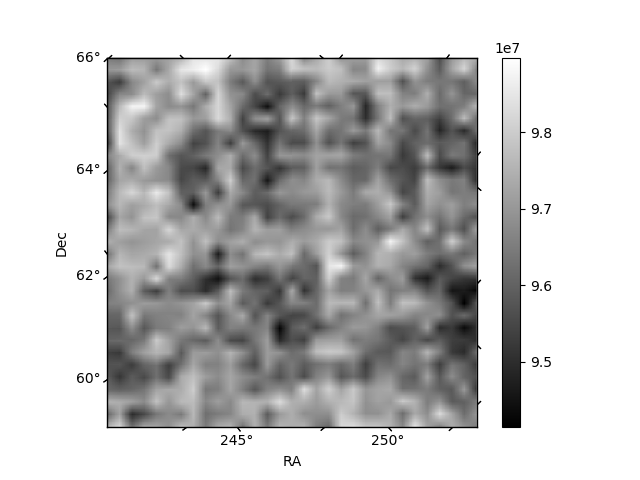
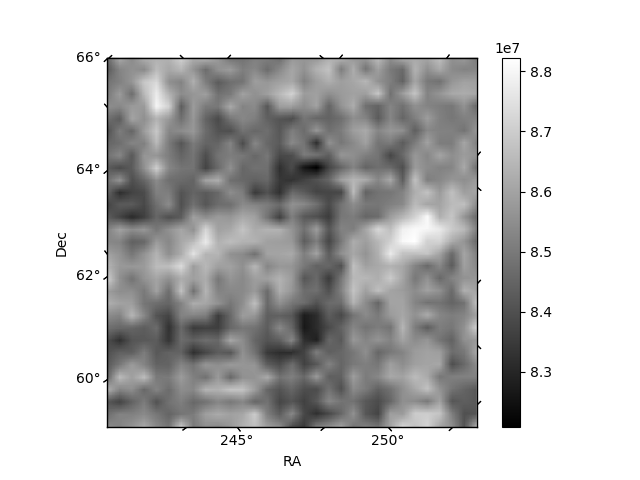
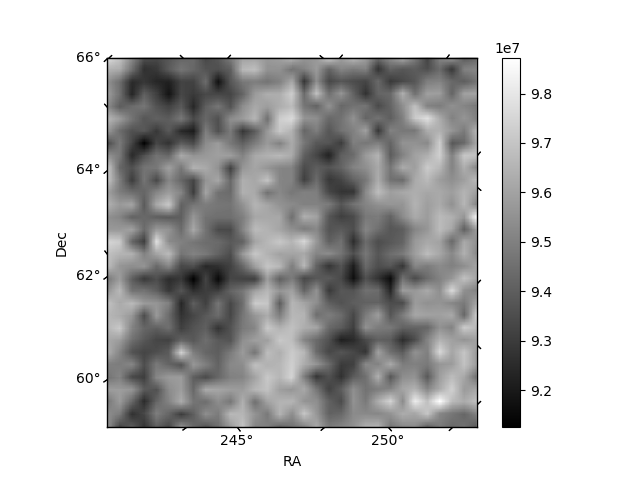
Histogram calculated using DETX and DETY for each event in the final _common_clean file
| Quadrant A | 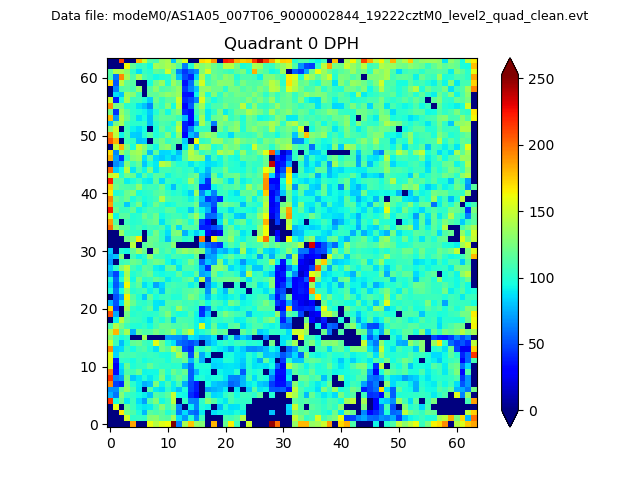 |
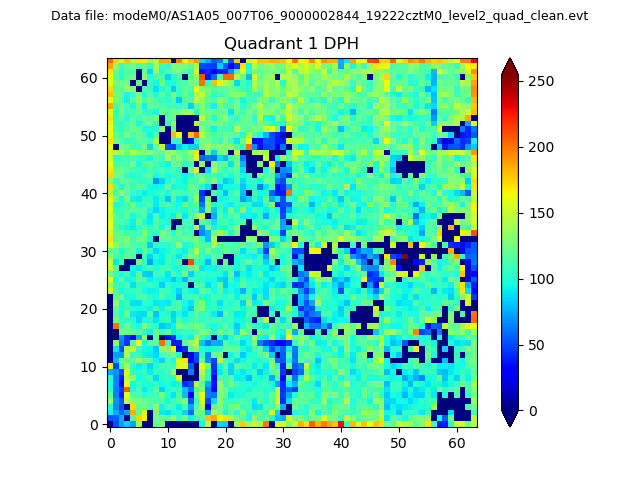 |
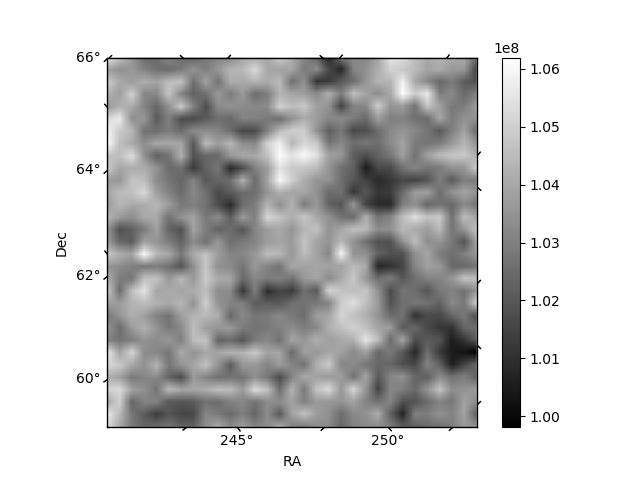
Quadrant B |
|---|---|---|---|
| Quadrant D | 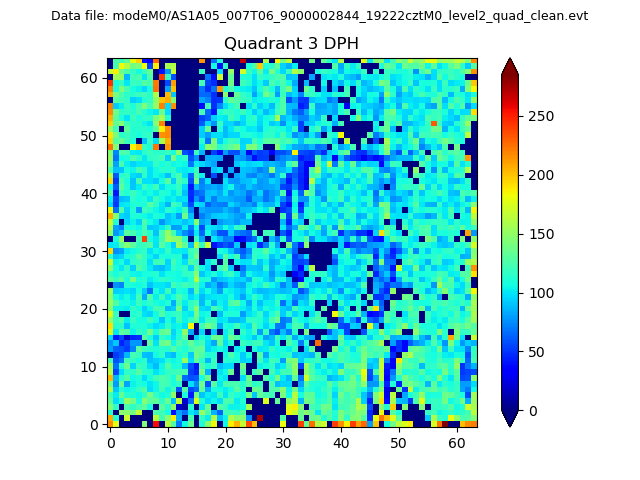 |
 |
Quadrant C |
| Plot type | Count rate plots | Images |
|---|---|---|
| Comparison with Poisson distribution Blue bars denote a histogram of data divided into 1 sec bins. Red curve is a Poisson curve with rate = median count rate of data. |
 |
 |
| Quadrant-wise count rates Data is divided into 100 sec bins |
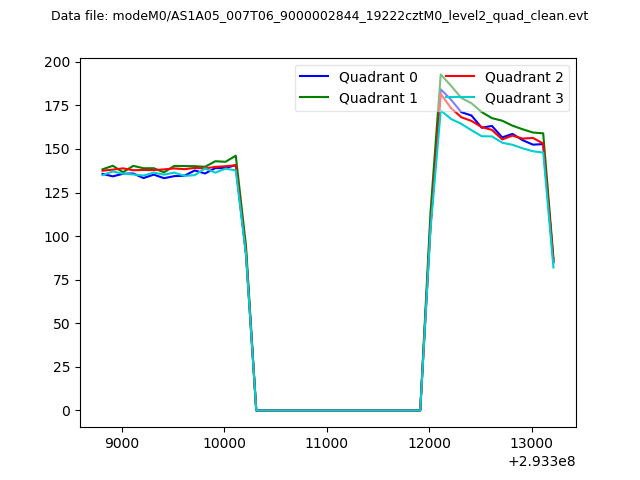 |
|
| Module-wise count rates for Quadrant A Data is divided into 100 sec bins |
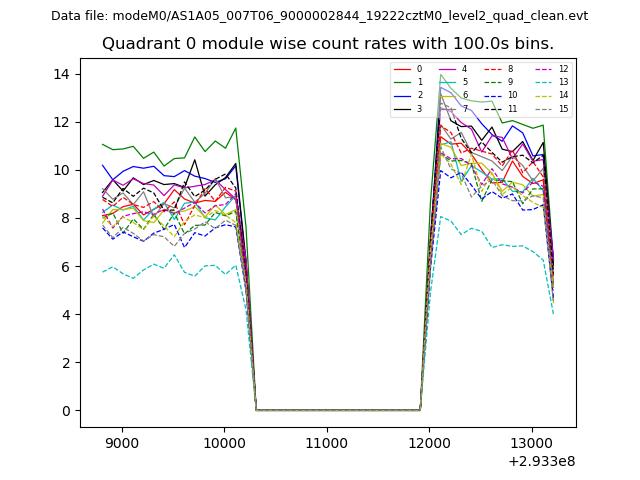 |
 |
| Module-wise count rates for Quadrant B Data is divided into 100 sec bins |
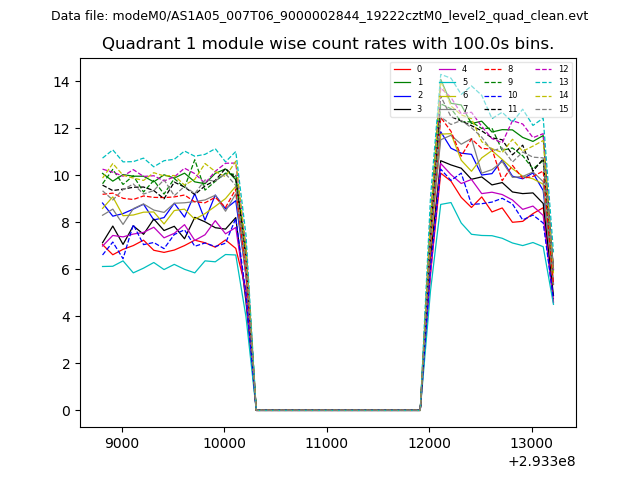 |
 |
| Module-wise count rates for Quadrant C Data is divided into 100 sec bins |
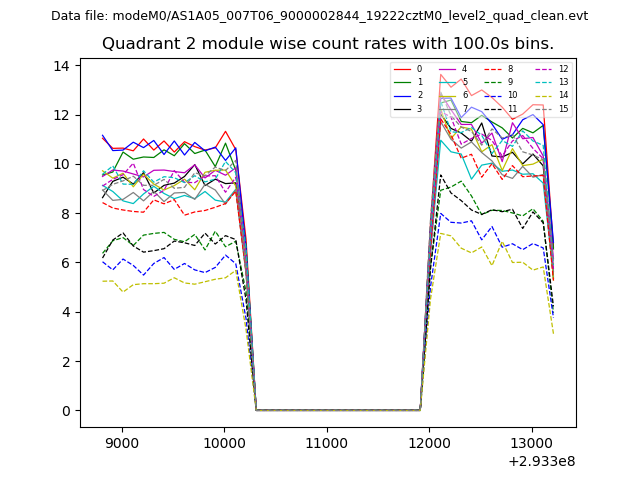 |
 |
| Module-wise count rates for Quadrant D Data is divided into 100 sec bins |
 |
 |
| Parameter | Plot |
|---|---|
| CZT HV Monitor | 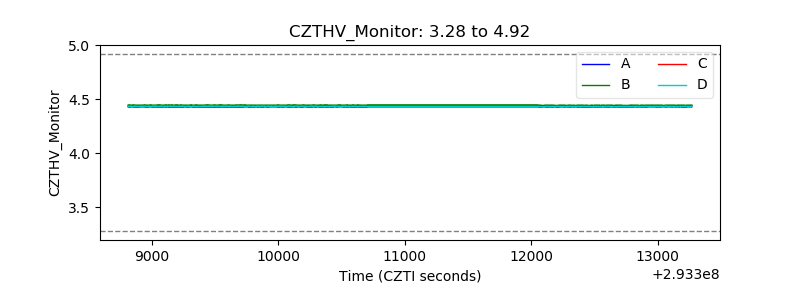 |
| D_VDD | 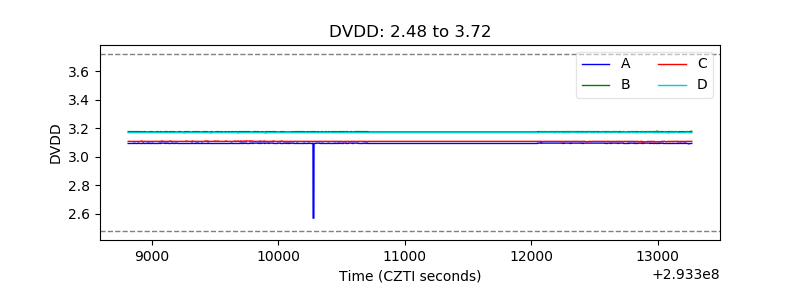 |
| Temperature 1 | 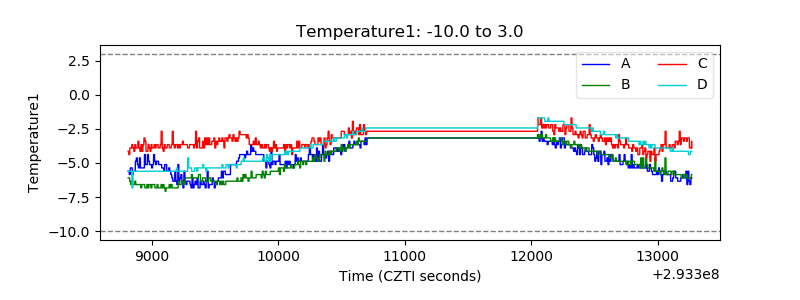 |
| Veto HV Monitor | 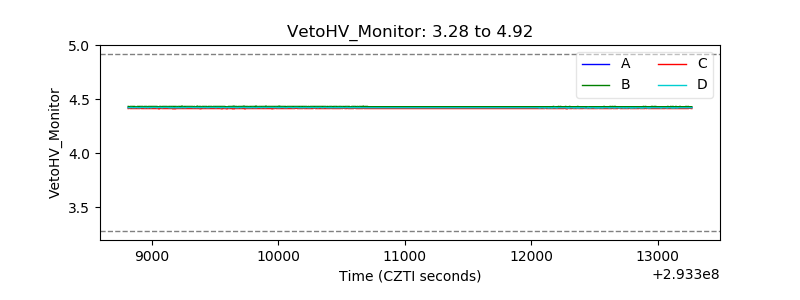 |
| Veto LLD | 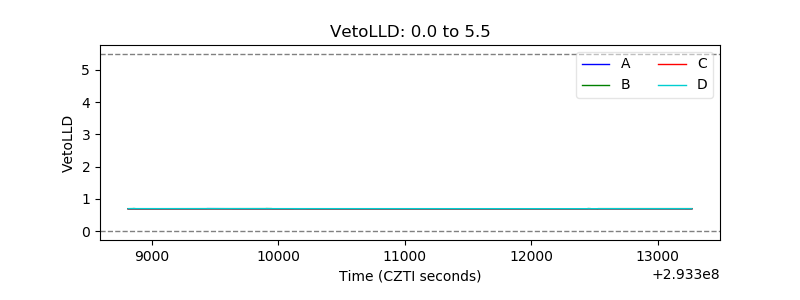 |
| Alpha Counter | 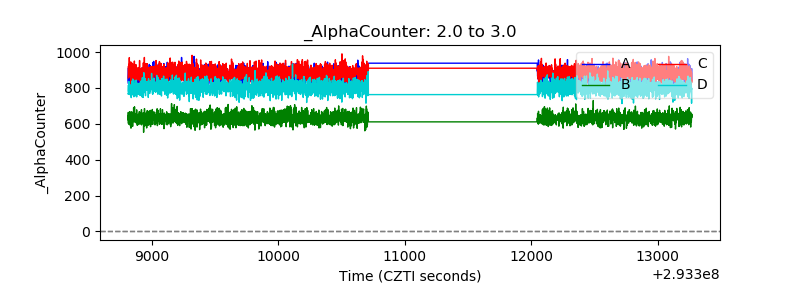 |
| _CPM_Rate | 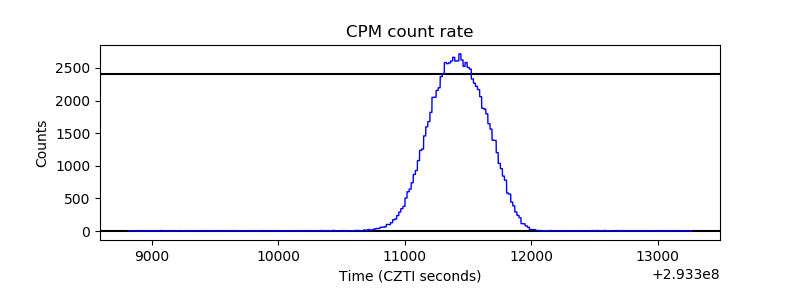 |
| CZT Counter |  |
| +2.5 Volts monitor |  |
| +5 Volts monitor |  |
| _ROLL_ROT |  |
| _Roll_DEC |  |
| _Roll_RA |  |
| Veto Counter |  |