| Param | Original file | Final file |
|---|---|---|
| Filename | modeM0/AS1A05_007T06_9000002844_19223cztM0_level2.evt | modeM0/AS1A05_007T06_9000002844_19223cztM0_level2_quad_clean.evt |
| Size (bytes) | 463,392,000 | 116,150,400 |
| Size | 441.9 MB | 110.8 MB |
| Events in quadrant A | 3,091,787 | 765,212 |
| Events in quadrant B | 3,173,241 | 795,884 |
| Events in quadrant C | 3,732,988 | 774,618 |
| Events in quadrant D | 3,611,082 | 745,802 |
| Mode SS | |||
|---|---|---|---|
| Quadrant | BADHDUFLAG | Total packets | Discarded packets |
| A | 0 | 130 | 0 |
| B | 0 | 130 | 0 |
| C | 0 | 130 | 0 |
| D | 0 | 130 | 0 |
| Mode M9 | |||
|---|---|---|---|
| Quadrant | BADHDUFLAG | Total packets | Discarded packets |
| A | 0 | 26 | 0 |
| B | 0 | 26 | 0 |
| C | 0 | 26 | 0 |
| D | 0 | 26 | 0 |
| Mode M0 | |||
|---|---|---|---|
| Quadrant | BADHDUFLAG | Total packets | Discarded packets |
| A | 0 | 13284 | 2 |
| B | 0 | 13456 | 2 |
| C | 0 | 15289 | 2 |
| D | 0 | 14895 | 2 |
| Quadrant | Total seconds | Saturated seconds | Saturation percentage |
|---|---|---|---|
| A | 6249 | 86 | 1.376220% |
| B | 6249 | 111 | 1.776284% |
| C | 6249 | 183 | 2.928469% |
| D | 6249 | 204 | 3.264522% |
Noise dominated data is calculated using 1-second bins in cleaned event files. If a bin has >2000 counts, and if more than 50% of those come from <1% of pixels, then it is considered to be noise-dominated and hence unusable.
| Quadrant | # 1 sec bins | Bins with >0 counts | Bins with >2000 counts | High rate bins dominated by noise | Noise dominated (total time) | Noise dominated (detector-on time) | Marked lightcurve |
|---|---|---|---|---|---|---|---|
| A | 8874 | 6251 | 2 | 2 | 0.02% | 0.03% | 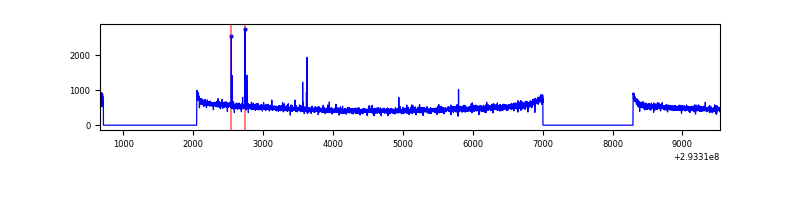 |
| B | 8874 | 6251 | 1 | 1 | 0.01% | 0.02% | 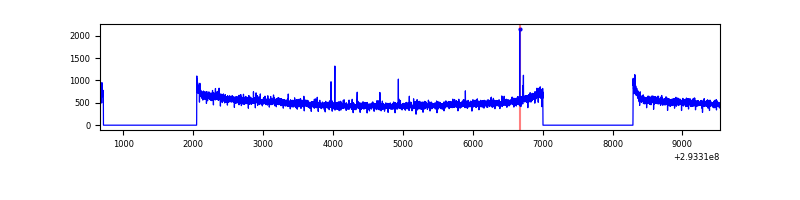 |
| C | 8874 | 6251 | 1 | 1 | 0.01% | 0.02% | 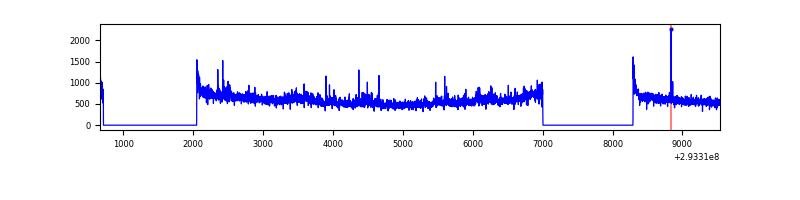 |
| D | 8874 | 6251 | 131 | 131 | 1.48% | 2.10% | 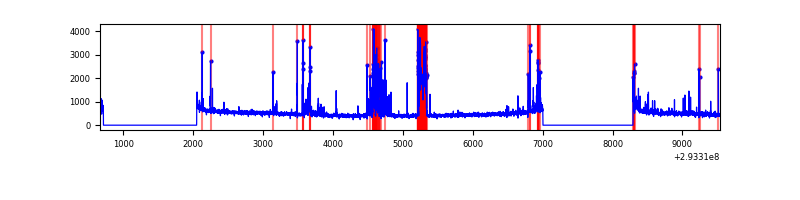 |
Top three noisy pixels from each quadrant. If the there are fewer than three noisy pixels in the level2.evt file, extra rows are filled as -1
| Pixel properties | Quadrant properties | ||||||
|---|---|---|---|---|---|---|---|
| Quadrant | DetID | PixID | Counts | Sigma | Mean | Median | Sigma |
| A | 9 | 143 | 20818 | 126.42 | 794 | 779 | 158.5 |
| A | 13 | 254 | 8873 | 51.06 | 794 | 779 | 158.5 |
| A | 11 | 29 | 8224 | 46.97 | 794 | 779 | 158.5 |
| B | 12 | 111 | 17402 | 111.8 | 805 | 786 | 148.6 |
| B | 11 | 111 | 15146 | 96.62 | 805 | 786 | 148.6 |
| B | 14 | 111 | 13208 | 83.58 | 805 | 786 | 148.6 |
| C | 3 | 233 | 534874 | 2966.61 | 785 | 793 | 180.0 |
| C | 14 | 238 | 123279 | 680.36 | 785 | 793 | 180.0 |
| C | 0 | 207 | 5841 | 28.04 | 785 | 793 | 180.0 |
| D | 11 | 176 | 592662 | 3163.94 | 785 | 766 | 187.1 |
| D | 2 | 234 | 23332 | 120.63 | 785 | 766 | 187.1 |
| D | 2 | 120 | 17703 | 90.54 | 785 | 766 | 187.1 |
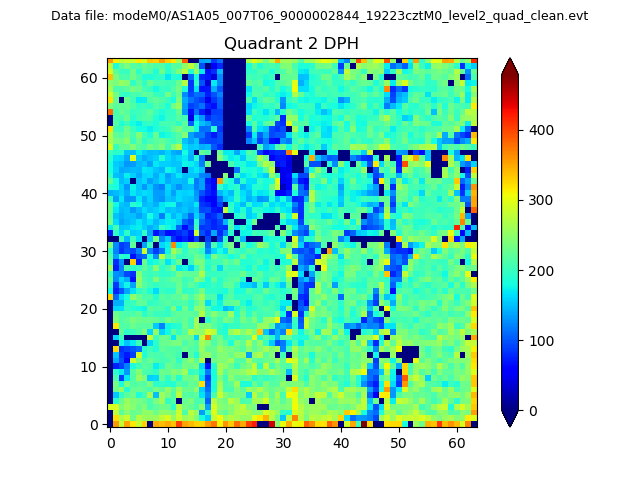
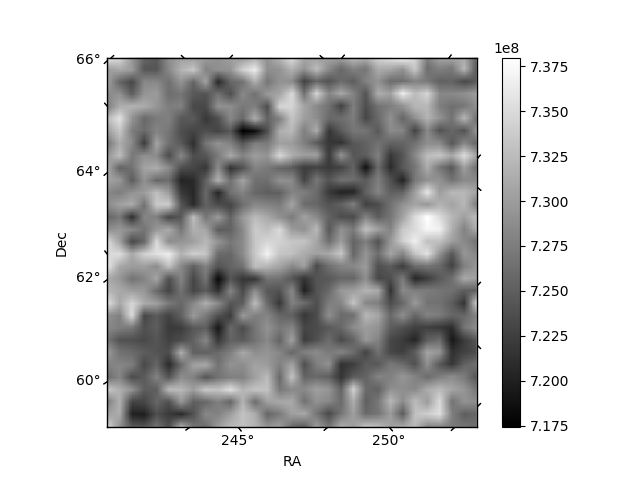
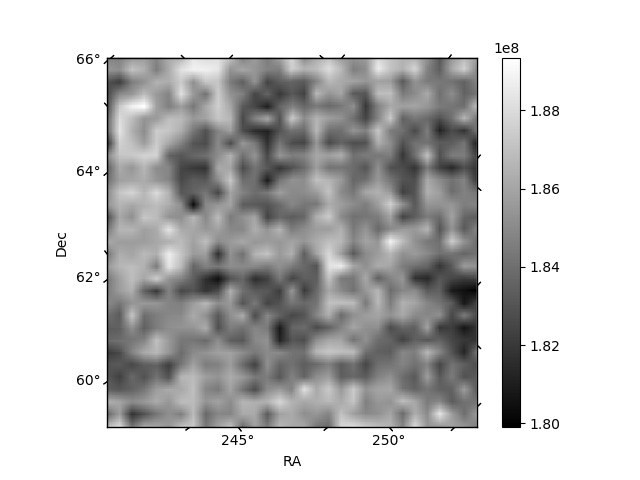
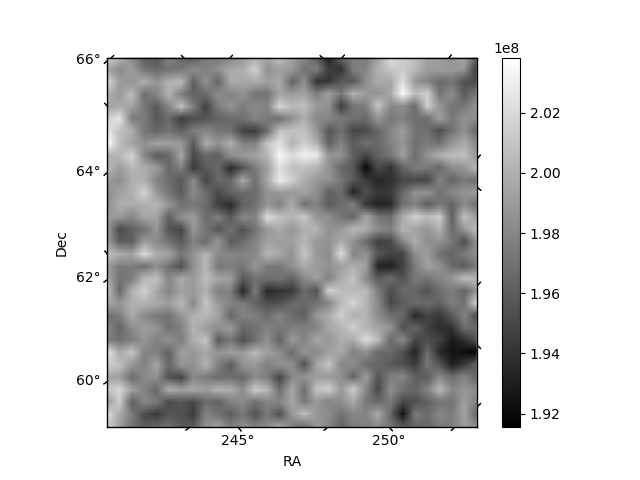
Histogram calculated using DETX and DETY for each event in the final _common_clean file
| Quadrant A | 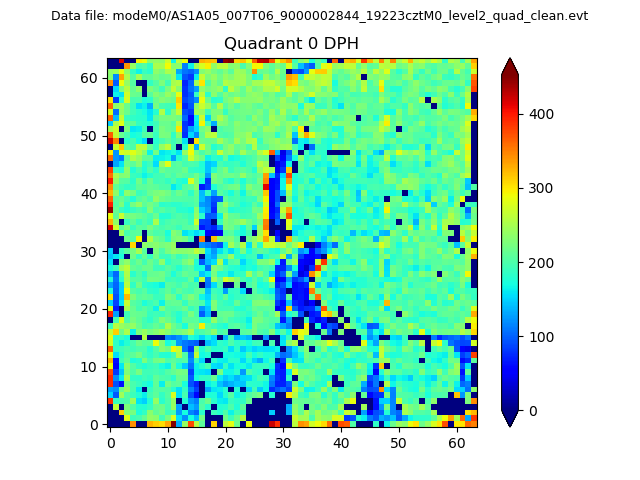 |
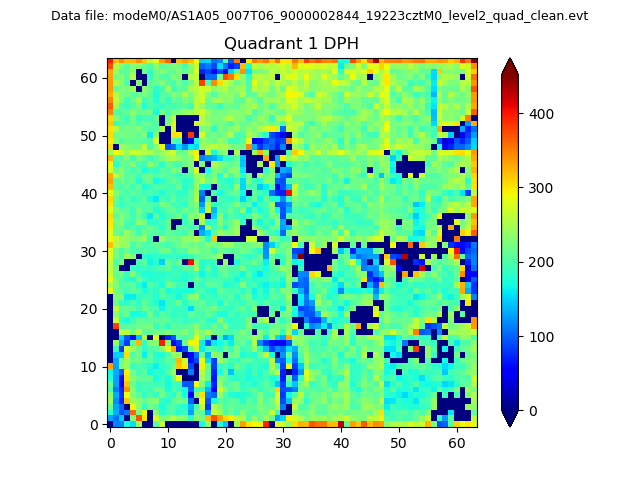 |
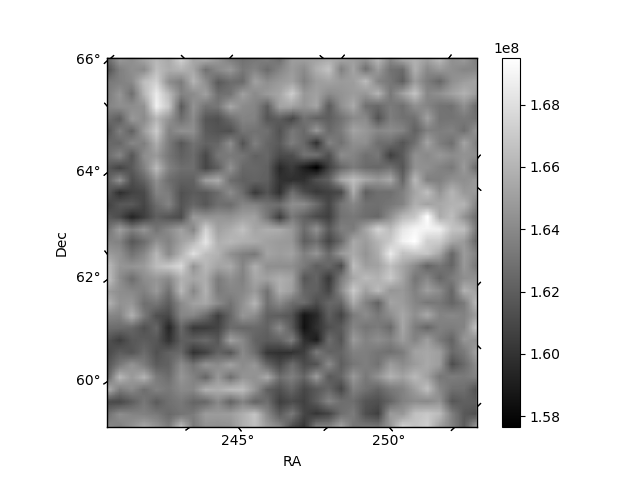
Quadrant B |
|---|---|---|---|
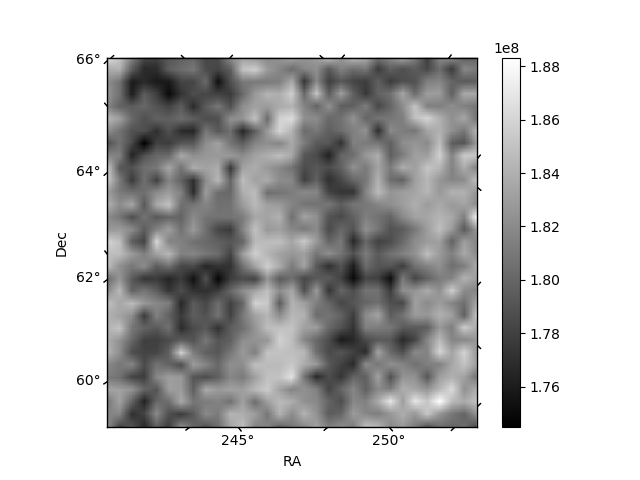
| Quadrant D | 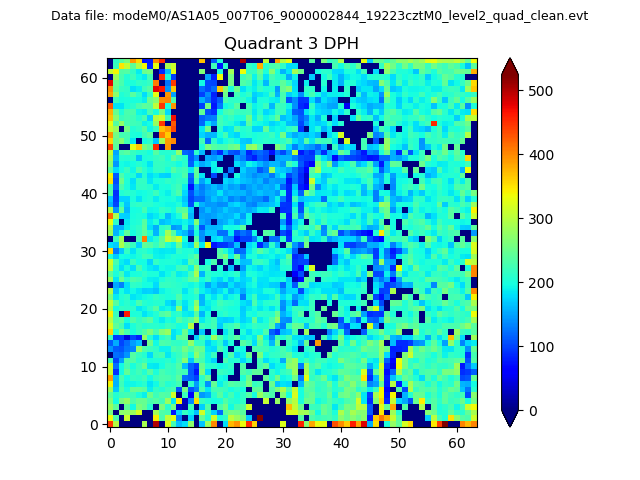 |
 |
Quadrant C |
| Plot type | Count rate plots | Images |
|---|---|---|
| Comparison with Poisson distribution Blue bars denote a histogram of data divided into 1 sec bins. Red curve is a Poisson curve with rate = median count rate of data. |
 |
 |
| Quadrant-wise count rates Data is divided into 100 sec bins |
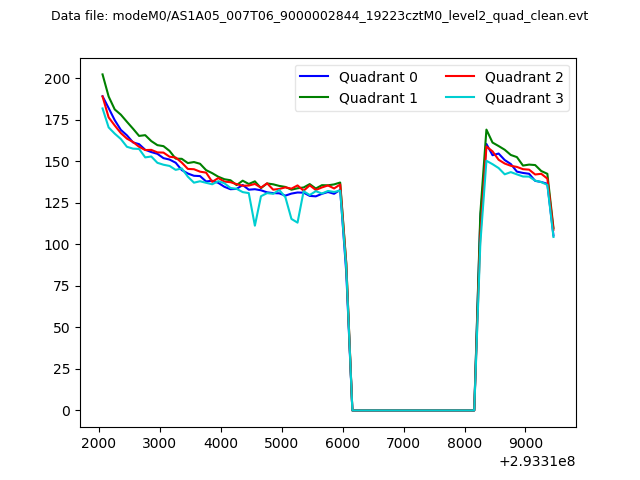 |
|
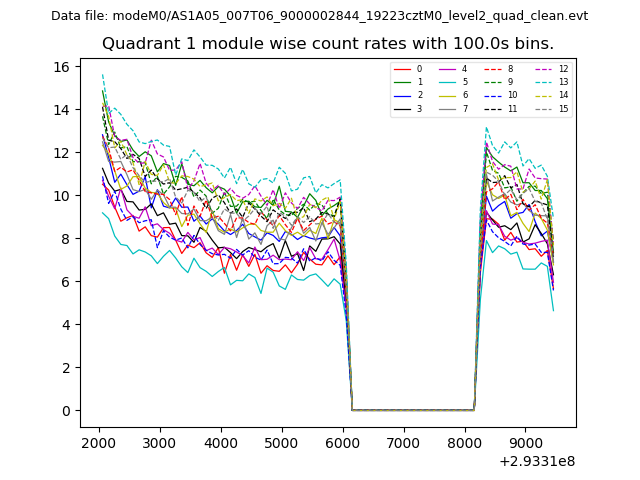
| Module-wise count rates for Quadrant A Data is divided into 100 sec bins |
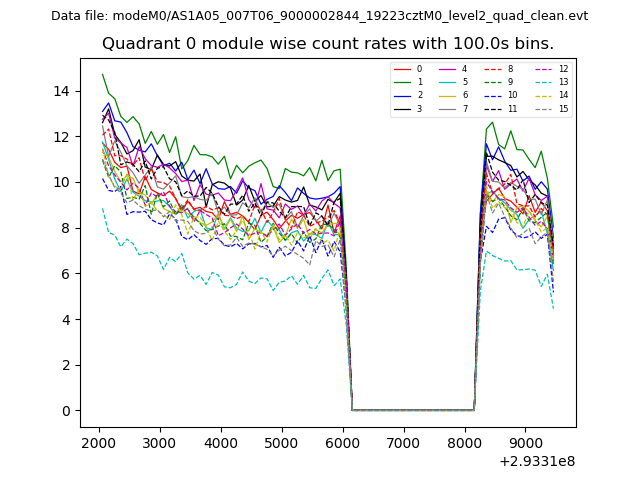 |
 |
| Module-wise count rates for Quadrant B Data is divided into 100 sec bins |
 |
 |
| Module-wise count rates for Quadrant C Data is divided into 100 sec bins |
 |
 |
| Module-wise count rates for Quadrant D Data is divided into 100 sec bins |
 |
 |
| Parameter | Plot |
|---|---|
| CZT HV Monitor |  |
| D_VDD | 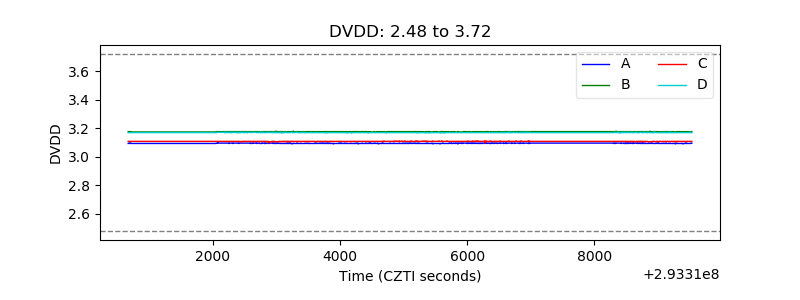 |
| Temperature 1 | 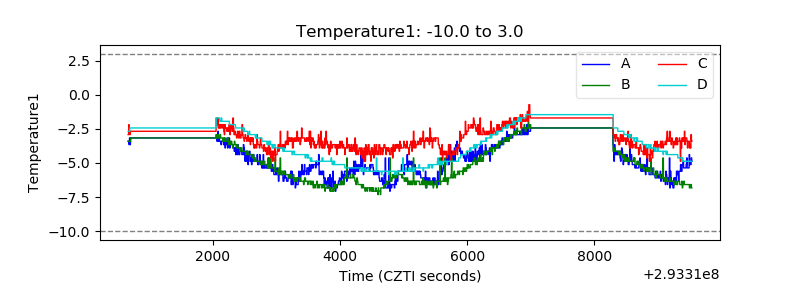 |
| Veto HV Monitor | 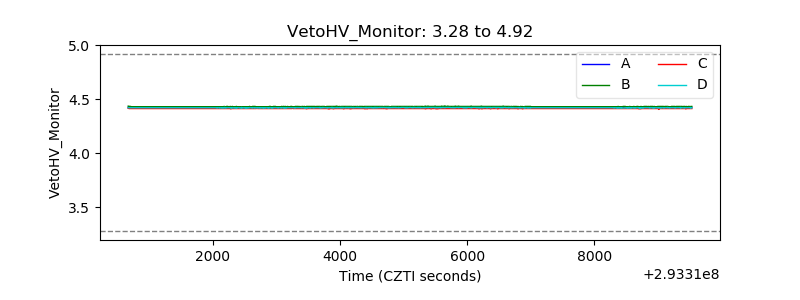 |
| Veto LLD | 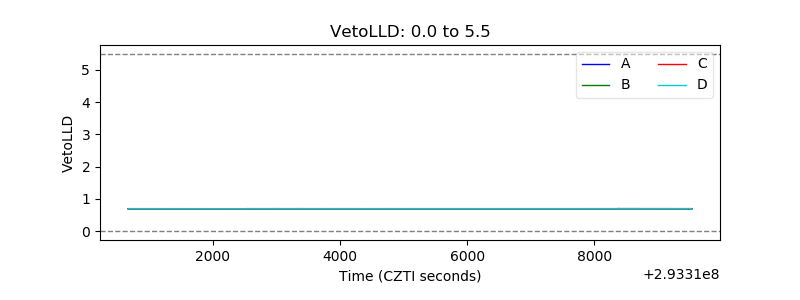 |
| Alpha Counter | 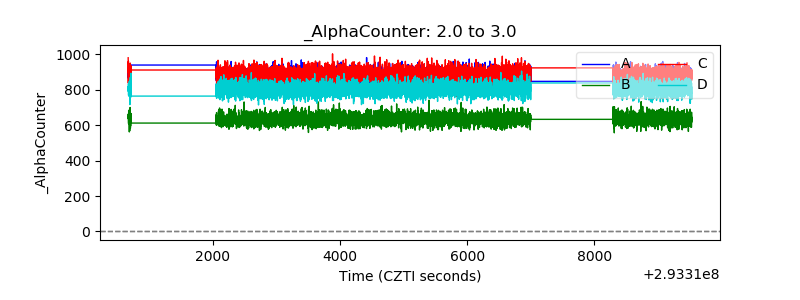 |
| _CPM_Rate | 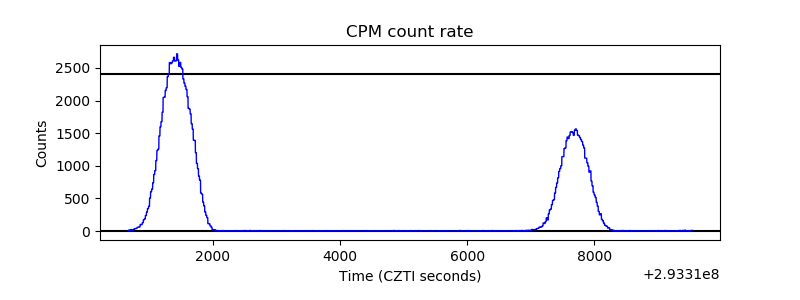 |
| CZT Counter | 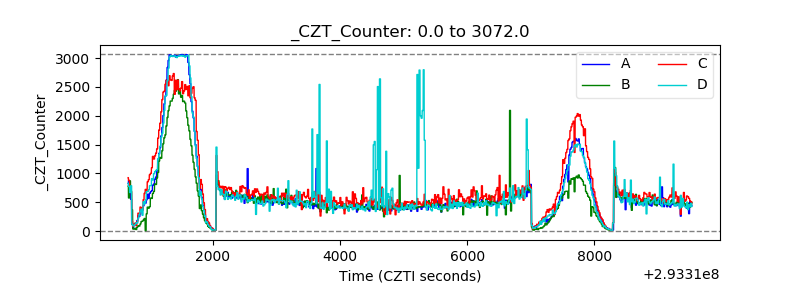 |
| +2.5 Volts monitor |  |
| +5 Volts monitor |  |
| _ROLL_ROT |  |
| _Roll_DEC | 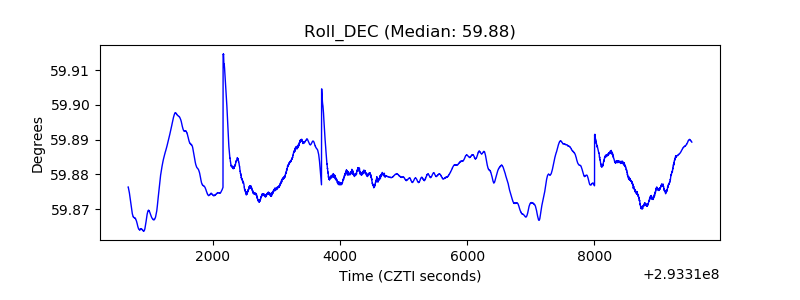 |
| _Roll_RA | 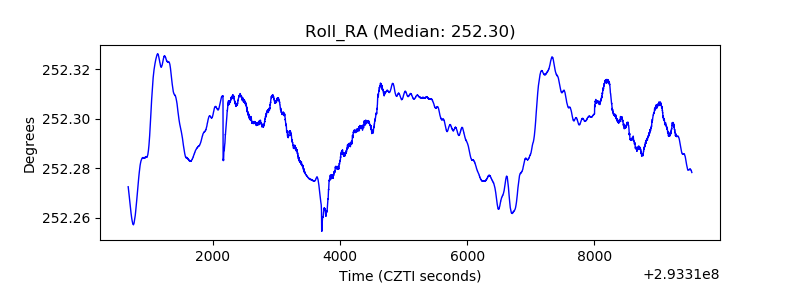 |
| Veto Counter |  |