| Param | Original file | Final file |
|---|---|---|
| Filename | modeM0/AS1A05_007T06_9000002844_19224cztM0_level2.evt | modeM0/AS1A05_007T06_9000002844_19224cztM0_level2_quad_clean.evt |
| Size (bytes) | 449,334,720 | 104,676,480 |
| Size | 428.5 MB | 99.8 MB |
| Events in quadrant A | 3,043,442 | 673,546 |
| Events in quadrant B | 3,159,319 | 697,642 |
| Events in quadrant C | 3,732,216 | 682,799 |
| Events in quadrant D | 3,229,146 | 660,615 |
| Mode SS | |||
|---|---|---|---|
| Quadrant | BADHDUFLAG | Total packets | Discarded packets |
| A | 0 | 132 | 0 |
| B | 0 | 132 | 0 |
| C | 0 | 132 | 0 |
| D | 0 | 132 | 0 |
| Mode M9 | |||
|---|---|---|---|
| Quadrant | BADHDUFLAG | Total packets | Discarded packets |
| A | 0 | 16 | 0 |
| B | 0 | 17 | 0 |
| C | 0 | 17 | 0 |
| D | 0 | 17 | 0 |
| Mode M0 | |||
|---|---|---|---|
| Quadrant | BADHDUFLAG | Total packets | Discarded packets |
| A | 0 | 13426 | 2 |
| B | 0 | 13635 | 2 |
| C | 0 | 15165 | 2 |
| D | 0 | 14206 | 2 |
| Quadrant | Total seconds | Saturated seconds | Saturation percentage |
|---|---|---|---|
| A | 6536 | 14 | 0.214198% |
| B | 6536 | 34 | 0.520196% |
| C | 6536 | 93 | 1.422889% |
| D | 6536 | 63 | 0.963892% |
Noise dominated data is calculated using 1-second bins in cleaned event files. If a bin has >2000 counts, and if more than 50% of those come from <1% of pixels, then it is considered to be noise-dominated and hence unusable.
| Quadrant | # 1 sec bins | Bins with >0 counts | Bins with >2000 counts | High rate bins dominated by noise | Noise dominated (total time) | Noise dominated (detector-on time) | Marked lightcurve |
|---|---|---|---|---|---|---|---|
| A | 7596 | 6537 | 0 | 0 | 0.00% | 0.00% | 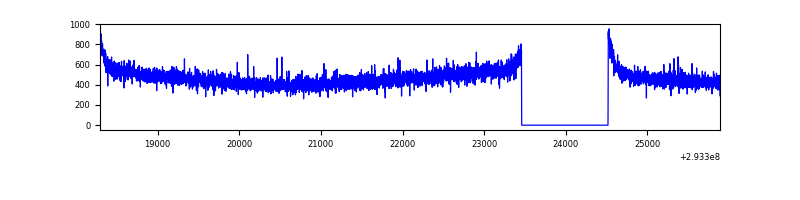 |
| B | 7596 | 6537 | 1 | 1 | 0.01% | 0.02% | 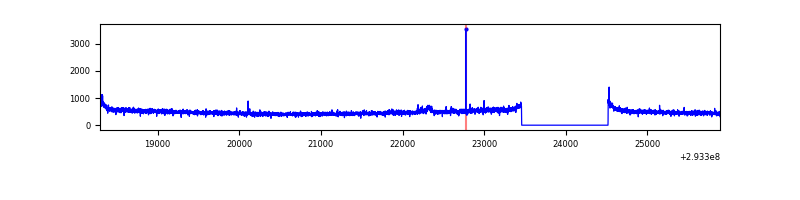 |
| C | 7596 | 6537 | 1 | 1 | 0.01% | 0.02% | 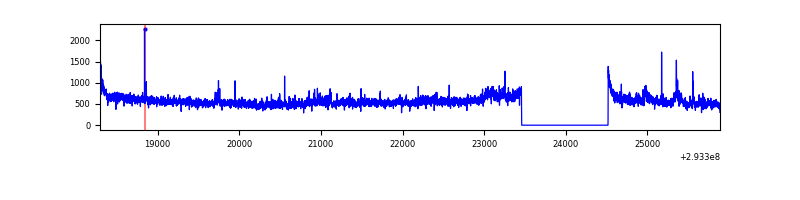 |
| D | 7596 | 6537 | 43 | 43 | 0.57% | 0.66% | 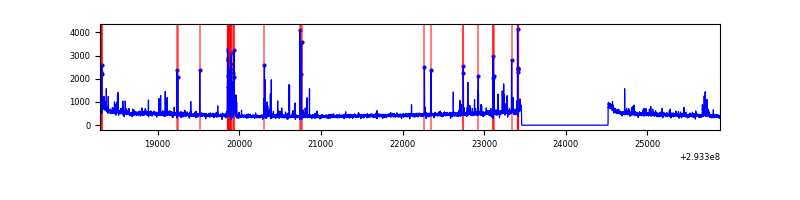 |
Top three noisy pixels from each quadrant. If the there are fewer than three noisy pixels in the level2.evt file, extra rows are filled as -1
| Pixel properties | Quadrant properties | ||||||
|---|---|---|---|---|---|---|---|
| Quadrant | DetID | PixID | Counts | Sigma | Mean | Median | Sigma |
| A | 13 | 254 | 8706 | 50.35 | 787 | 774 | 157.5 |
| A | 0 | 226 | 6809 | 38.31 | 787 | 774 | 157.5 |
| A | 3 | 137 | 6036 | 33.4 | 787 | 774 | 157.5 |
| B | 12 | 111 | 17754 | 113.57 | 797 | 776 | 149.5 |
| B | 10 | 247 | 17124 | 109.35 | 797 | 776 | 149.5 |
| B | 11 | 111 | 15660 | 99.56 | 797 | 776 | 149.5 |
| C | 3 | 233 | 562799 | 3166.53 | 774 | 780 | 177.5 |
| C | 14 | 238 | 120417 | 674.06 | 774 | 780 | 177.5 |
| C | 6 | 96 | 15495 | 82.9 | 774 | 780 | 177.5 |
| D | 11 | 176 | 183350 | 974.92 | 773 | 751 | 187.3 |
| D | 7 | 96 | 81691 | 432.15 | 773 | 751 | 187.3 |
| D | 2 | 234 | 24401 | 126.27 | 773 | 751 | 187.3 |
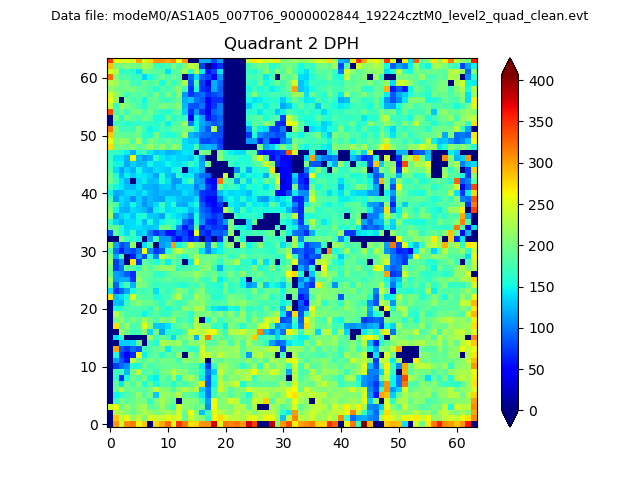
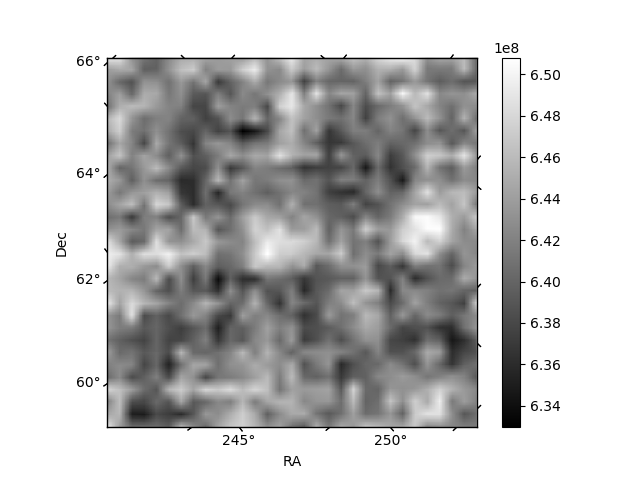
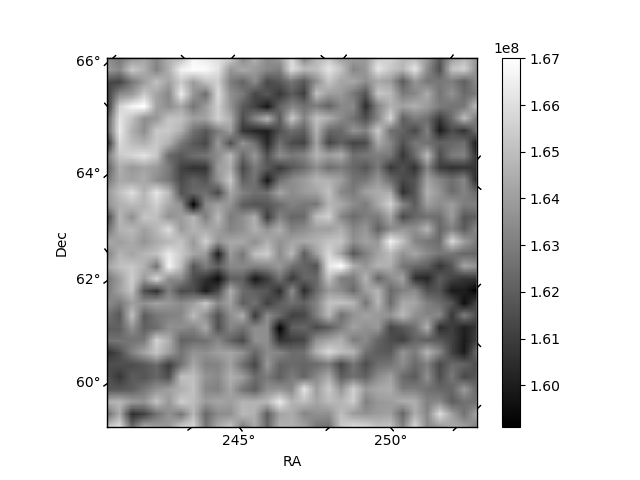
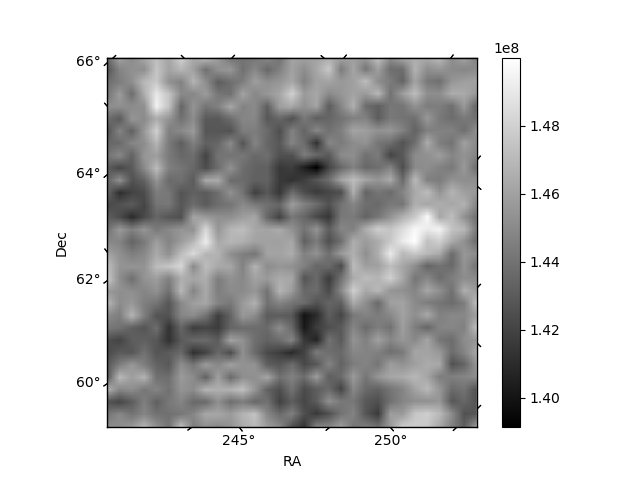
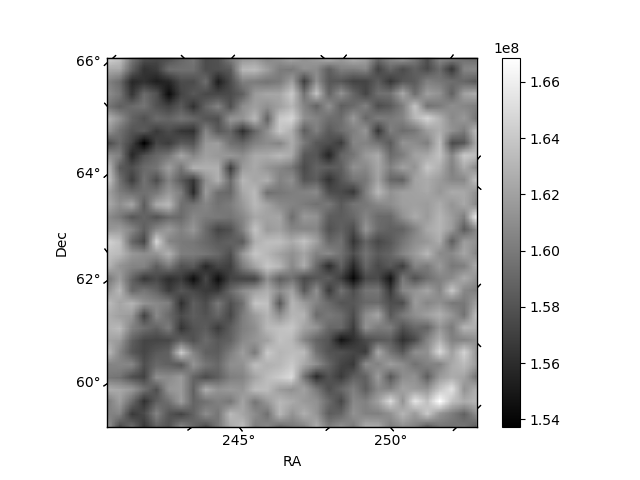
Histogram calculated using DETX and DETY for each event in the final _common_clean file
| Quadrant A | 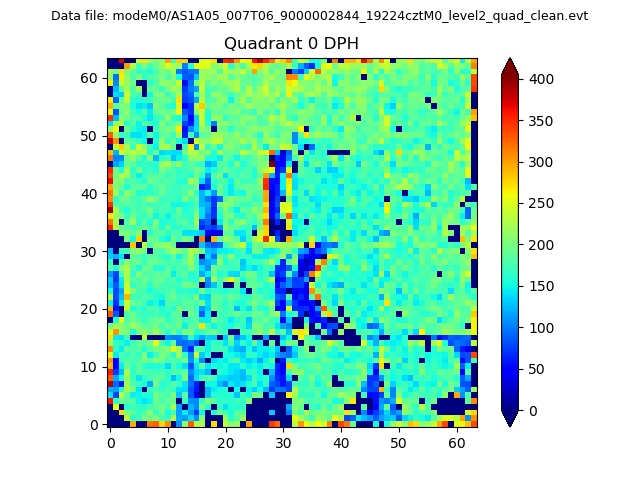 |
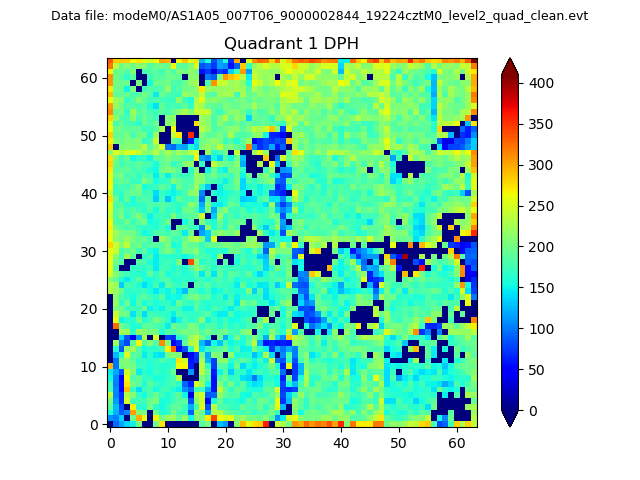 |
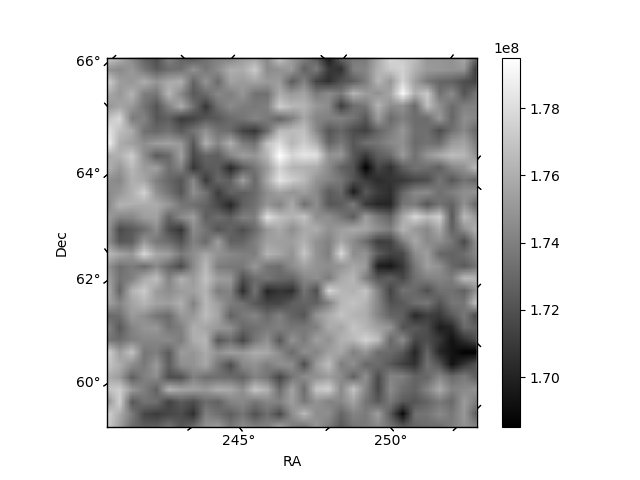
Quadrant B |
|---|---|---|---|
| Quadrant D | 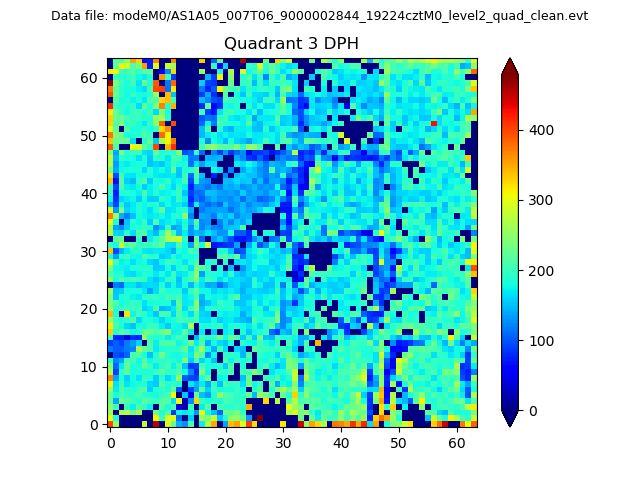 |
 |
Quadrant C |
| Plot type | Count rate plots | Images |
|---|---|---|
| Comparison with Poisson distribution Blue bars denote a histogram of data divided into 1 sec bins. Red curve is a Poisson curve with rate = median count rate of data. |
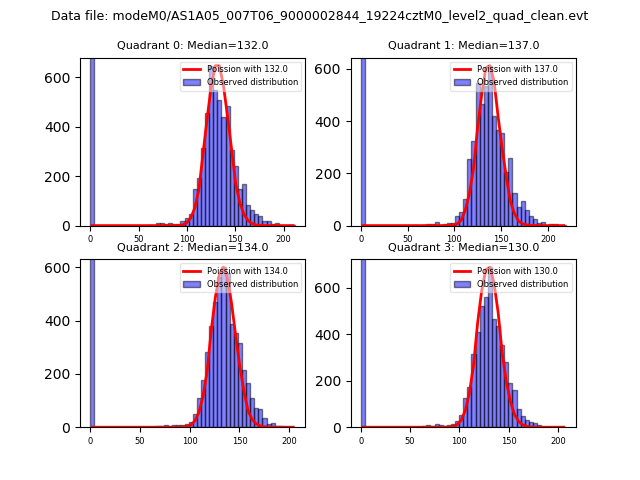 |
 |
| Quadrant-wise count rates Data is divided into 100 sec bins |
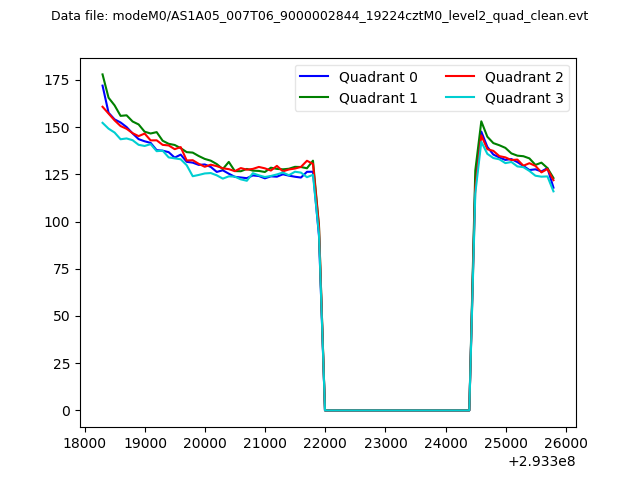 |
|
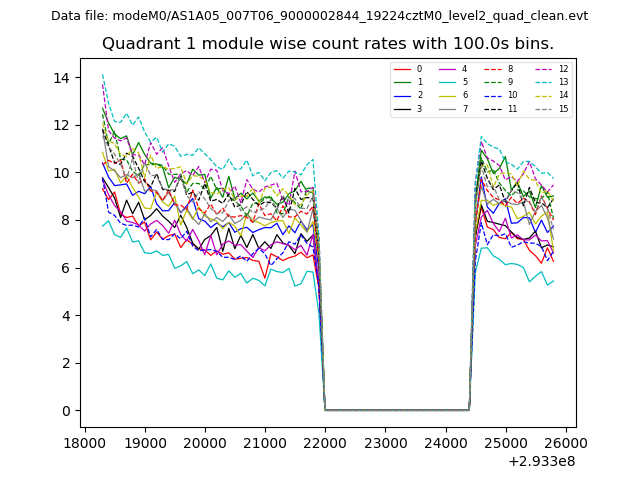
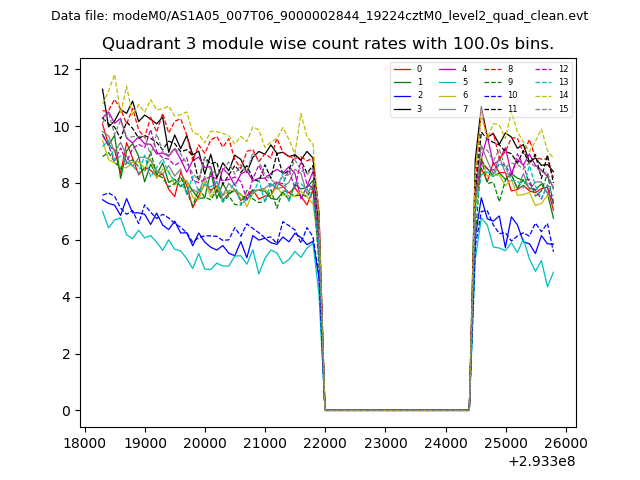
| Module-wise count rates for Quadrant A Data is divided into 100 sec bins |
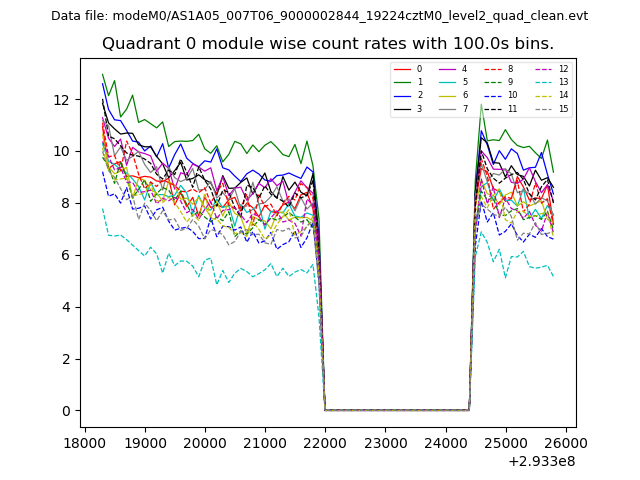 |
 |
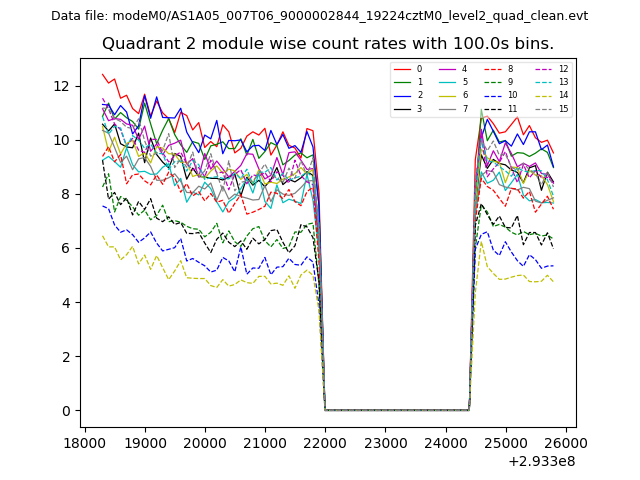
| Module-wise count rates for Quadrant B Data is divided into 100 sec bins |
 |
 |
| Module-wise count rates for Quadrant C Data is divided into 100 sec bins |
 |
 |
| Module-wise count rates for Quadrant D Data is divided into 100 sec bins |
 |
 |
| Parameter | Plot |
|---|---|
| CZT HV Monitor | 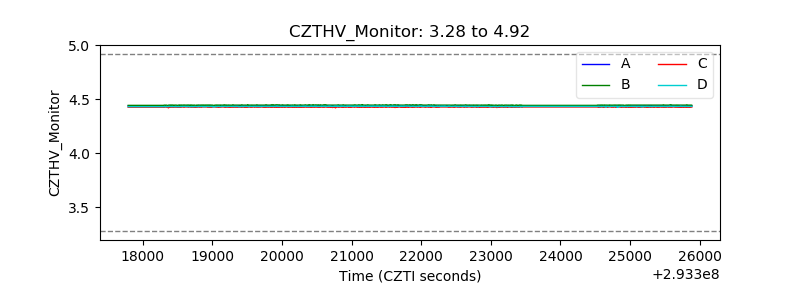 |
| D_VDD | 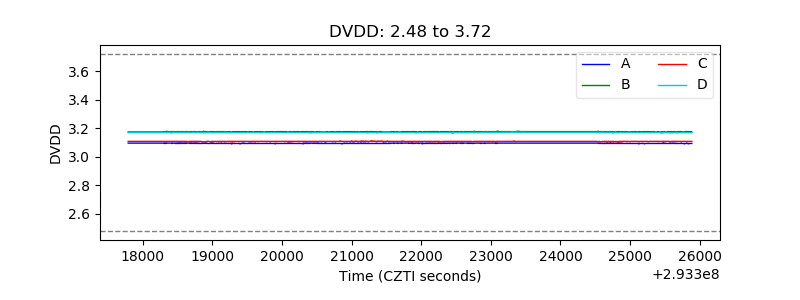 |
| Temperature 1 |  |
| Veto HV Monitor |  |
| Veto LLD | 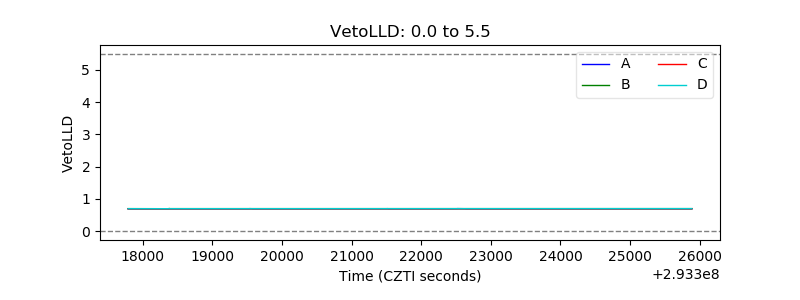 |
| Alpha Counter | 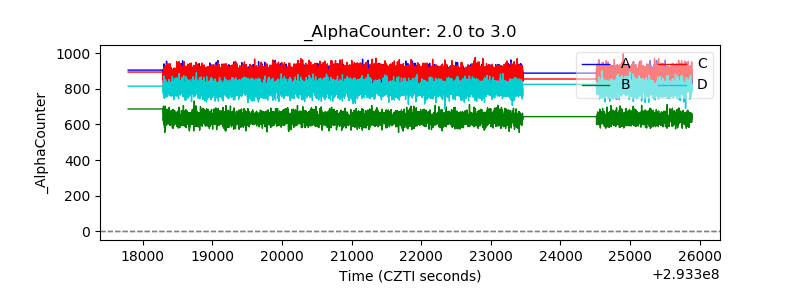 |
| _CPM_Rate | 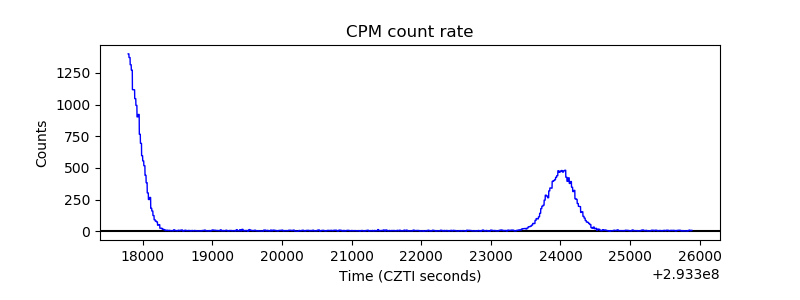 |
| CZT Counter | 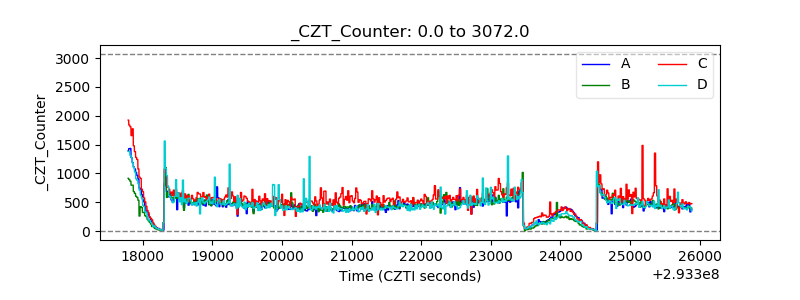 |
| +2.5 Volts monitor |  |
| +5 Volts monitor |  |
| _ROLL_ROT |  |
| _Roll_DEC | 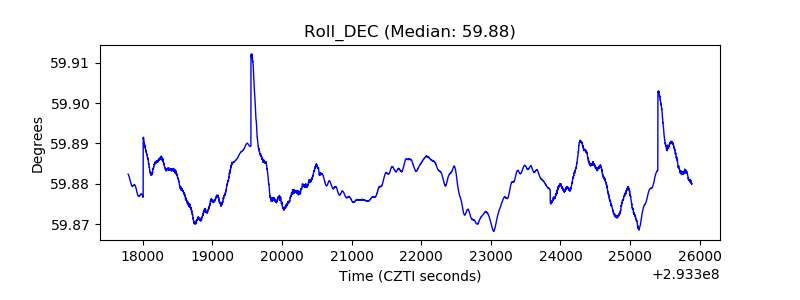 |
| _Roll_RA | 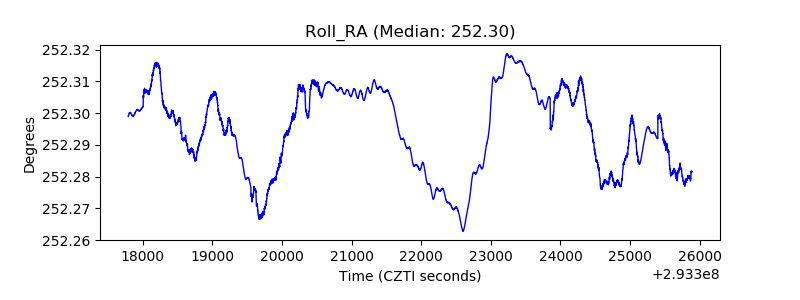 |
| Veto Counter | 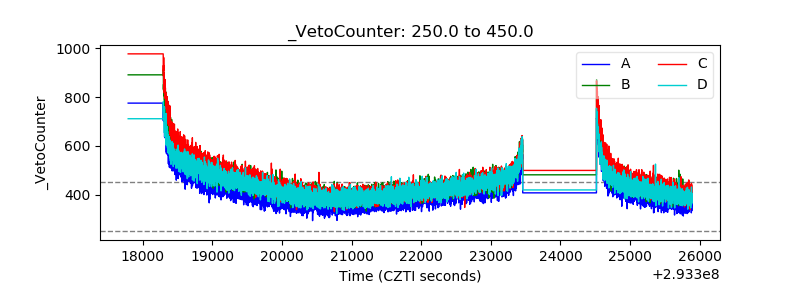 |