| Param | Original file | Final file |
|---|---|---|
| Filename | modeM0/AS1A05_007T06_9000002844_19226cztM0_level2.evt | modeM0/AS1A05_007T06_9000002844_19226cztM0_level2_quad_clean.evt |
| Size (bytes) | 600,868,800 | 122,506,560 |
| Size | 573.0 MB | 116.8 MB |
| Events in quadrant A | 3,963,833 | 786,807 |
| Events in quadrant B | 4,093,550 | 805,323 |
| Events in quadrant C | 4,846,138 | 785,943 |
| Events in quadrant D | 4,718,813 | 743,318 |
| Mode SS | |||
|---|---|---|---|
| Quadrant | BADHDUFLAG | Total packets | Discarded packets |
| A | 0 | 172 | 0 |
| B | 0 | 172 | 0 |
| C | 0 | 172 | 0 |
| D | 0 | 172 | 0 |
| Mode M9 | |||
|---|---|---|---|
| Quadrant | BADHDUFLAG | Total packets | Discarded packets |
| A | 0 | 10 | 0 |
| B | 0 | 10 | 0 |
| C | 0 | 10 | 0 |
| D | 0 | 10 | 0 |
| Mode M0 | |||
|---|---|---|---|
| Quadrant | BADHDUFLAG | Total packets | Discarded packets |
| A | 0 | 17631 | 3 |
| B | 0 | 17869 | 2 |
| C | 0 | 20249 | 2 |
| D | 0 | 20256 | 2 |
| Quadrant | Total seconds | Saturated seconds | Saturation percentage |
|---|---|---|---|
| A | 8482 | 49 | 0.577694% |
| B | 8482 | 103 | 1.214336% |
| C | 8482 | 196 | 2.310776% |
| D | 8482 | 340 | 4.008489% |
Noise dominated data is calculated using 1-second bins in cleaned event files. If a bin has >2000 counts, and if more than 50% of those come from <1% of pixels, then it is considered to be noise-dominated and hence unusable.
| Quadrant | # 1 sec bins | Bins with >0 counts | Bins with >2000 counts | High rate bins dominated by noise | Noise dominated (total time) | Noise dominated (detector-on time) | Marked lightcurve |
|---|---|---|---|---|---|---|---|
| A | 9422 | 8484 | 5 | 5 | 0.05% | 0.06% | 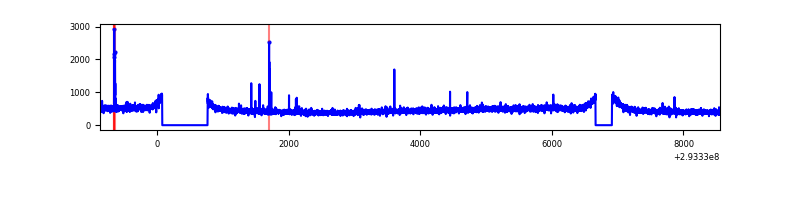 |
| B | 9422 | 8484 | 2 | 2 | 0.02% | 0.02% | 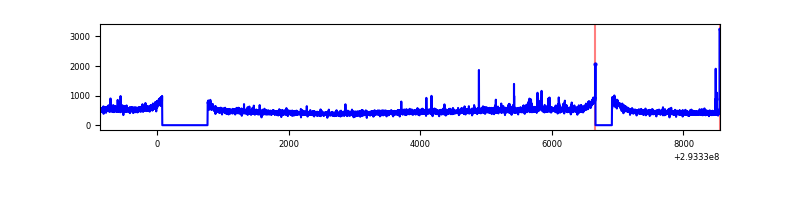 |
| C | 9422 | 8484 | 0 | 0 | 0.00% | 0.00% | 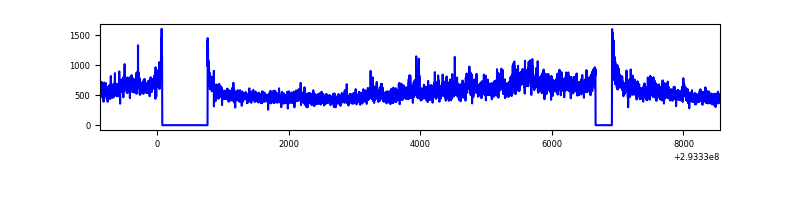 |
| D | 9422 | 8484 | 257 | 257 | 2.73% | 3.03% | 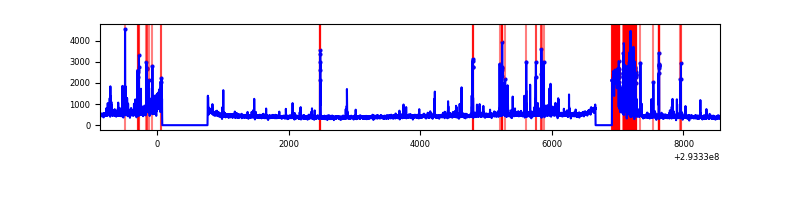 |
Top three noisy pixels from each quadrant. If the there are fewer than three noisy pixels in the level2.evt file, extra rows are filled as -1
| Pixel properties | Quadrant properties | ||||||
|---|---|---|---|---|---|---|---|
| Quadrant | DetID | PixID | Counts | Sigma | Mean | Median | Sigma |
| A | 9 | 143 | 52098 | 250.55 | 1015 | 990 | 204.0 |
| A | 13 | 254 | 10346 | 45.87 | 1015 | 990 | 204.0 |
| A | 0 | 226 | 8723 | 37.91 | 1015 | 990 | 204.0 |
| B | 4 | 216 | 36285 | 181.99 | 1024 | 997 | 193.9 |
| B | 12 | 111 | 23883 | 118.03 | 1024 | 997 | 193.9 |
| B | 11 | 111 | 20813 | 102.2 | 1024 | 997 | 193.9 |
| C | 3 | 233 | 824969 | 3571.23 | 988 | 992 | 230.7 |
| C | 14 | 238 | 153796 | 662.27 | 988 | 992 | 230.7 |
| C | 0 | 207 | 10914 | 43.0 | 988 | 992 | 230.7 |
| D | 11 | 176 | 573666 | 2440.95 | 970 | 945 | 234.6 |
| D | 9 | 68 | 317565 | 1349.44 | 970 | 945 | 234.6 |
| D | 1 | 52 | 93855 | 395.99 | 970 | 945 | 234.6 |
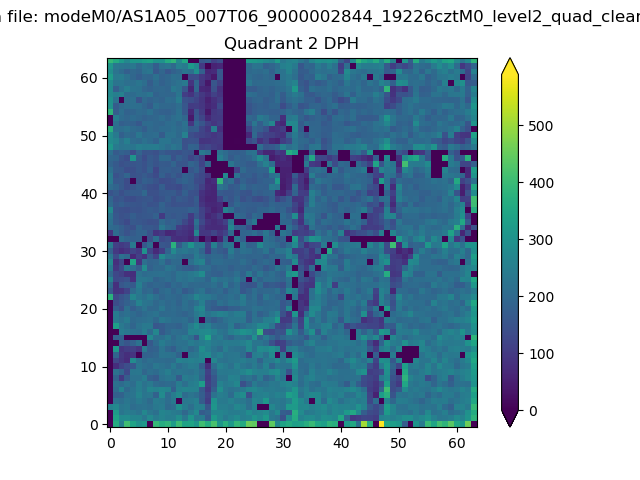
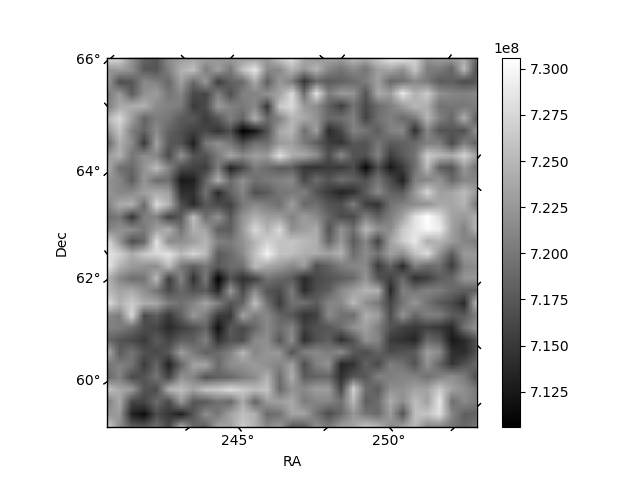
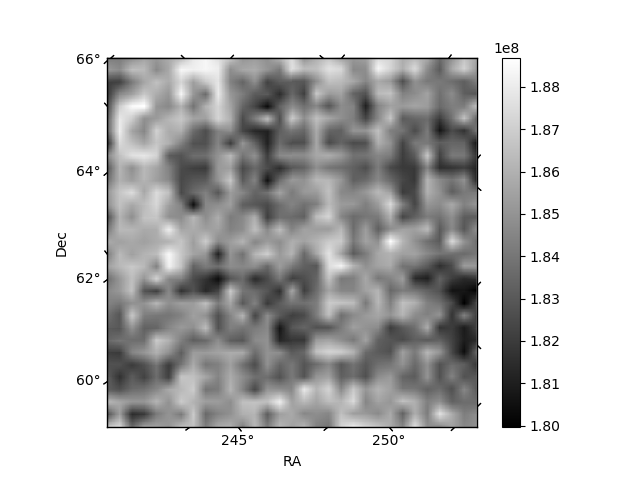
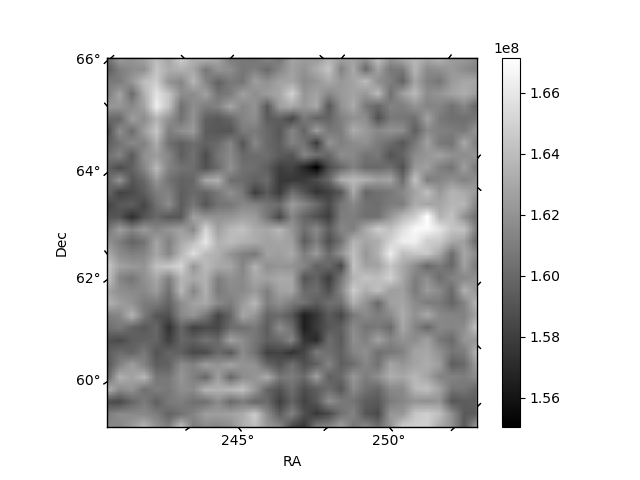
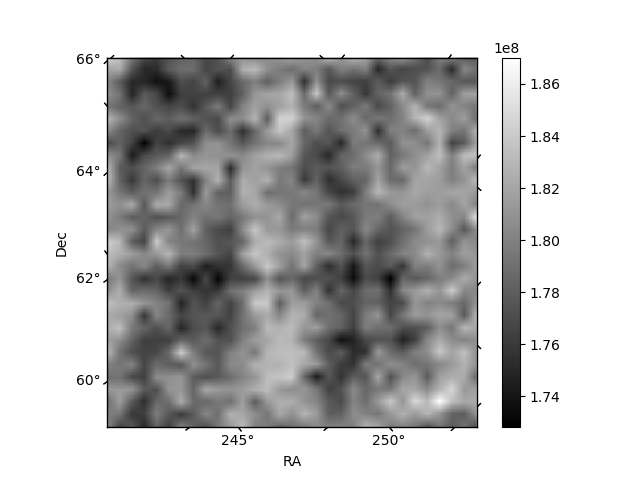
Histogram calculated using DETX and DETY for each event in the final _common_clean file
| Quadrant A | 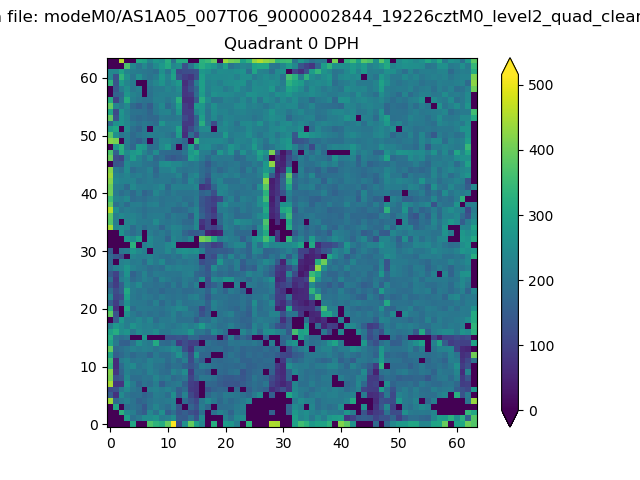 |
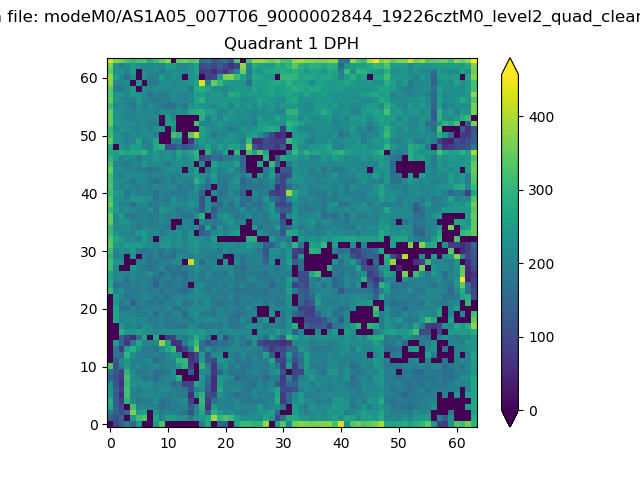 |
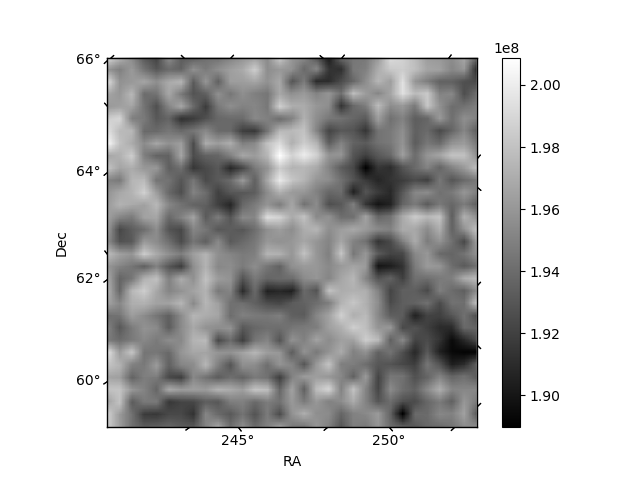
Quadrant B |
|---|---|---|---|
| Quadrant D | 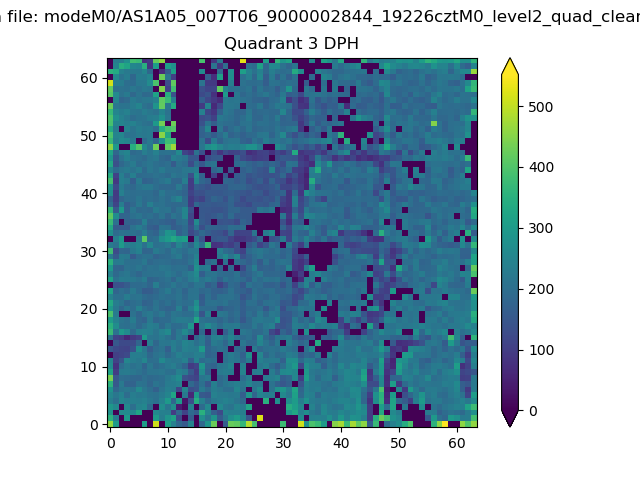 |
 |
Quadrant C |
| Plot type | Count rate plots | Images |
|---|---|---|
| Comparison with Poisson distribution Blue bars denote a histogram of data divided into 1 sec bins. Red curve is a Poisson curve with rate = median count rate of data. |
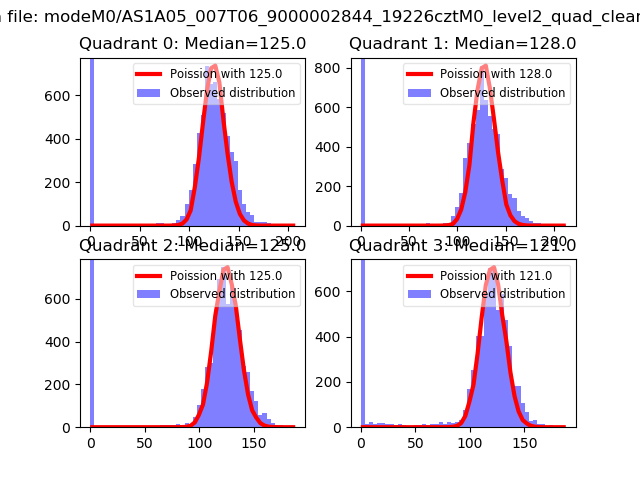 |
 |
| Quadrant-wise count rates Data is divided into 100 sec bins |
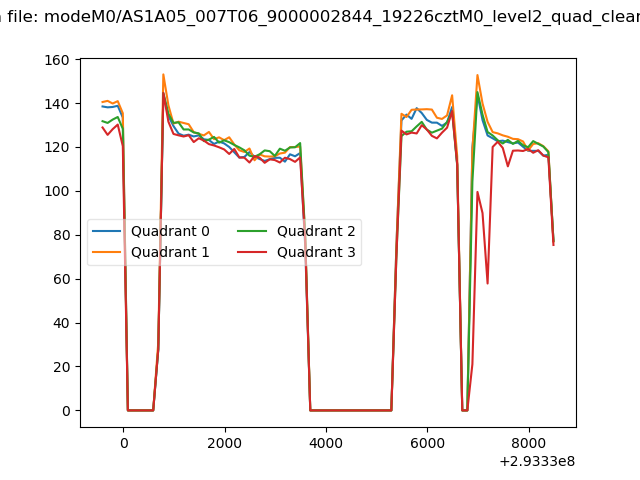 |
|
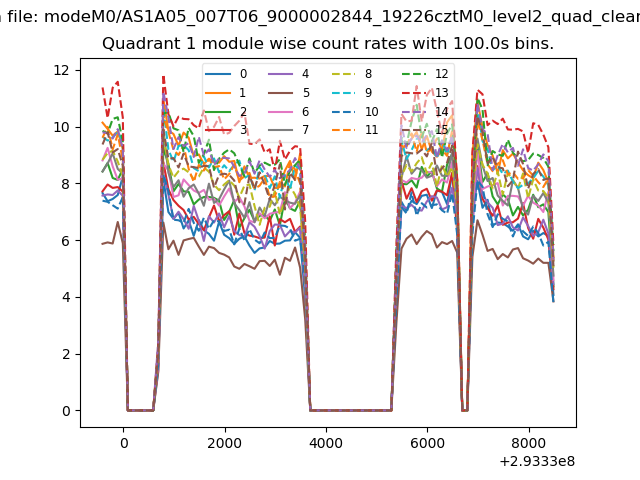
| Module-wise count rates for Quadrant A Data is divided into 100 sec bins |
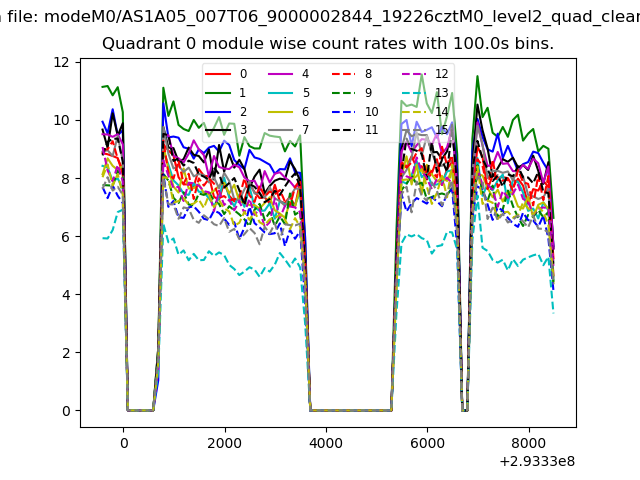 |
 |
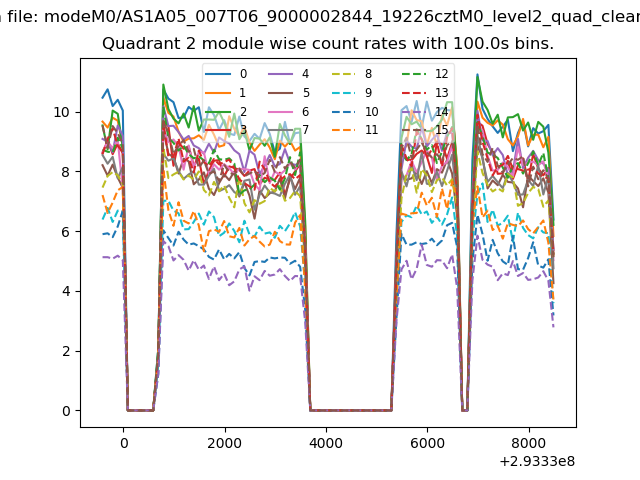
| Module-wise count rates for Quadrant B Data is divided into 100 sec bins |
 |
 |
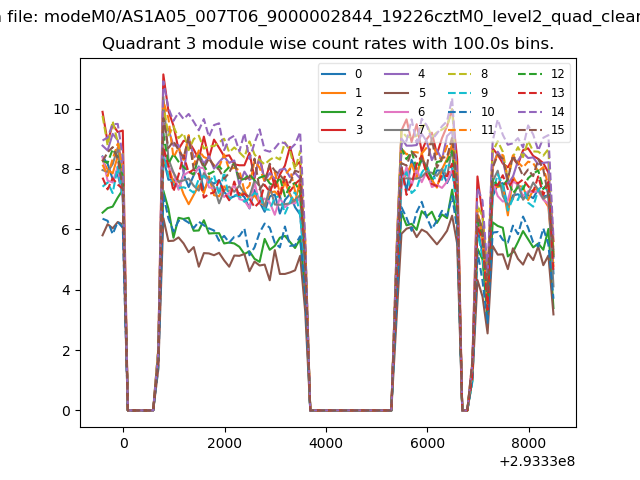
| Module-wise count rates for Quadrant C Data is divided into 100 sec bins |
 |
 |
| Module-wise count rates for Quadrant D Data is divided into 100 sec bins |
 |
 |
| Parameter | Plot |
|---|---|
| CZT HV Monitor | 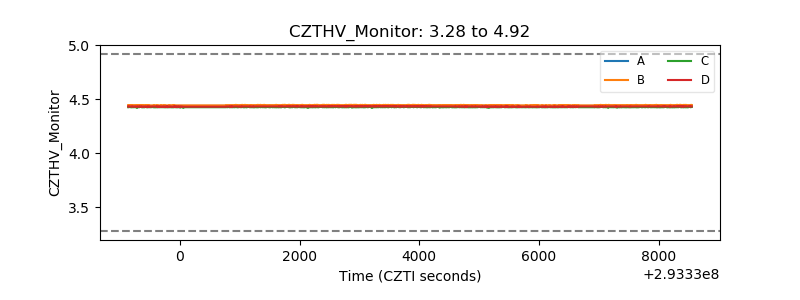 |
| D_VDD | 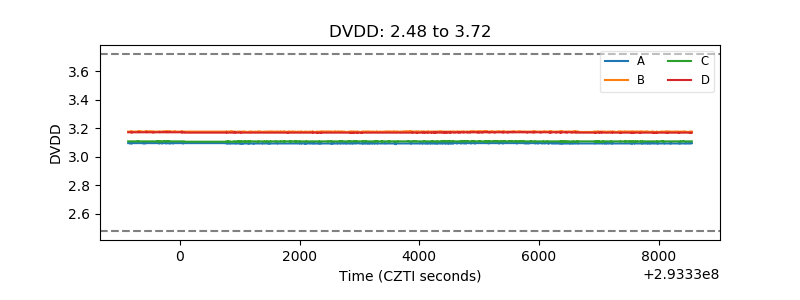 |
| Temperature 1 | 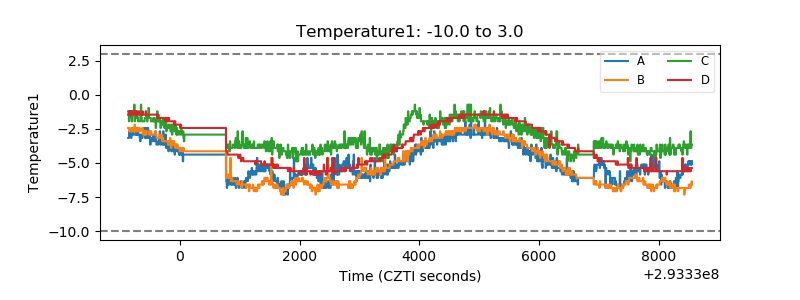 |
| Veto HV Monitor | 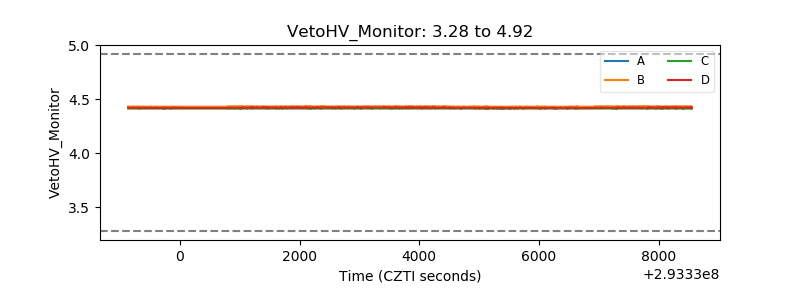 |
| Veto LLD | 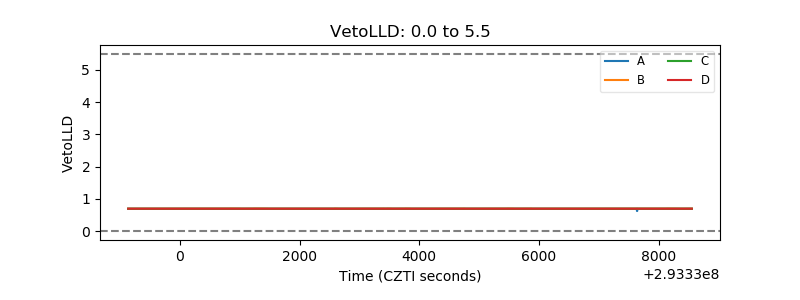 |
| Alpha Counter | 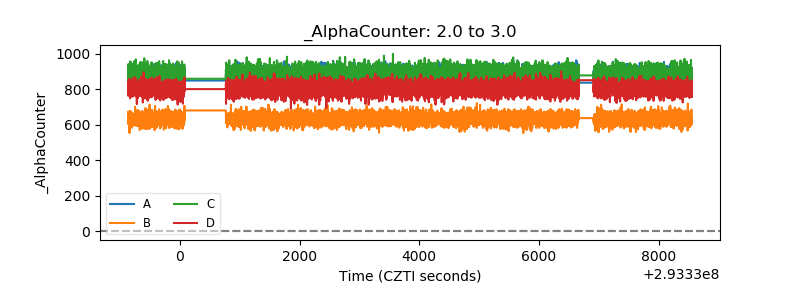 |
| _CPM_Rate | 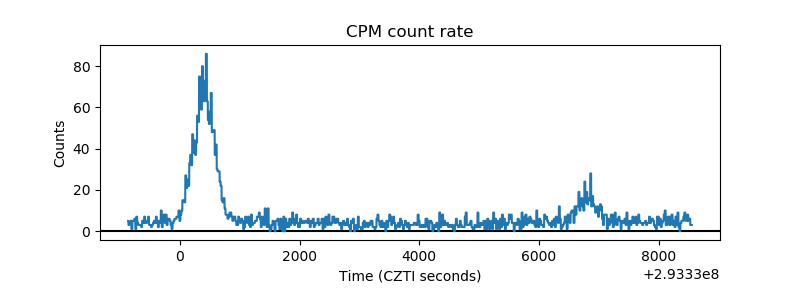 |
| CZT Counter | 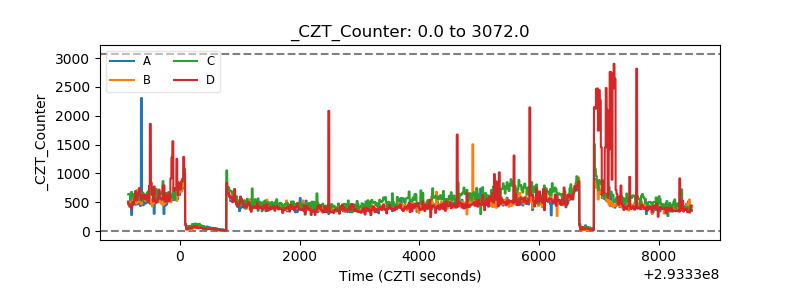 |
| +2.5 Volts monitor | 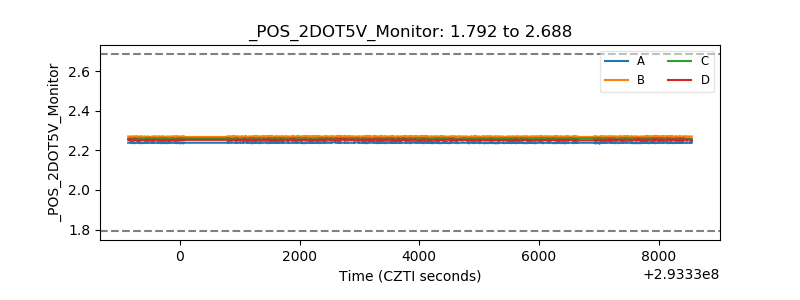 |
| +5 Volts monitor |  |
| _ROLL_ROT | 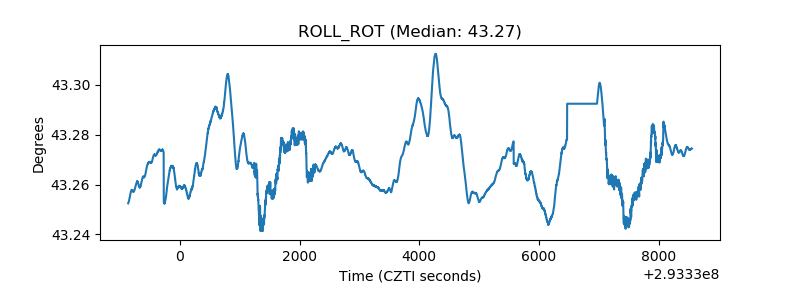 |
| _Roll_DEC | 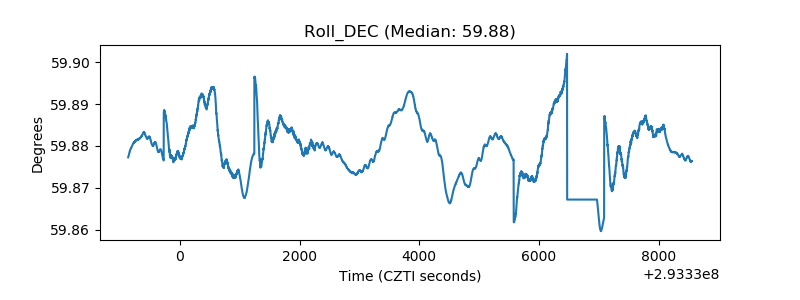 |
| _Roll_RA | 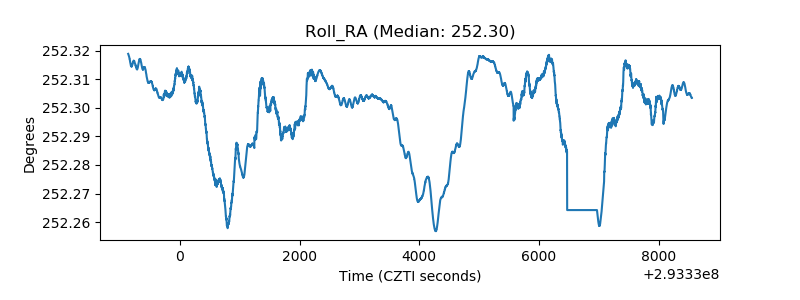 |
| Veto Counter | 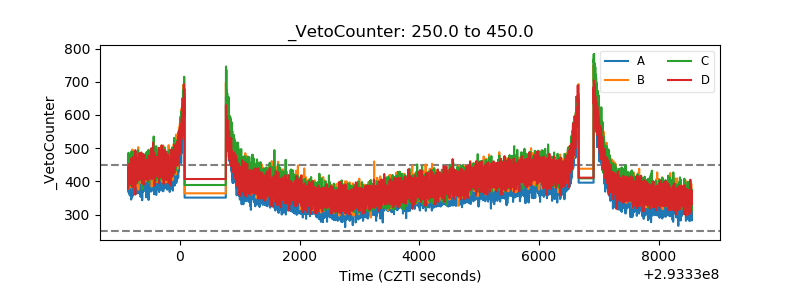 |