| Param | Original file | Final file |
|---|---|---|
| Filename | modeM0/AS1A05_007T06_9000002844_19228cztM0_level2.evt | modeM0/AS1A05_007T06_9000002844_19228cztM0_level2_quad_clean.evt |
| Size (bytes) | 543,971,520 | 112,279,680 |
| Size | 518.8 MB | 107.1 MB |
| Events in quadrant A | 3,498,642 | 716,927 |
| Events in quadrant B | 3,588,911 | 735,440 |
| Events in quadrant C | 4,519,899 | 715,406 |
| Events in quadrant D | 4,345,103 | 697,992 |
| Mode SS | |||
|---|---|---|---|
| Quadrant | BADHDUFLAG | Total packets | Discarded packets |
| A | 0 | 158 | 0 |
| B | 0 | 158 | 0 |
| C | 0 | 158 | 0 |
| D | 0 | 158 | 0 |
| Mode M9 | |||
|---|---|---|---|
| Quadrant | BADHDUFLAG | Total packets | Discarded packets |
| A | 0 | 6 | 0 |
| B | 0 | 6 | 0 |
| C | 0 | 6 | 0 |
| D | 0 | 6 | 0 |
| Mode M0 | |||
|---|---|---|---|
| Quadrant | BADHDUFLAG | Total packets | Discarded packets |
| A | 0 | 15794 | 2 |
| B | 0 | 15850 | 2 |
| C | 0 | 18579 | 3 |
| D | 0 | 18284 | 2 |
| Quadrant | Total seconds | Saturated seconds | Saturation percentage |
|---|---|---|---|
| A | 7690 | 145 | 1.885566% |
| B | 7691 | 176 | 2.288389% |
| C | 7690 | 222 | 2.886866% |
| D | 7690 | 220 | 2.860858% |
Noise dominated data is calculated using 1-second bins in cleaned event files. If a bin has >2000 counts, and if more than 50% of those come from <1% of pixels, then it is considered to be noise-dominated and hence unusable.
| Quadrant | # 1 sec bins | Bins with >0 counts | Bins with >2000 counts | High rate bins dominated by noise | Noise dominated (total time) | Noise dominated (detector-on time) | Marked lightcurve |
|---|---|---|---|---|---|---|---|
| A | 8230 | 7693 | 2 | 2 | 0.02% | 0.03% | 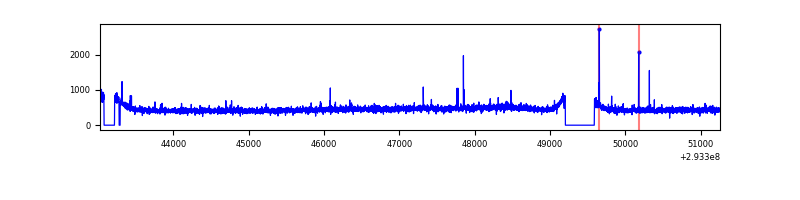 |
| B | 8231 | 7694 | 4 | 4 | 0.05% | 0.05% | 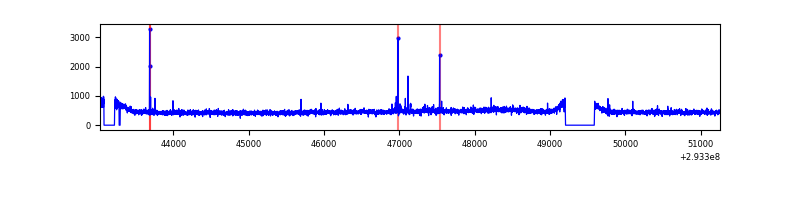 |
| C | 8230 | 7693 | 0 | 0 | 0.00% | 0.00% | 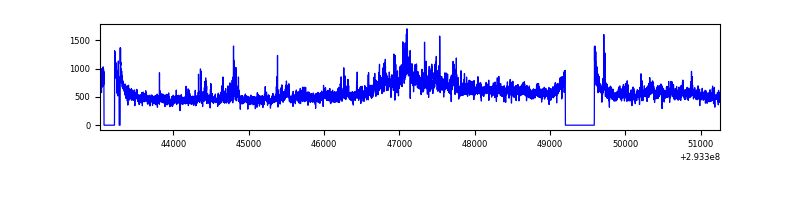 |
| D | 8230 | 7693 | 119 | 119 | 1.45% | 1.55% | 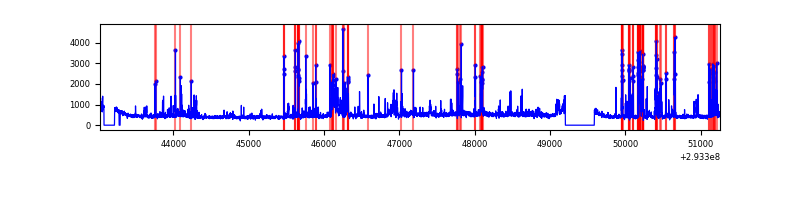 |
Top three noisy pixels from each quadrant. If the there are fewer than three noisy pixels in the level2.evt file, extra rows are filled as -1
| Pixel properties | Quadrant properties | ||||||
|---|---|---|---|---|---|---|---|
| Quadrant | DetID | PixID | Counts | Sigma | Mean | Median | Sigma |
| A | 9 | 143 | 41280 | 221.65 | 897 | 874 | 182.3 |
| A | 13 | 254 | 9919 | 49.61 | 897 | 874 | 182.3 |
| A | 0 | 226 | 7752 | 37.73 | 897 | 874 | 182.3 |
| B | 12 | 111 | 21736 | 121.59 | 902 | 879 | 171.5 |
| B | 7 | 220 | 18891 | 105.0 | 902 | 879 | 171.5 |
| B | 11 | 111 | 18852 | 104.77 | 902 | 879 | 171.5 |
| C | 3 | 233 | 1006707 | 4969.61 | 864 | 868 | 202.4 |
| C | 14 | 238 | 134988 | 662.65 | 864 | 868 | 202.4 |
| C | 13 | 61 | 6109 | 25.89 | 864 | 868 | 202.4 |
| D | 11 | 176 | 636736 | 2996.71 | 869 | 842 | 212.2 |
| D | 5 | 222 | 321616 | 1511.67 | 869 | 842 | 212.2 |
| D | 1 | 52 | 58298 | 270.76 | 869 | 842 | 212.2 |
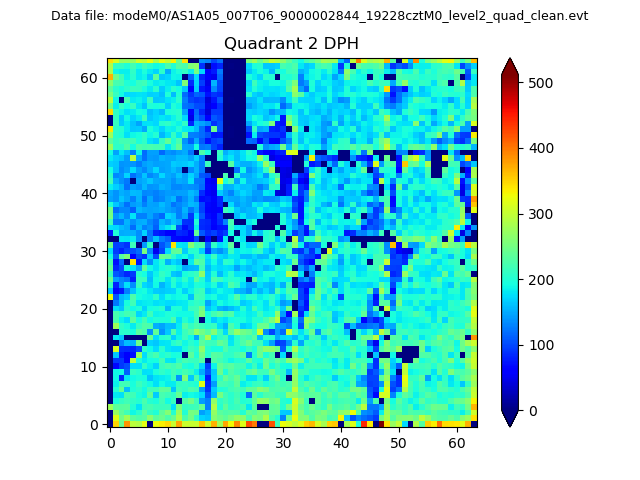
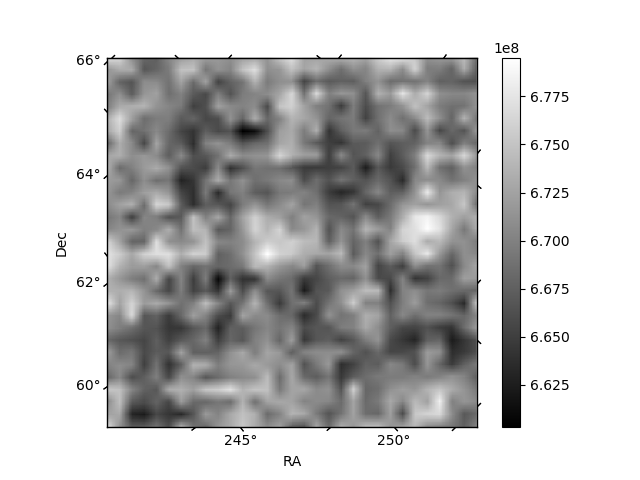
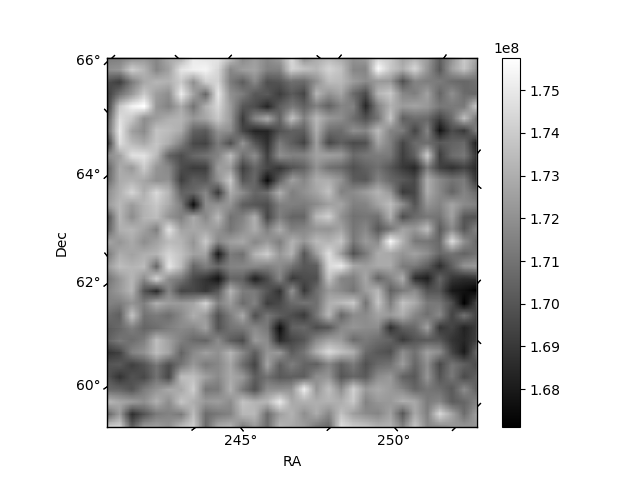
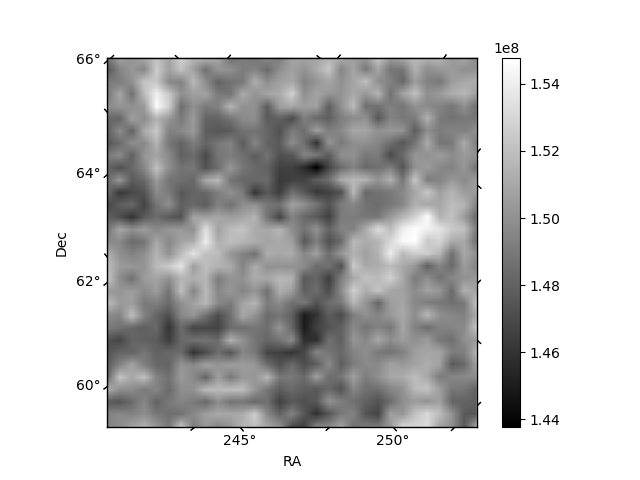
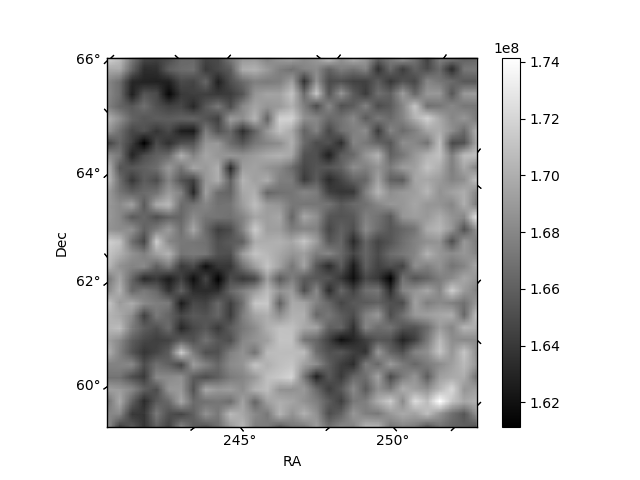
Histogram calculated using DETX and DETY for each event in the final _common_clean file
| Quadrant A | 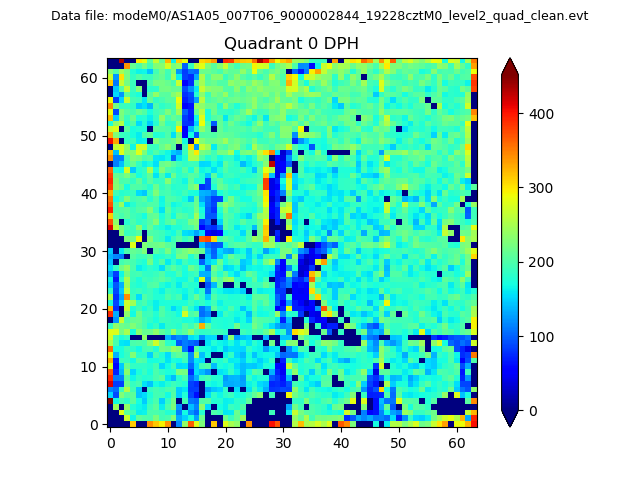 |
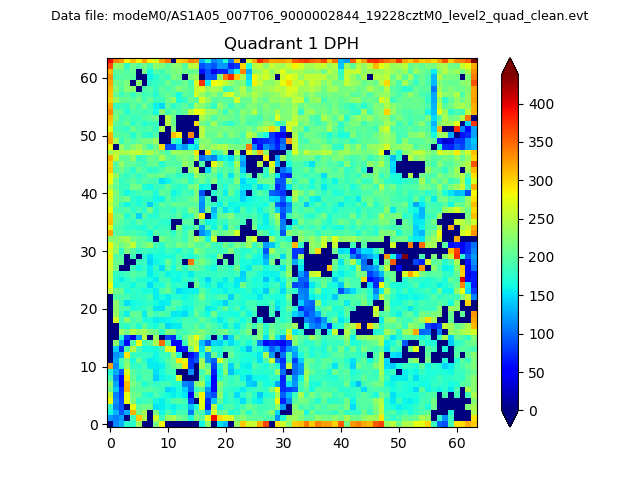 |
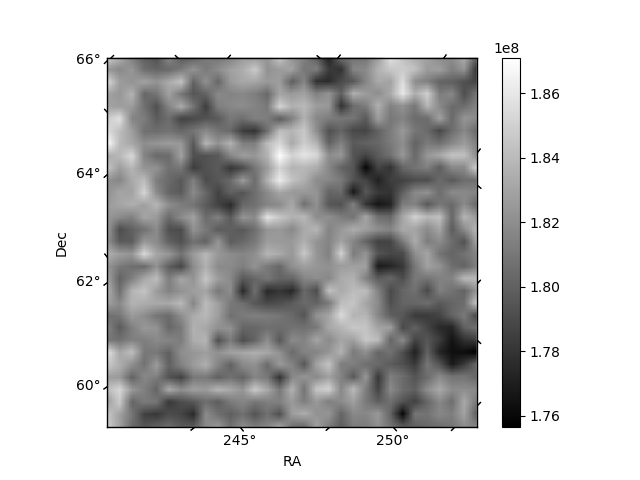
Quadrant B |
|---|---|---|---|
| Quadrant D | 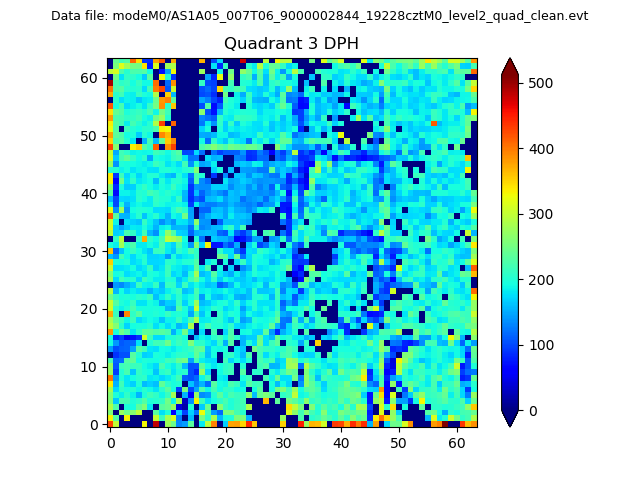 |
 |
Quadrant C |
| Plot type | Count rate plots | Images |
|---|---|---|
| Comparison with Poisson distribution Blue bars denote a histogram of data divided into 1 sec bins. Red curve is a Poisson curve with rate = median count rate of data. |
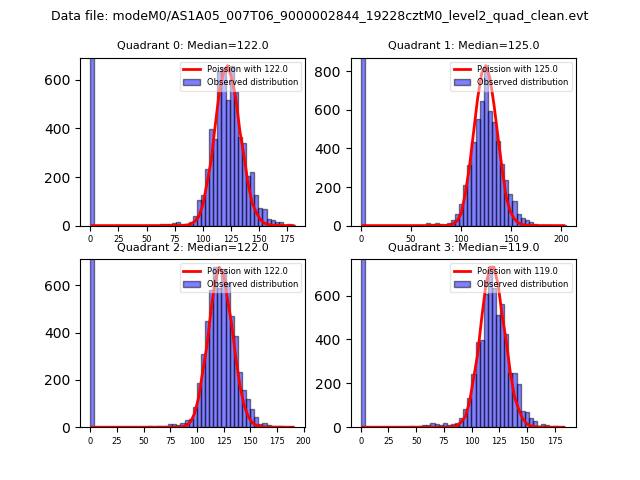 |
 |
| Quadrant-wise count rates Data is divided into 100 sec bins |
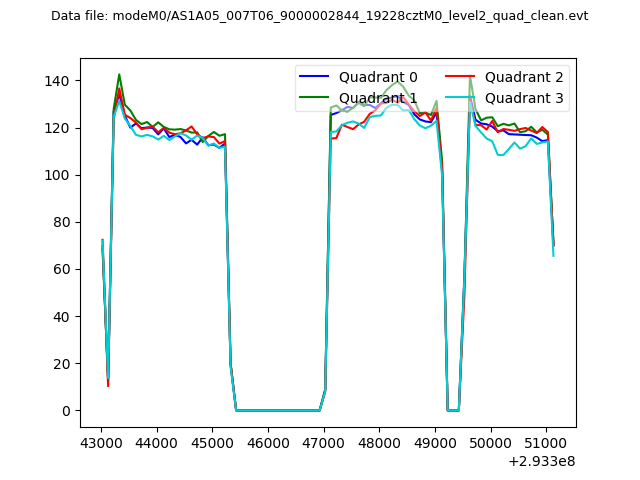 |
|
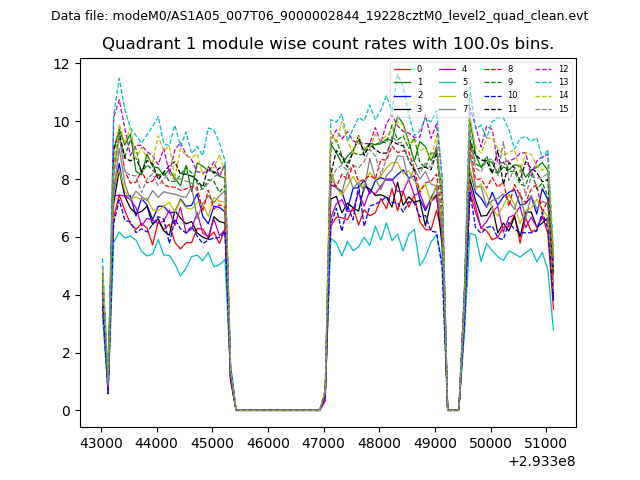
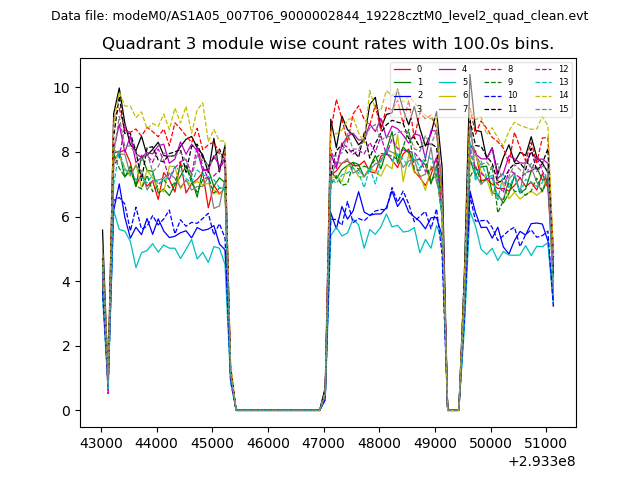
| Module-wise count rates for Quadrant A Data is divided into 100 sec bins |
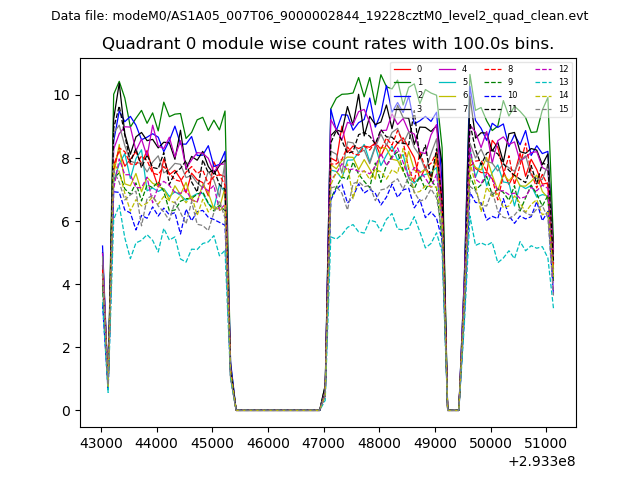 |
 |
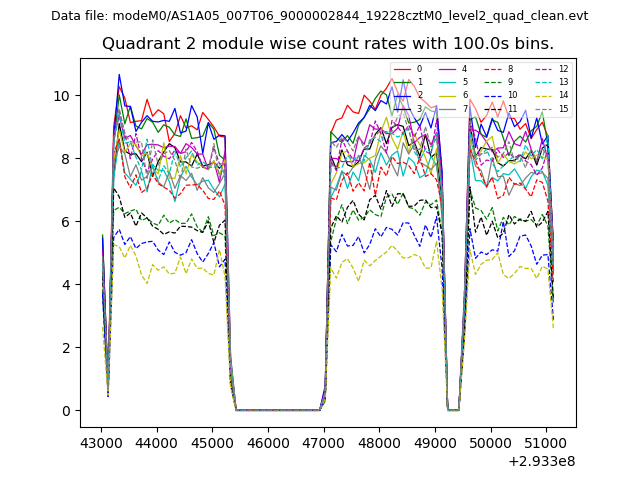
| Module-wise count rates for Quadrant B Data is divided into 100 sec bins |
 |
 |
| Module-wise count rates for Quadrant C Data is divided into 100 sec bins |
 |
 |
| Module-wise count rates for Quadrant D Data is divided into 100 sec bins |
 |
 |
| Parameter | Plot |
|---|---|
| CZT HV Monitor | 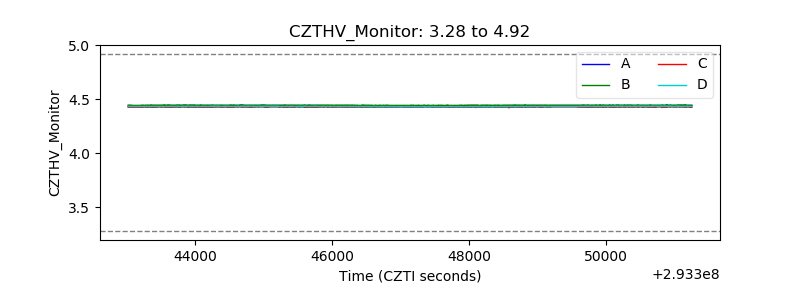 |
| D_VDD | 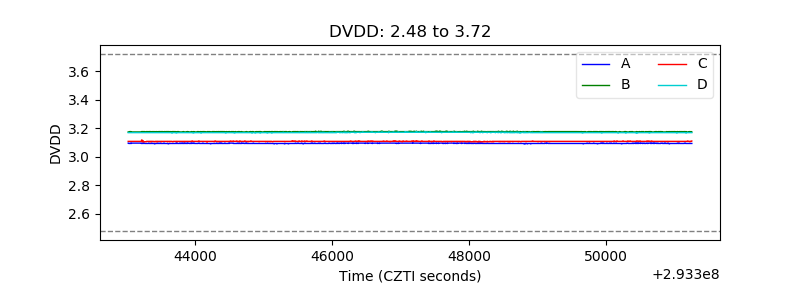 |
| Temperature 1 | 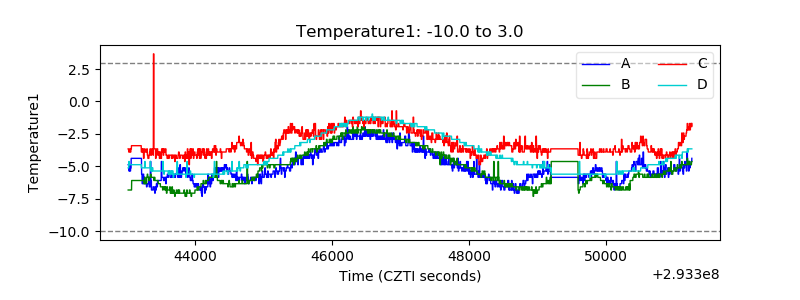 |
| Veto HV Monitor | 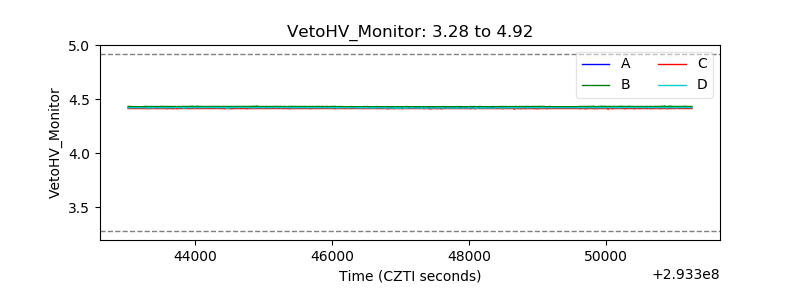 |
| Veto LLD | 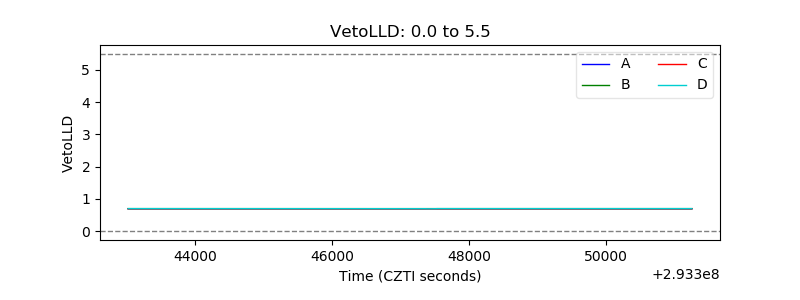 |
| Alpha Counter | 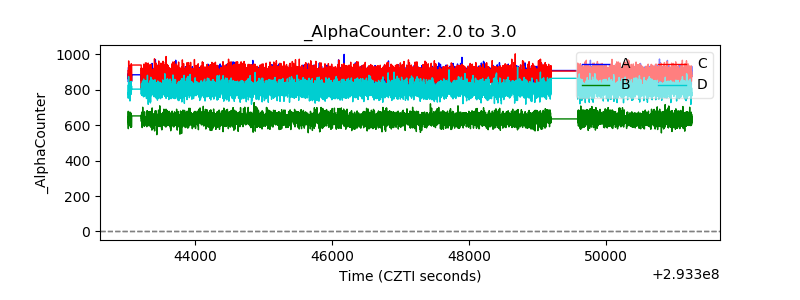 |
| _CPM_Rate | 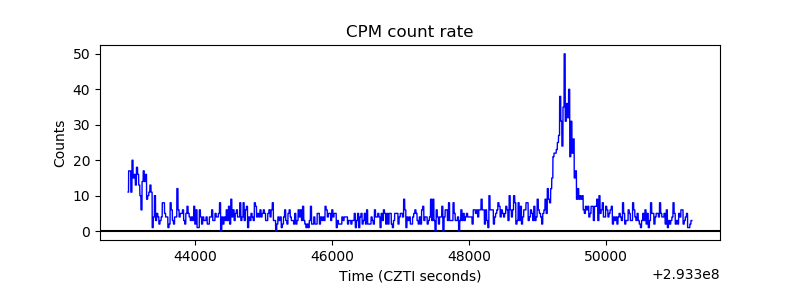 |
| CZT Counter | 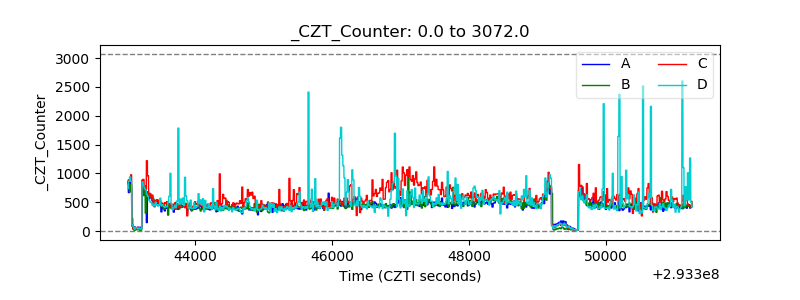 |
| +2.5 Volts monitor |  |
| +5 Volts monitor |  |
| _ROLL_ROT | 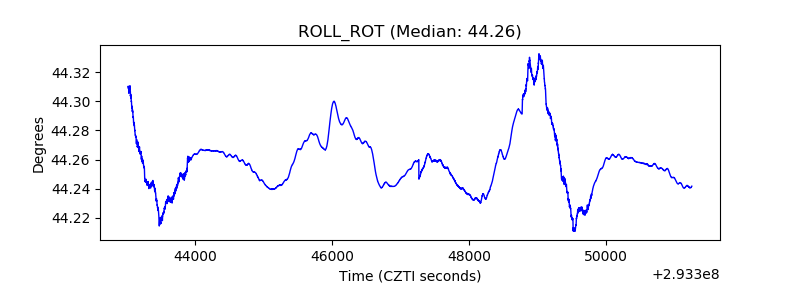 |
| _Roll_DEC | 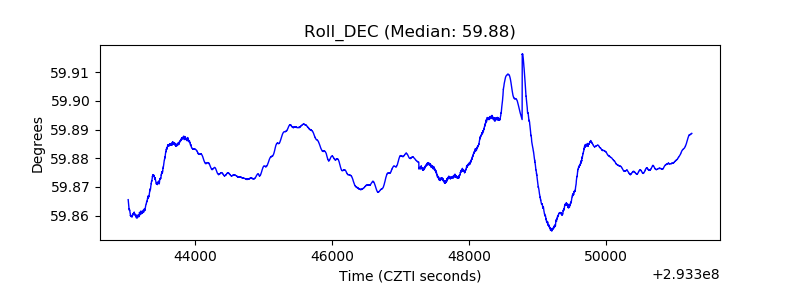 |
| _Roll_RA | 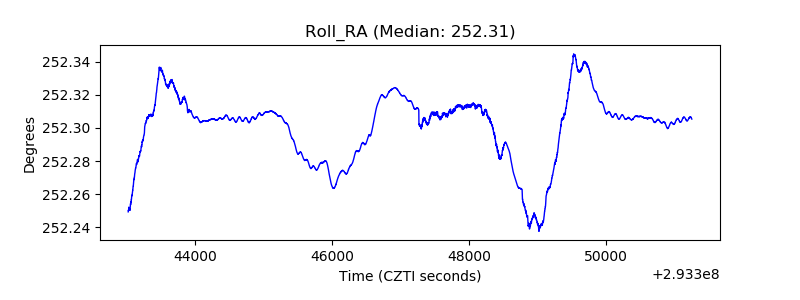 |
| Veto Counter | 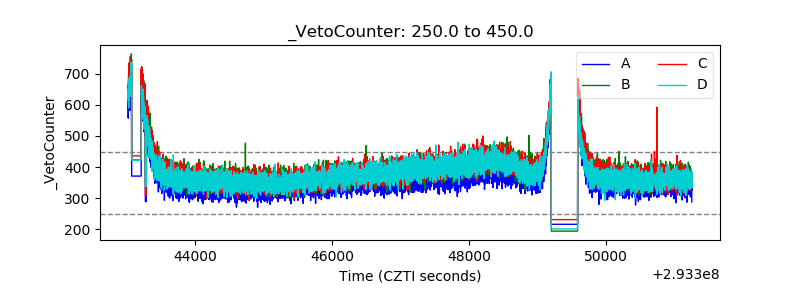 |