| Param | Original file | Final file |
|---|---|---|
| Filename | modeM0/AS1A05_007T06_9000002844_19230cztM0_level2.evt | modeM0/AS1A05_007T06_9000002844_19230cztM0_level2_quad_clean.evt |
| Size (bytes) | 856,537,920 | 152,784,000 |
| Size | 816.9 MB | 145.7 MB |
| Events in quadrant A | 5,471,001 | 955,799 |
| Events in quadrant B | 5,670,583 | 974,707 |
| Events in quadrant C | 7,276,995 | 942,705 |
| Events in quadrant D | 6,704,782 | 919,441 |
| Mode SS | |||
|---|---|---|---|
| Quadrant | BADHDUFLAG | Total packets | Discarded packets |
| A | 0 | 244 | 0 |
| B | 0 | 244 | 0 |
| C | 0 | 244 | 0 |
| D | 0 | 244 | 0 |
| Mode M9 | |||
|---|---|---|---|
| Quadrant | BADHDUFLAG | Total packets | Discarded packets |
| A | 0 | 14 | 0 |
| B | 0 | 14 | 0 |
| C | 0 | 14 | 0 |
| D | 0 | 14 | 0 |
| Mode M0 | |||
|---|---|---|---|
| Quadrant | BADHDUFLAG | Total packets | Discarded packets |
| A | 0 | 24418 | 3 |
| B | 0 | 24664 | 2 |
| C | 0 | 29592 | 2 |
| D | 0 | 28418 | 2 |
| Quadrant | Total seconds | Saturated seconds | Saturation percentage |
|---|---|---|---|
| A | 12072 | 105 | 0.869781% |
| B | 12072 | 123 | 1.018887% |
| C | 12072 | 196 | 1.623592% |
| D | 12072 | 426 | 3.528827% |
Noise dominated data is calculated using 1-second bins in cleaned event files. If a bin has >2000 counts, and if more than 50% of those come from <1% of pixels, then it is considered to be noise-dominated and hence unusable.
| Quadrant | # 1 sec bins | Bins with >0 counts | Bins with >2000 counts | High rate bins dominated by noise | Noise dominated (total time) | Noise dominated (detector-on time) | Marked lightcurve |
|---|---|---|---|---|---|---|---|
| A | 13412 | 12072 | 0 | 0 | 0.00% | 0.00% | 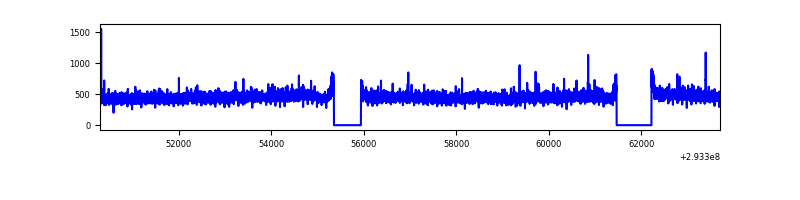 |
| B | 13412 | 12074 | 2 | 2 | 0.01% | 0.02% | 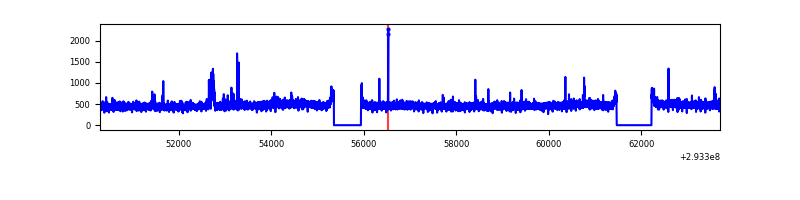 |
| C | 13412 | 12072 | 1 | 1 | 0.01% | 0.01% | 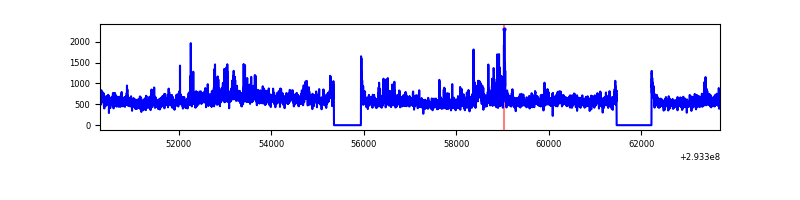 |
| D | 13412 | 12074 | 296 | 296 | 2.21% | 2.45% | 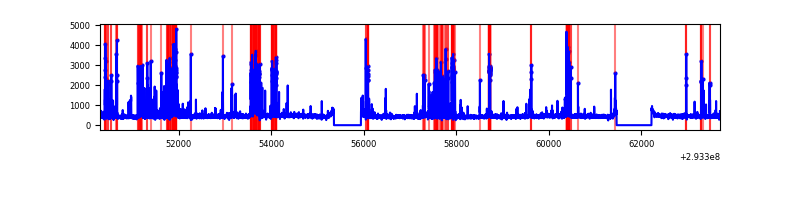 |
Top three noisy pixels from each quadrant. If the there are fewer than three noisy pixels in the level2.evt file, extra rows are filled as -1
| Pixel properties | Quadrant properties | ||||||
|---|---|---|---|---|---|---|---|
| Quadrant | DetID | PixID | Counts | Sigma | Mean | Median | Sigma |
| A | 9 | 143 | 14666 | 46.51 | 1416 | 1384 | 285.6 |
| A | 13 | 254 | 14126 | 44.62 | 1416 | 1384 | 285.6 |
| A | 0 | 226 | 12261 | 38.09 | 1416 | 1384 | 285.6 |
| B | 7 | 220 | 52129 | 186.94 | 1416 | 1377 | 271.5 |
| B | 12 | 111 | 33590 | 118.65 | 1416 | 1377 | 271.5 |
| B | 11 | 111 | 29369 | 103.1 | 1416 | 1377 | 271.5 |
| C | 3 | 233 | 1754244 | 5568.27 | 1357 | 1367 | 314.8 |
| C | 14 | 238 | 210396 | 664.01 | 1357 | 1367 | 314.8 |
| C | 0 | 207 | 12117 | 34.15 | 1357 | 1367 | 314.8 |
| D | 11 | 176 | 1437270 | 4377.3 | 1361 | 1321 | 328.0 |
| D | 2 | 234 | 54095 | 160.87 | 1361 | 1321 | 328.0 |
| D | 1 | 52 | 51575 | 153.19 | 1361 | 1321 | 328.0 |
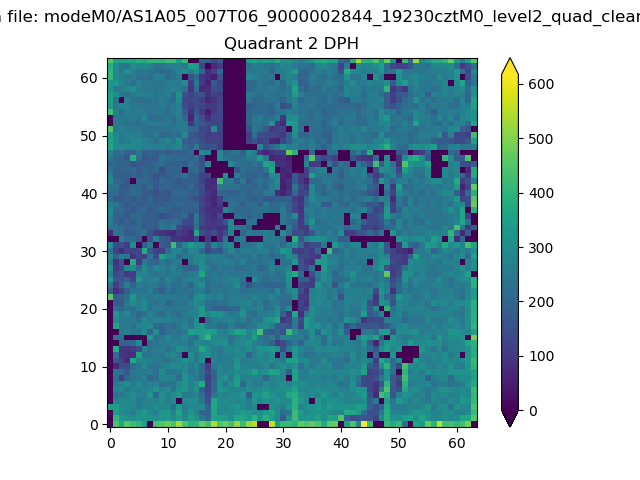
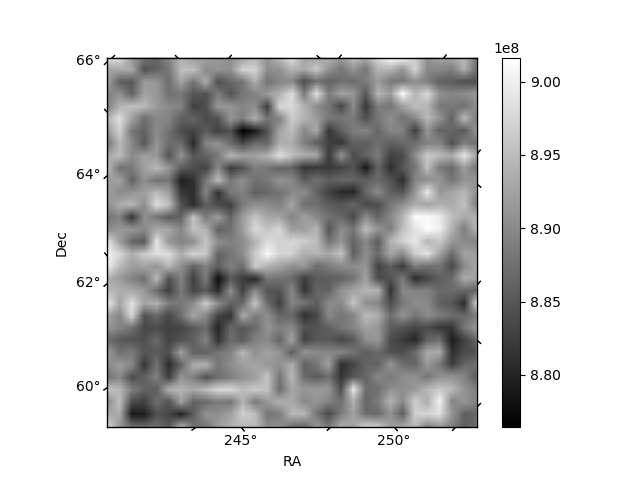
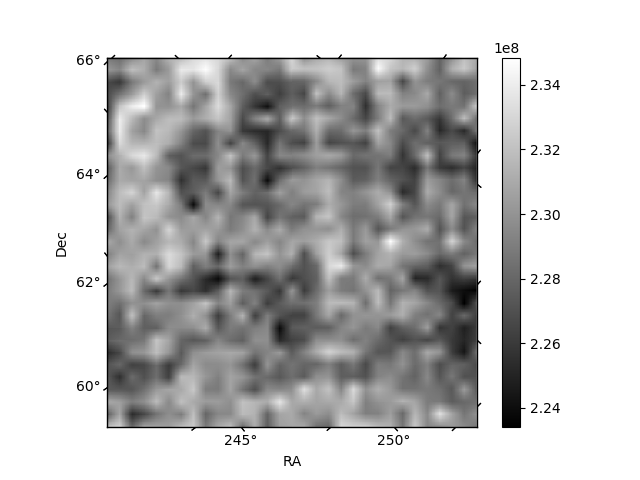
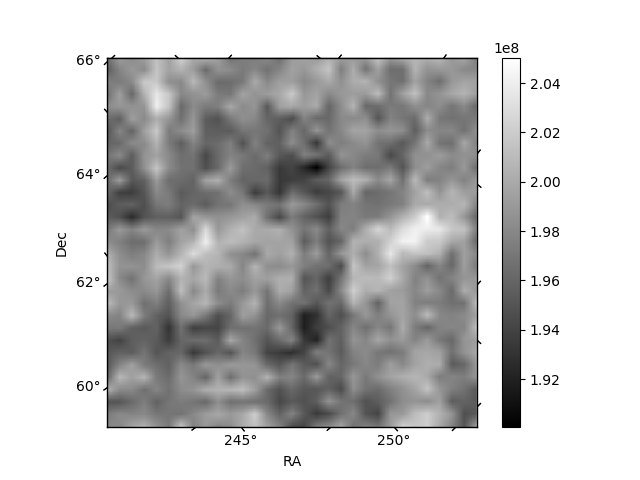
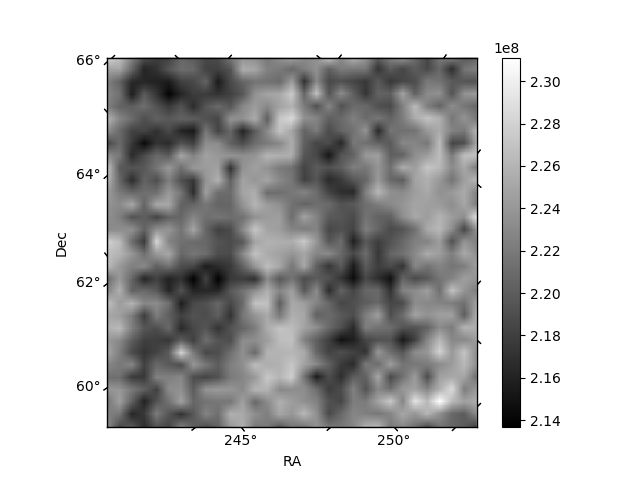
Histogram calculated using DETX and DETY for each event in the final _common_clean file
| Quadrant A | 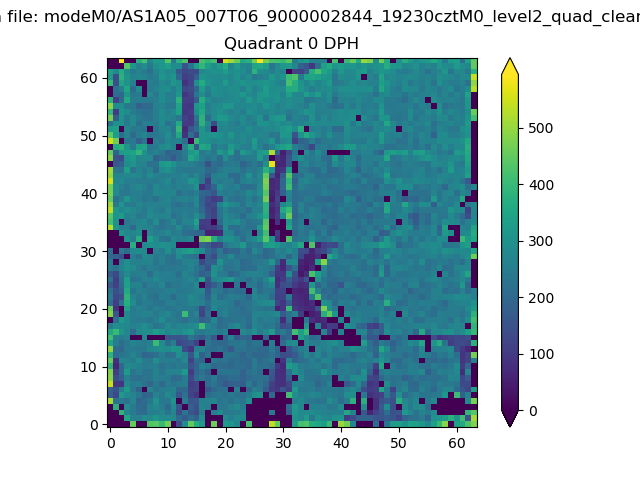 |
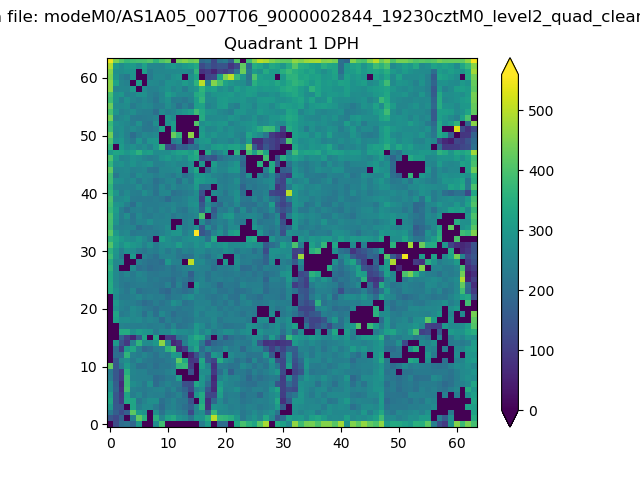 |
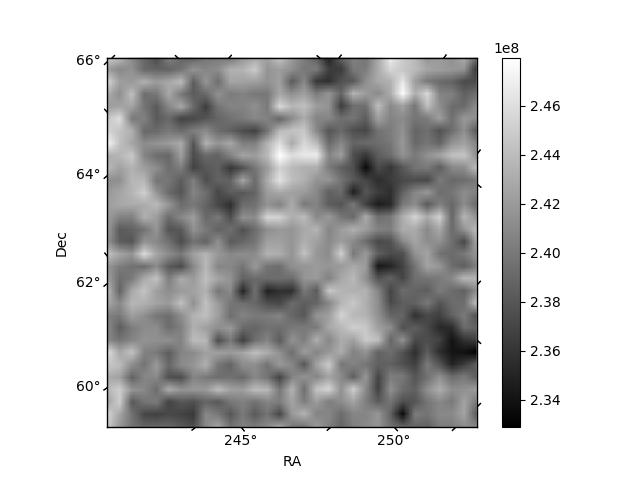
Quadrant B |
|---|---|---|---|
| Quadrant D | 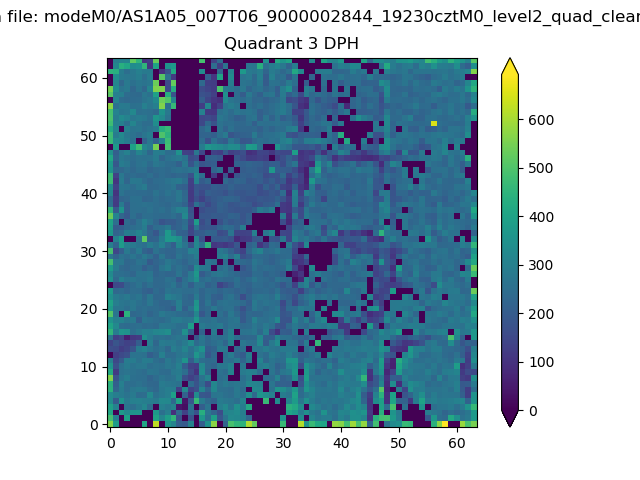 |
 |
Quadrant C |
| Plot type | Count rate plots | Images |
|---|---|---|
| Comparison with Poisson distribution Blue bars denote a histogram of data divided into 1 sec bins. Red curve is a Poisson curve with rate = median count rate of data. |
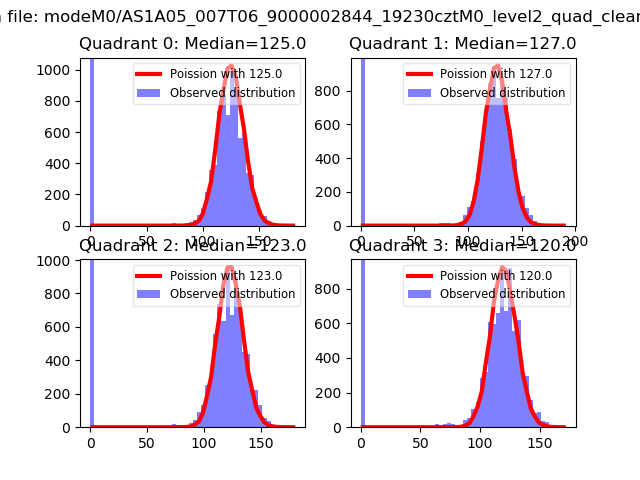 |
 |
| Quadrant-wise count rates Data is divided into 100 sec bins |
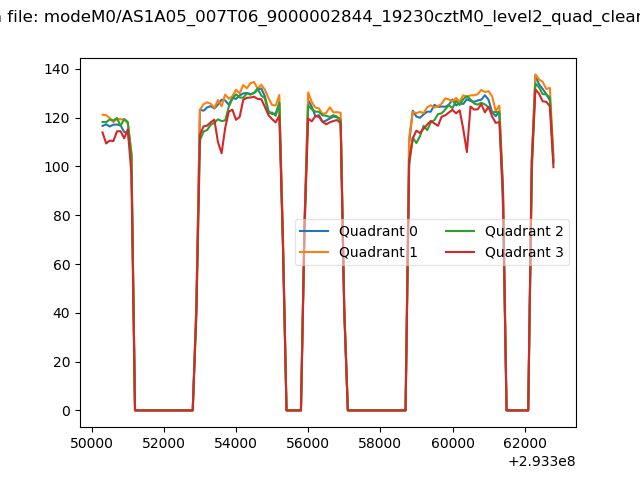 |
|
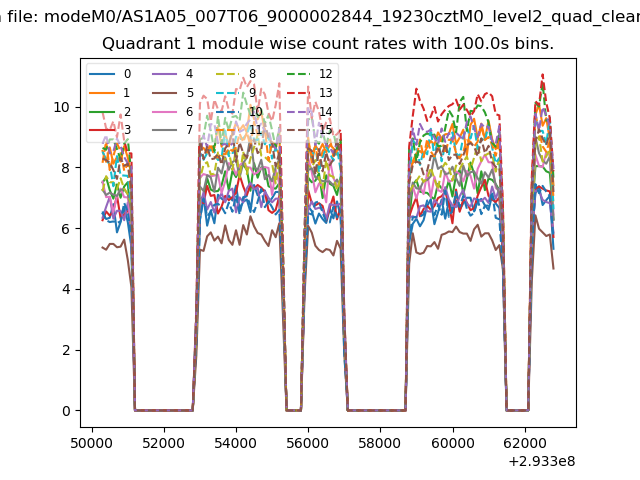
| Module-wise count rates for Quadrant A Data is divided into 100 sec bins |
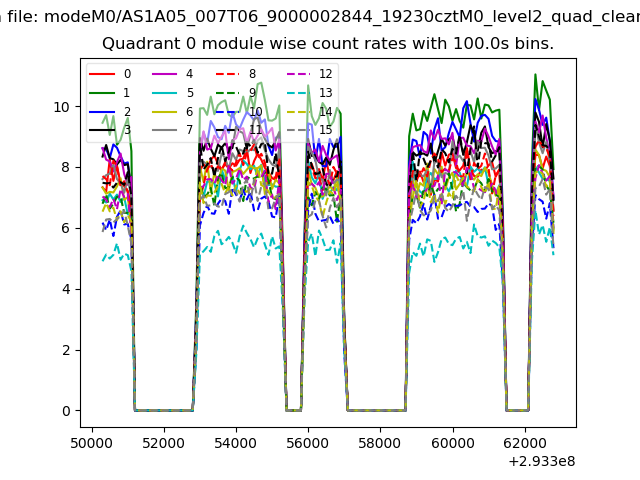 |
 |
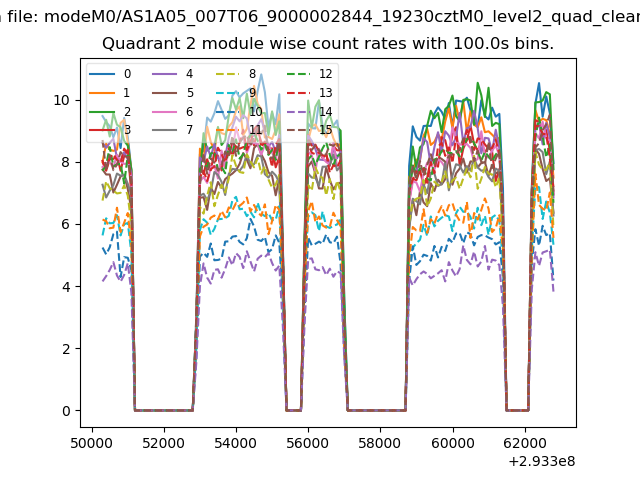
| Module-wise count rates for Quadrant B Data is divided into 100 sec bins |
 |
 |
| Module-wise count rates for Quadrant C Data is divided into 100 sec bins |
 |
 |
| Module-wise count rates for Quadrant D Data is divided into 100 sec bins |
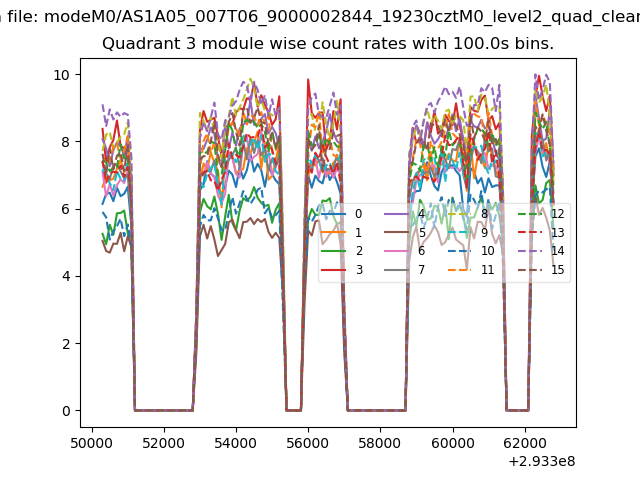 |
 |
| Parameter | Plot |
|---|---|
| CZT HV Monitor | 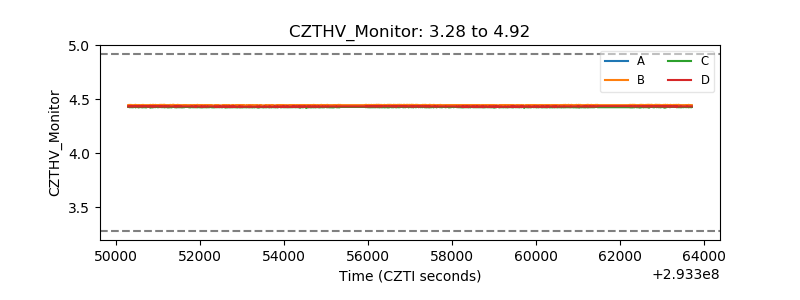 |
| D_VDD | 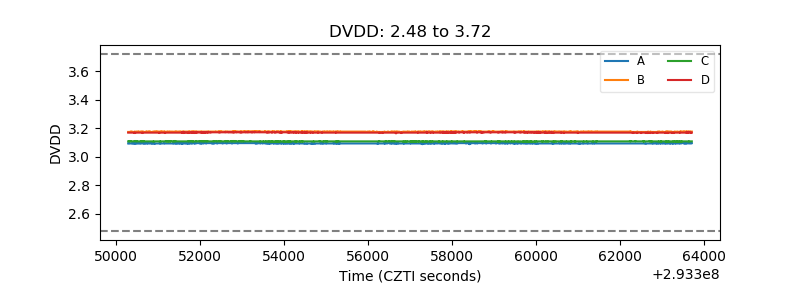 |
| Temperature 1 | 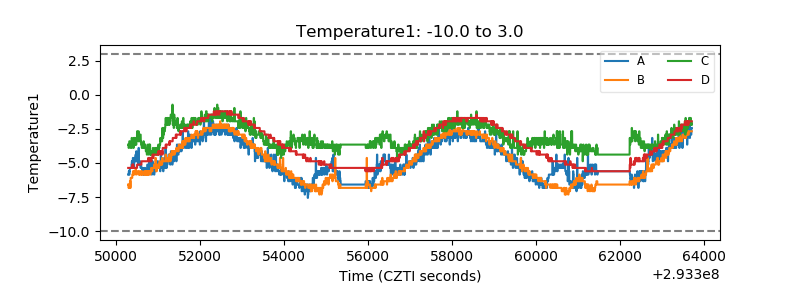 |
| Veto HV Monitor | 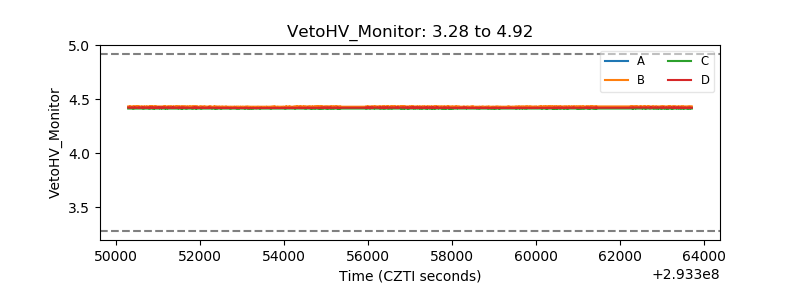 |
| Veto LLD | 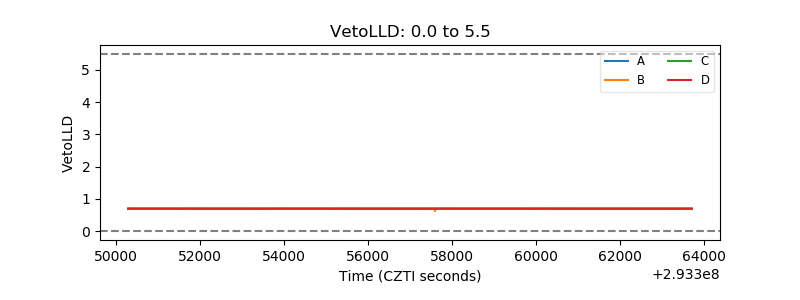 |
| Alpha Counter | 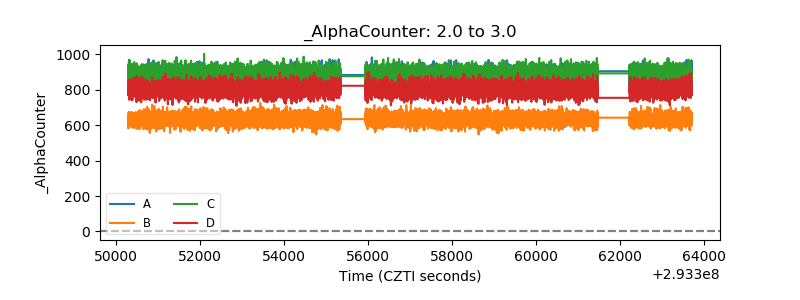 |
| _CPM_Rate | 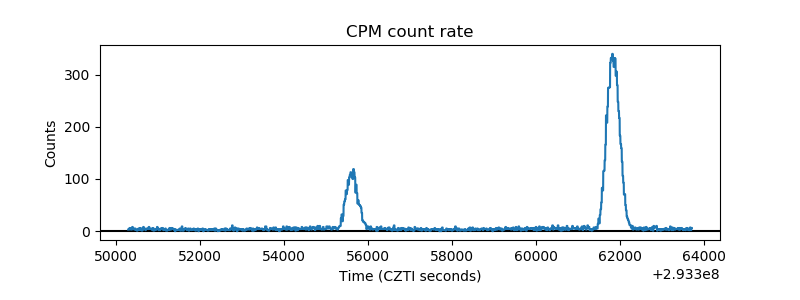 |
| CZT Counter | 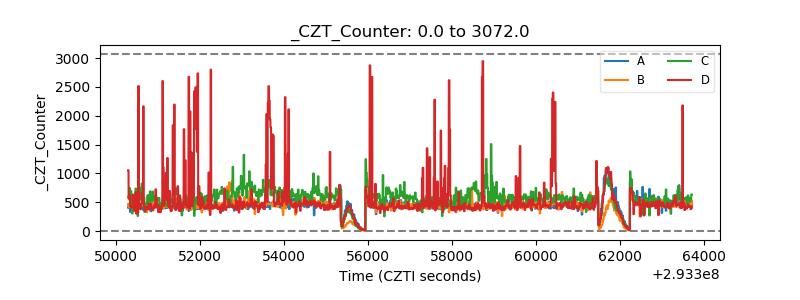 |
| +2.5 Volts monitor |  |
| +5 Volts monitor |  |
| _ROLL_ROT | 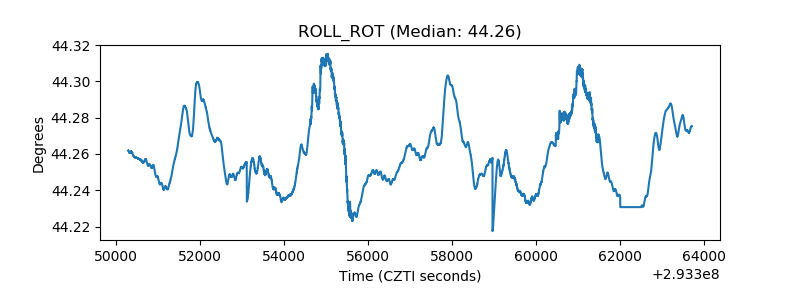 |
| _Roll_DEC | 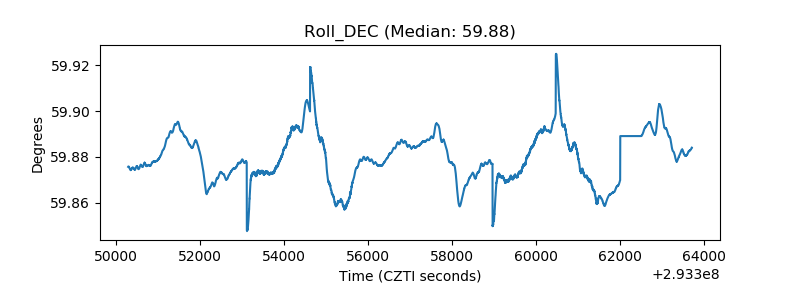 |
| _Roll_RA | 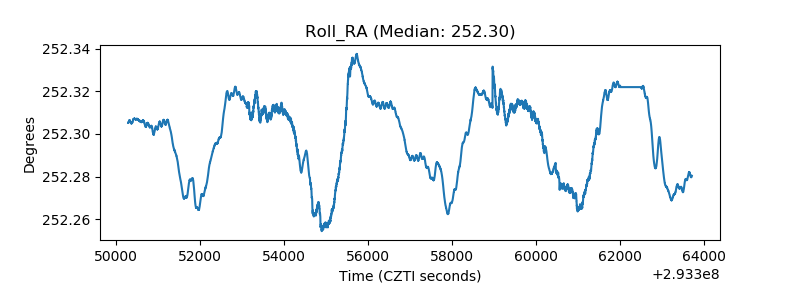 |
| Veto Counter | 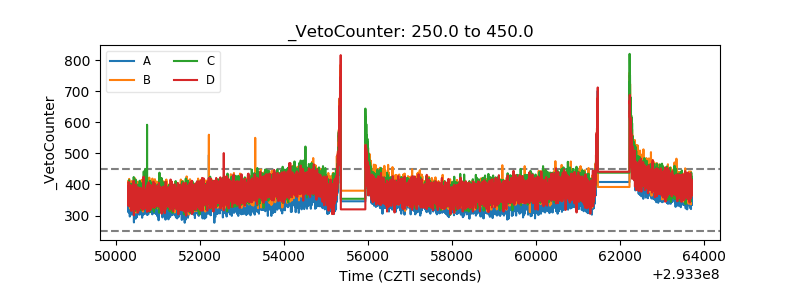 |