| Param | Original file | Final file |
|---|---|---|
| Filename | modeM0/AS1A05_007T06_9000002844_19231cztM0_level2.evt | modeM0/AS1A05_007T06_9000002844_19231cztM0_level2_quad_clean.evt |
| Size (bytes) | 277,721,280 | 48,720,960 |
| Size | 264.9 MB | 46.5 MB |
| Events in quadrant A | 1,870,969 | 298,670 |
| Events in quadrant B | 1,921,995 | 303,026 |
| Events in quadrant C | 2,436,238 | 290,776 |
| Events in quadrant D | 1,896,302 | 288,185 |
| Mode SS | |||
|---|---|---|---|
| Quadrant | BADHDUFLAG | Total packets | Discarded packets |
| A | 0 | 82 | 0 |
| B | 0 | 82 | 0 |
| C | 0 | 82 | 0 |
| D | 0 | 82 | 0 |
| Mode M0 | |||
|---|---|---|---|
| Quadrant | BADHDUFLAG | Total packets | Discarded packets |
| A | 0 | 8405 | 0 |
| B | 0 | 8431 | 0 |
| C | 0 | 9887 | 0 |
| D | 0 | 8628 | 0 |
| Quadrant | Total seconds | Saturated seconds | Saturation percentage |
|---|---|---|---|
| A | 4180 | 3 | 0.071770% |
| B | 4181 | 0 | 0.000000% |
| C | 4181 | 15 | 0.358766% |
| D | 4181 | 19 | 0.454437% |
Noise dominated data is calculated using 1-second bins in cleaned event files. If a bin has >2000 counts, and if more than 50% of those come from <1% of pixels, then it is considered to be noise-dominated and hence unusable.
| Quadrant | # 1 sec bins | Bins with >0 counts | Bins with >2000 counts | High rate bins dominated by noise | Noise dominated (total time) | Noise dominated (detector-on time) | Marked lightcurve |
|---|---|---|---|---|---|---|---|
| A | 4180 | 4180 | 2 | 2 | 0.05% | 0.05% | 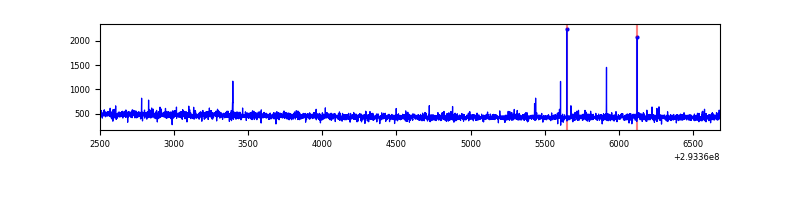 |
| B | 4181 | 4181 | 0 | 0 | 0.00% | 0.00% | 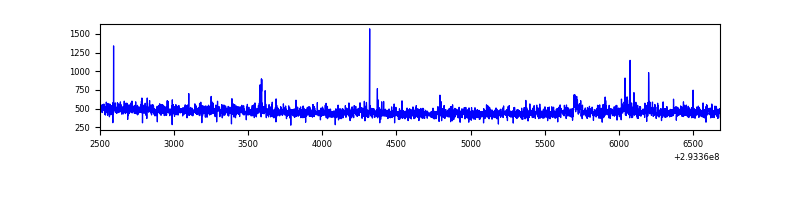 |
| C | 4181 | 4181 | 1 | 1 | 0.02% | 0.02% | 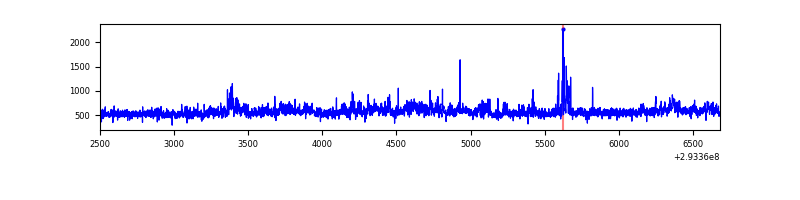 |
| D | 4181 | 4181 | 14 | 14 | 0.33% | 0.33% | 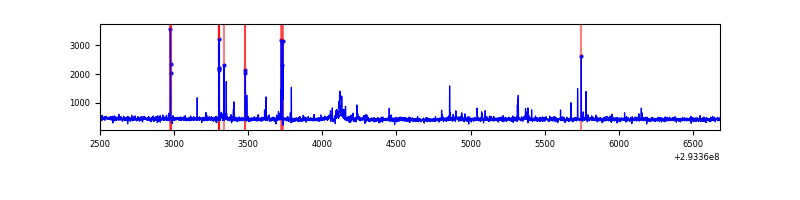 |
Top three noisy pixels from each quadrant. If the there are fewer than three noisy pixels in the level2.evt file, extra rows are filled as -1
| Pixel properties | Quadrant properties | ||||||
|---|---|---|---|---|---|---|---|
| Quadrant | DetID | PixID | Counts | Sigma | Mean | Median | Sigma |
| A | 9 | 143 | 6872 | 65.18 | 483 | 471 | 98.2 |
| A | 13 | 254 | 5025 | 46.37 | 483 | 471 | 98.2 |
| A | 0 | 226 | 4172 | 37.69 | 483 | 471 | 98.2 |
| B | 0 | 229 | 16932 | 176.87 | 480 | 467 | 93.1 |
| B | 0 | 183 | 11356 | 116.97 | 480 | 467 | 93.1 |
| B | 12 | 111 | 11287 | 116.23 | 480 | 467 | 93.1 |
| C | 3 | 233 | 559068 | 5161.28 | 462 | 465 | 108.2 |
| C | 14 | 238 | 72327 | 663.98 | 462 | 465 | 108.2 |
| C | 13 | 61 | 3254 | 25.77 | 462 | 465 | 108.2 |
| D | 11 | 176 | 74707 | 649.67 | 470 | 456 | 114.3 |
| D | 2 | 234 | 18060 | 154.03 | 470 | 456 | 114.3 |
| D | 12 | 16 | 16297 | 138.6 | 470 | 456 | 114.3 |
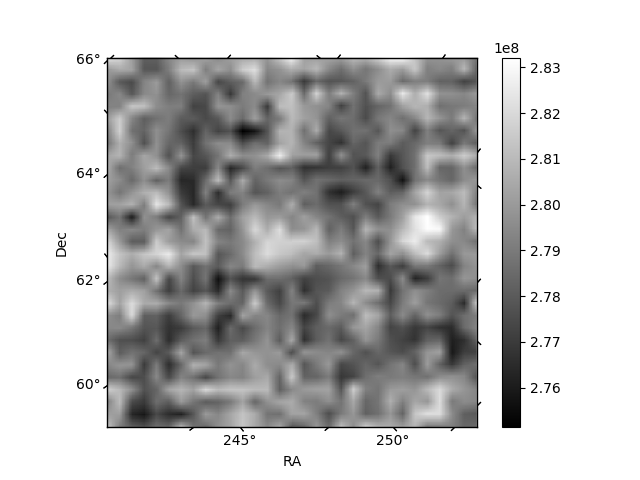
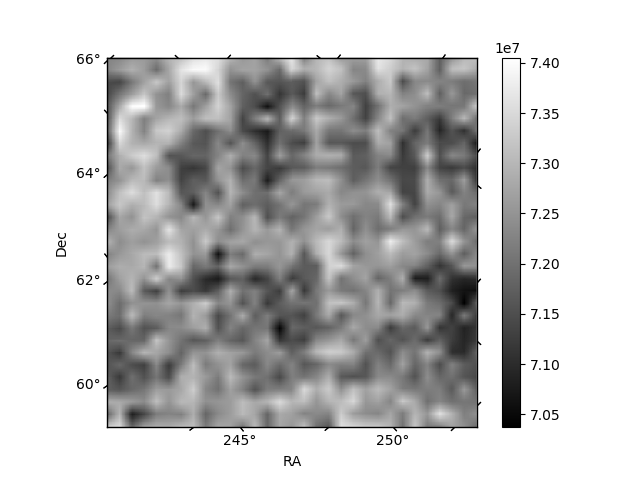
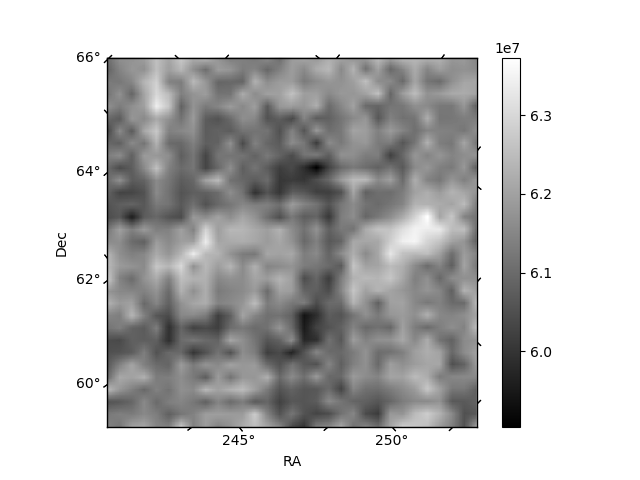
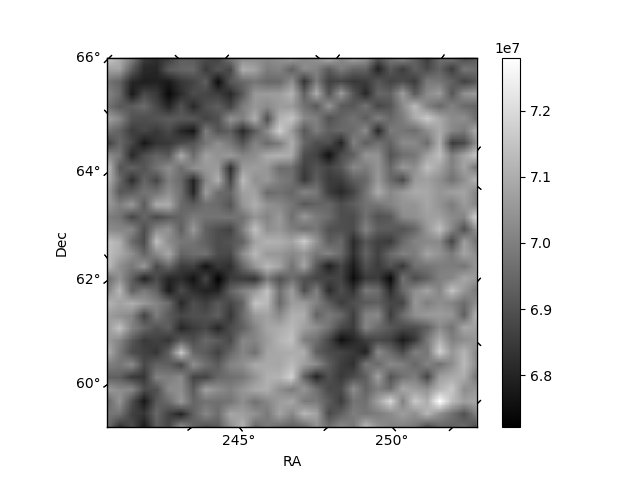
Histogram calculated using DETX and DETY for each event in the final _common_clean file
| Quadrant A | 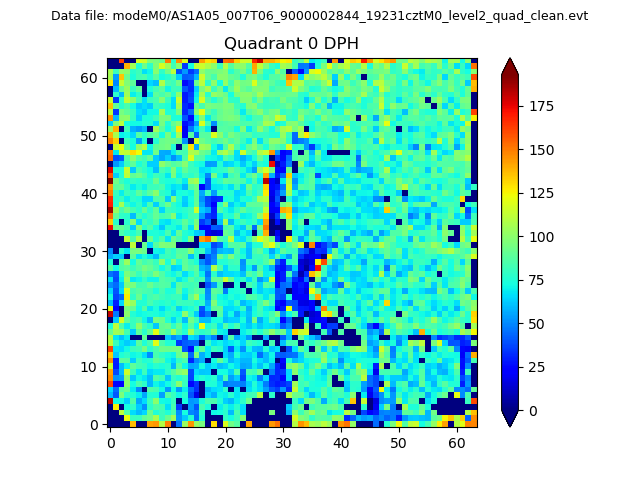 |
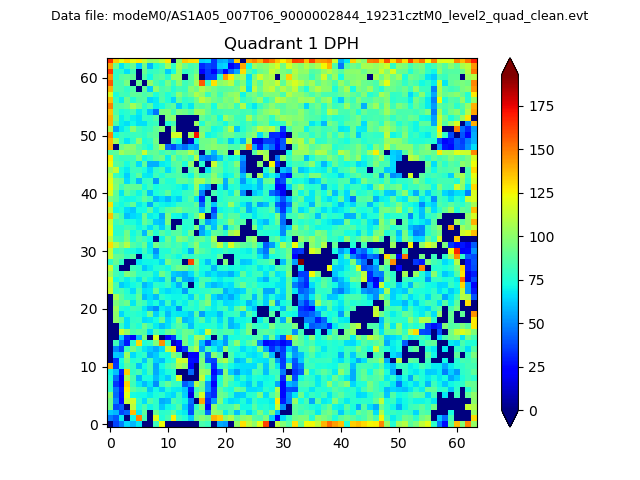 |
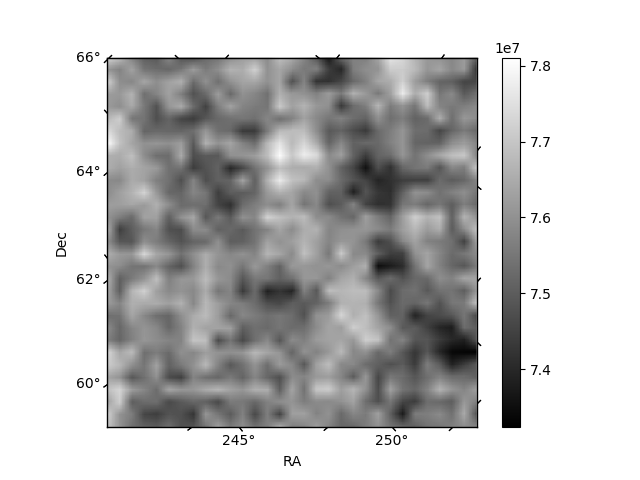
Quadrant B |
|---|---|---|---|
| Quadrant D | 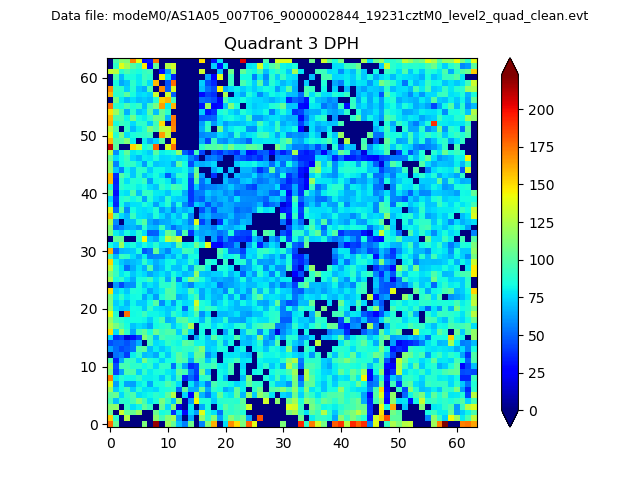 |
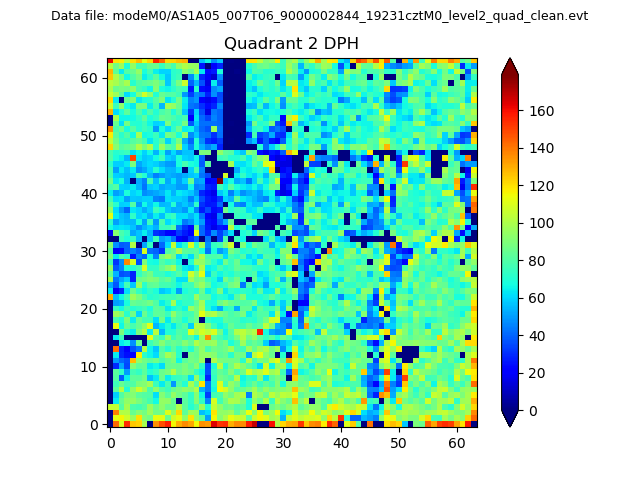 |
Quadrant C |
| Plot type | Count rate plots | Images |
|---|---|---|
| Comparison with Poisson distribution Blue bars denote a histogram of data divided into 1 sec bins. Red curve is a Poisson curve with rate = median count rate of data. |
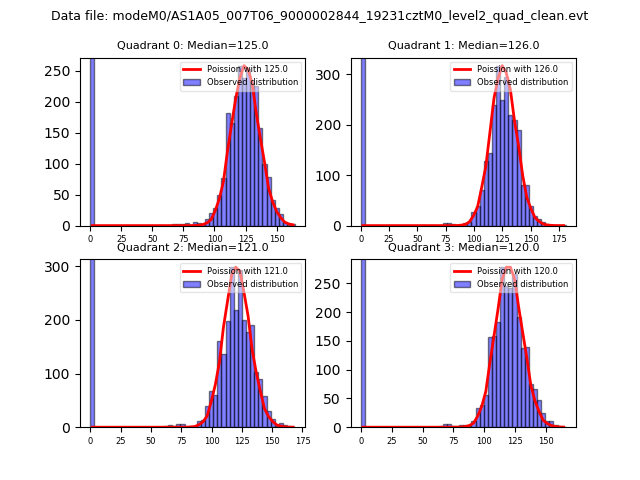 |
 |
| Quadrant-wise count rates Data is divided into 100 sec bins |
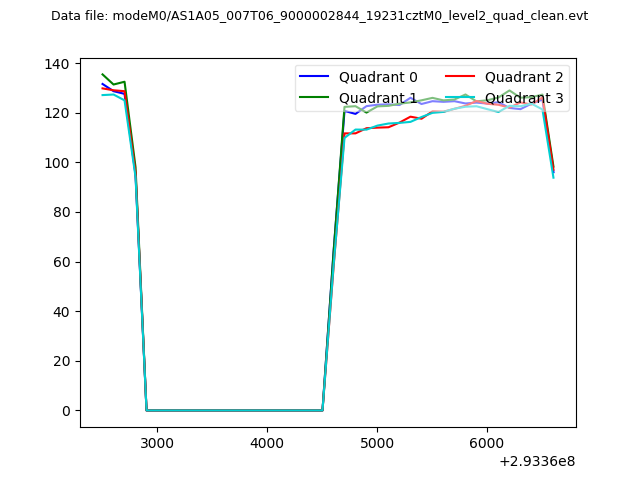 |
|
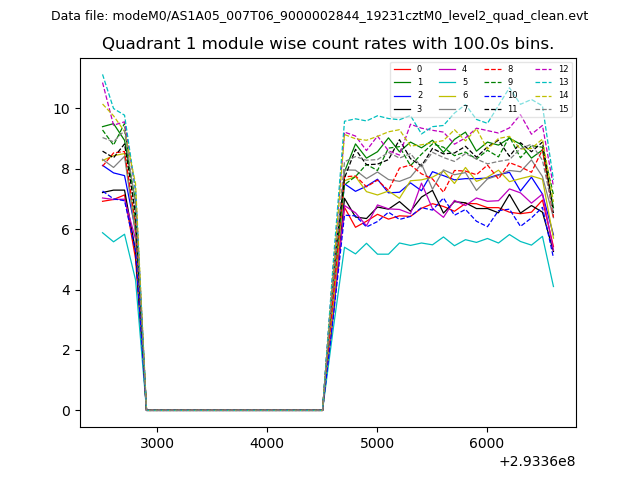
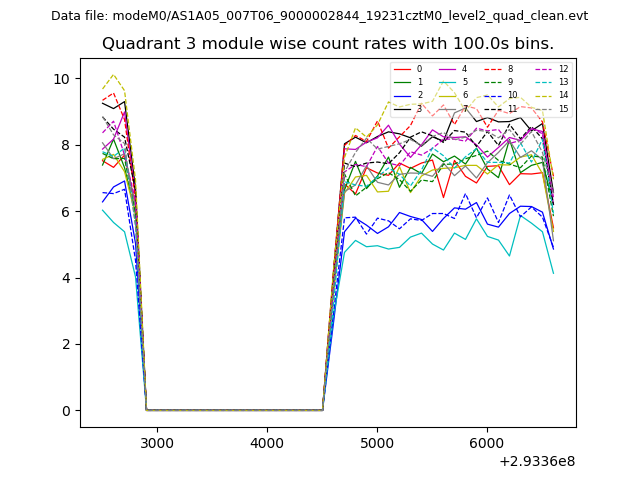
| Module-wise count rates for Quadrant A Data is divided into 100 sec bins |
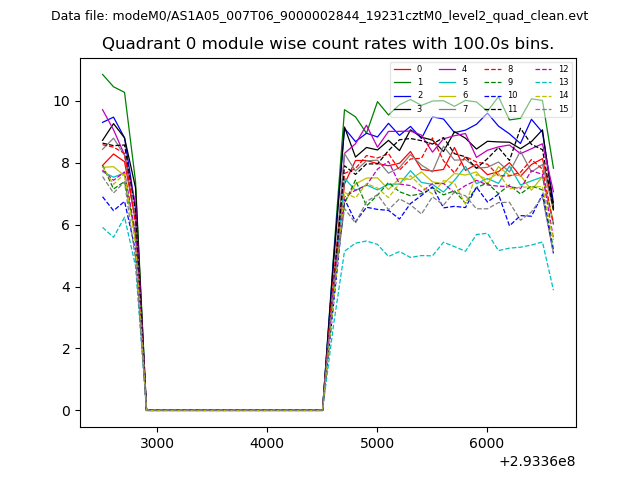 |
 |
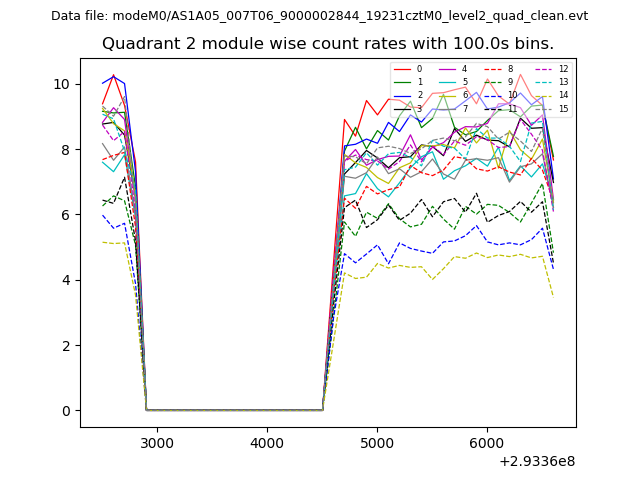
| Module-wise count rates for Quadrant B Data is divided into 100 sec bins |
 |
 |
| Module-wise count rates for Quadrant C Data is divided into 100 sec bins |
 |
 |
| Module-wise count rates for Quadrant D Data is divided into 100 sec bins |
 |
 |
| Parameter | Plot |
|---|---|
| CZT HV Monitor | 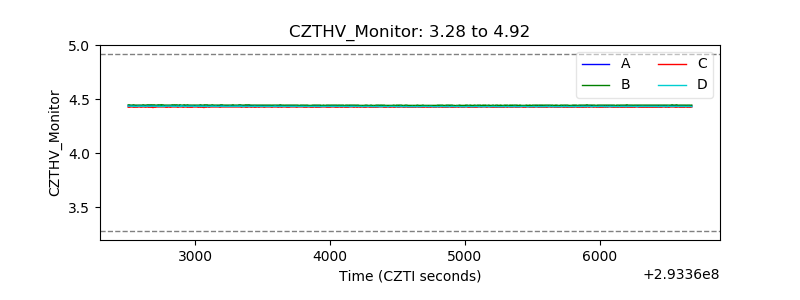 |
| D_VDD | 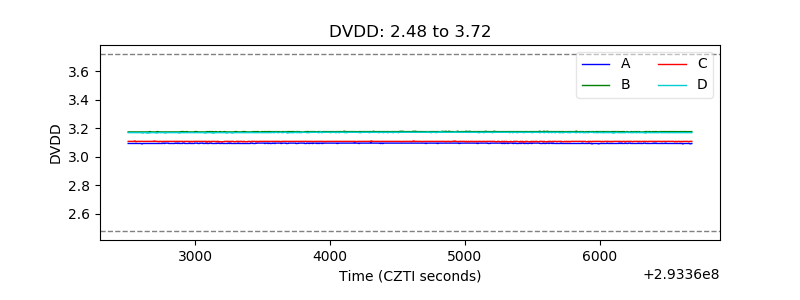 |
| Temperature 1 | 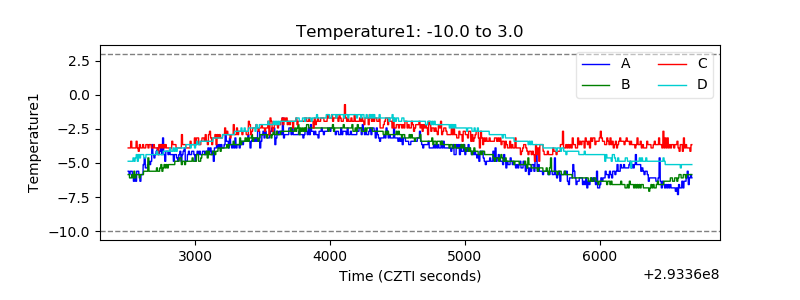 |
| Veto HV Monitor |  |
| Veto LLD | 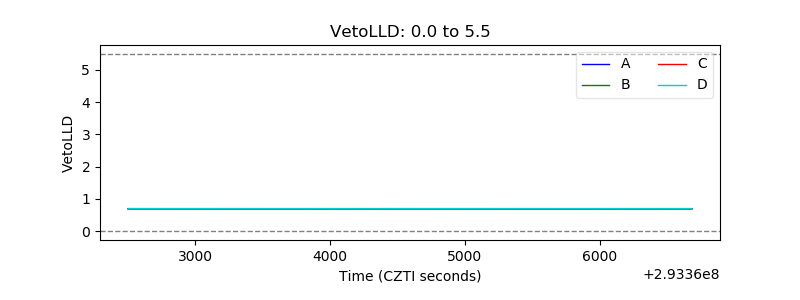 |
| Alpha Counter |  |
| _CPM_Rate | 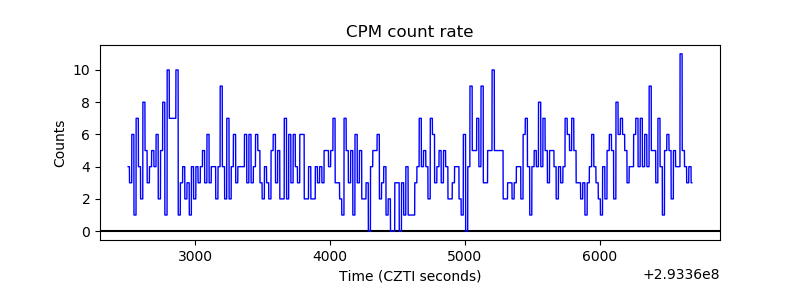 |
| CZT Counter | 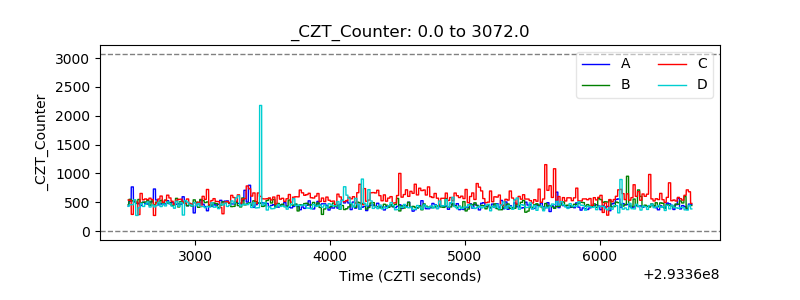 |
| +2.5 Volts monitor |  |
| +5 Volts monitor |  |
| _ROLL_ROT | 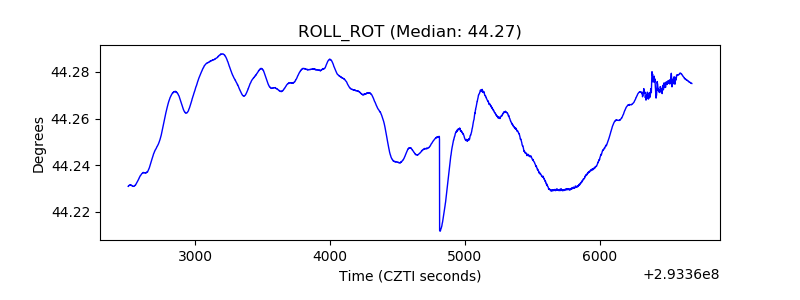 |
| _Roll_DEC | 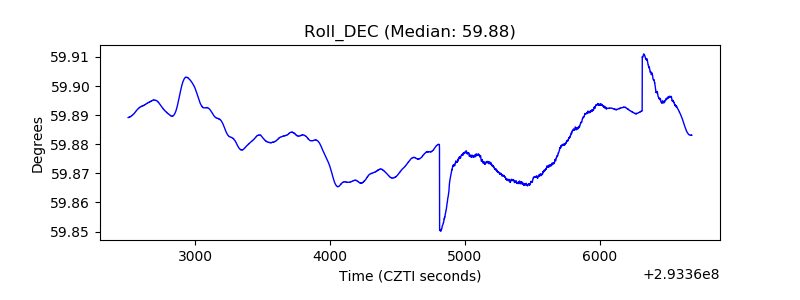 |
| _Roll_RA | 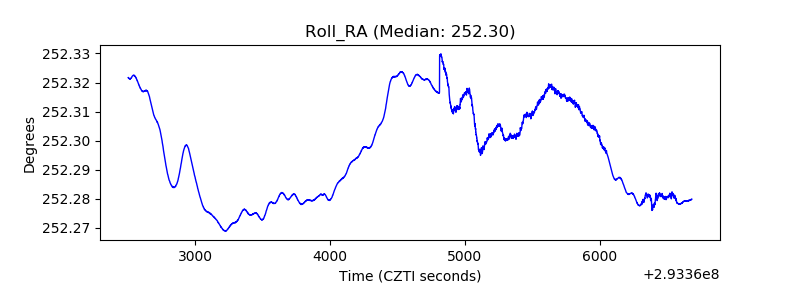 |
| Veto Counter | 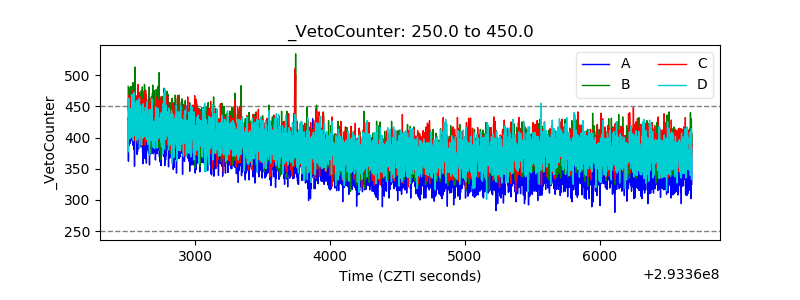 |