| Param | Original file | Final file |
|---|---|---|
| Filename | modeM0/AS1A05_063T03_9000002840cztM0_level2.fits | modeM0/AS1A05_063T03_9000002840cztM0_level2_quad_clean.evt |
| Size (bytes) | 421,560,000 | 421,191,360 |
| Size | 402.0 MB | 401.7 MB |
| Events in quadrant A | 2,559,010 | 2,509,516 |
| Events in quadrant B | 2,473,468 | 2,539,128 |
| Events in quadrant C | 2,492,642 | 2,421,194 |
| Events in quadrant D | 2,220,166 | 2,264,548 |
| Mode M9 | |||
|---|---|---|---|
| Quadrant | BADHDUFLAG | Total packets | Discarded packets |
| A | 0 | 50 | 0 |
| B | 0 | 50 | 0 |
| C | 0 | 50 | 0 |
| D | 0 | 50 | 0 |
| Mode SS | |||
|---|---|---|---|
| Quadrant | BADHDUFLAG | Total packets | Discarded packets |
| A | 0 | 894 | 0 |
| B | 0 | 894 | 0 |
| C | 0 | 894 | 0 |
| D | 0 | 894 | 0 |
| Mode M0 | |||
|---|---|---|---|
| Quadrant | BADHDUFLAG | Total packets | Discarded packets |
| A | 0 | 91196 | 0 |
| B | 0 | 91435 | 0 |
| C | 0 | 123873 | 0 |
| D | 0 | 98644 | 0 |
| Quadrant | Total seconds | Saturated seconds | Saturation percentage |
|---|---|---|---|
| A | 44024 | 623 | 1.415137% |
| B | 44024 | 705 | 1.601399% |
| C | 44024 | 1282 | 2.912048% |
| D | 44024 | 610 | 1.385608% |
Noise dominated data is calculated using 1-second bins in cleaned event files. If a bin has >2000 counts, and if more than 50% of those come from <1% of pixels, then it is considered to be noise-dominated and hence unusable.
| Quadrant | # 1 sec bins | Bins with >0 counts | Bins with >2000 counts | High rate bins dominated by noise | Noise dominated (total time) | Noise dominated (detector-on time) | Marked lightcurve |
|---|---|---|---|---|---|---|---|
| A | 48954 | 44018 | 0 | 0 | 0.00% | 0.00% |  |
| B | 48954 | 44019 | 0 | 0 | 0.00% | 0.00% | 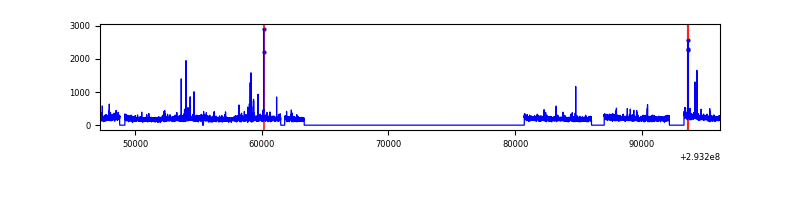 |
| C | 48954 | 44019 | 0 | 0 | 0.00% | 0.00% | 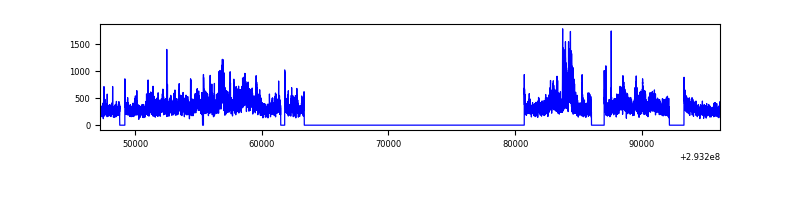 |
| D | 48954 | 44018 | 0 | 0 | 0.00% | 0.00% | 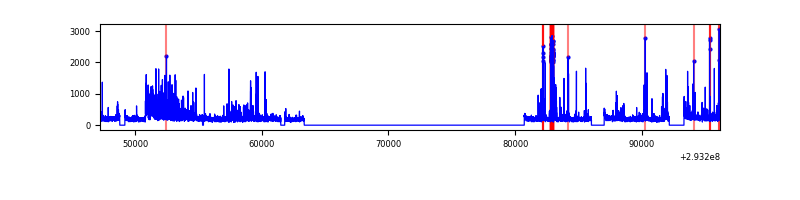 |
Top three noisy pixels from each quadrant. If the there are fewer than three noisy pixels in the level2.evt file, extra rows are filled as -1
| Pixel properties | Quadrant properties | ||||||
|---|---|---|---|---|---|---|---|
| Quadrant | DetID | PixID | Counts | Sigma | Mean | Median | Sigma |
| A | 0 | 29 | 2491 | 11.19 | 664 | 622 | 167.1 |
| A | 7 | 110 | 2101 | 8.85 | 664 | 622 | 167.1 |
| A | 0 | 30 | 1975 | 8.1 | 664 | 622 | 167.1 |
| B | 2 | 9 | 2055 | 10.8 | 653 | 621 | 132.8 |
| B | 2 | 8 | 1731 | 8.36 | 653 | 621 | 132.8 |
| B | 3 | 17 | 1670 | 7.9 | 653 | 621 | 132.8 |
| C | 1 | 80 | 1875 | 7.48 | 657 | 611 | 169.1 |
| C | 1 | 81 | 1818 | 7.14 | 657 | 611 | 169.1 |
| C | 12 | 241 | 1765 | 6.83 | 657 | 611 | 169.1 |
| D | 10 | 190 | 1667 | 6.52 | 631 | 573 | 167.9 |
| D | 3 | 14 | 1646 | 6.39 | 631 | 573 | 167.9 |
| D | 3 | 31 | 1556 | 5.86 | 631 | 573 | 167.9 |
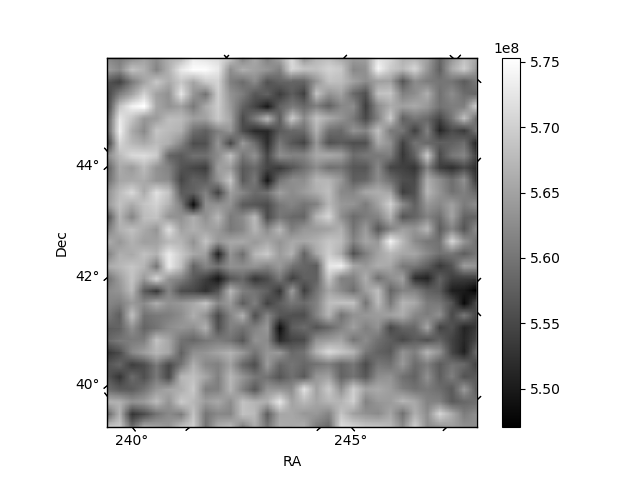
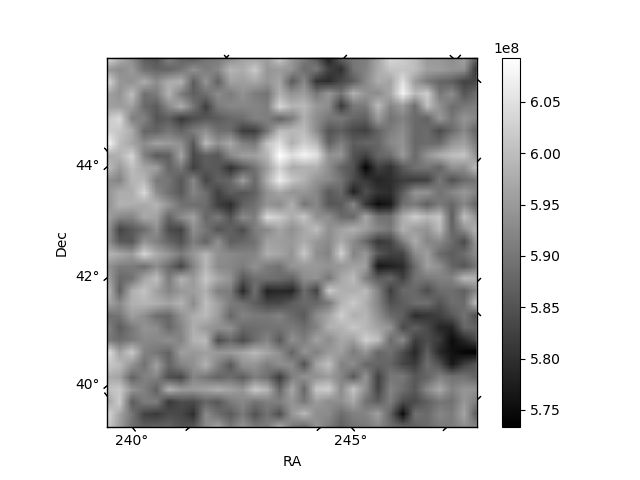
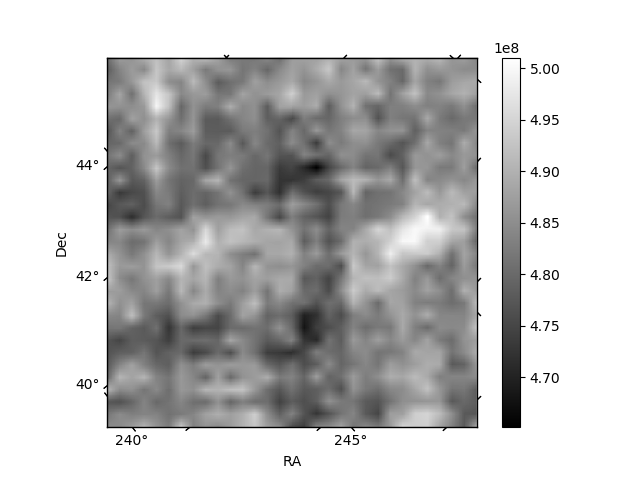
Histogram calculated using DETX and DETY for each event in the final _common_clean file
| Quadrant A | 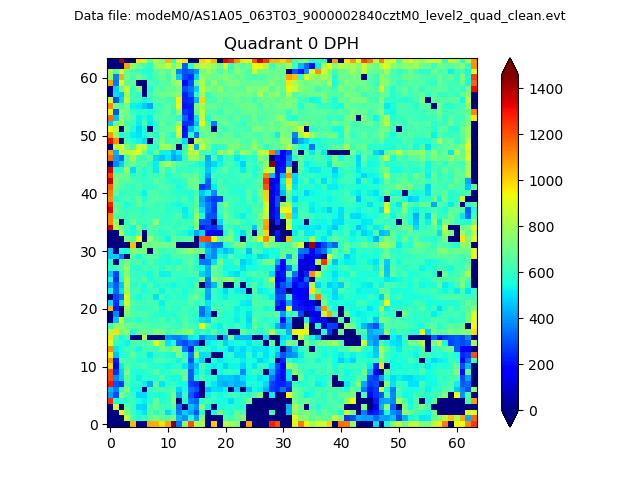 |
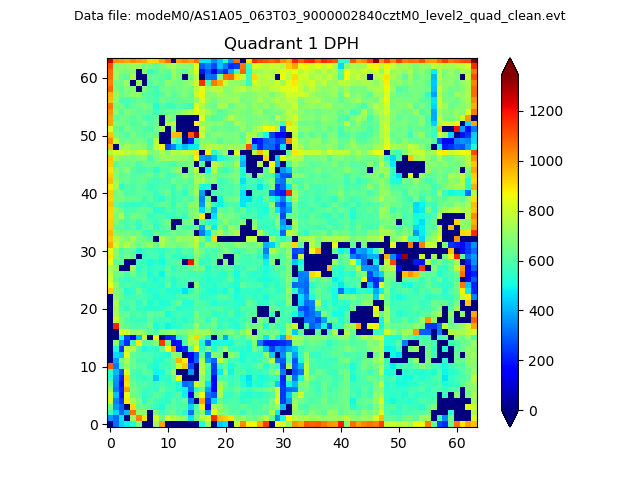 |
Quadrant B |
|---|---|---|---|
| Quadrant D | 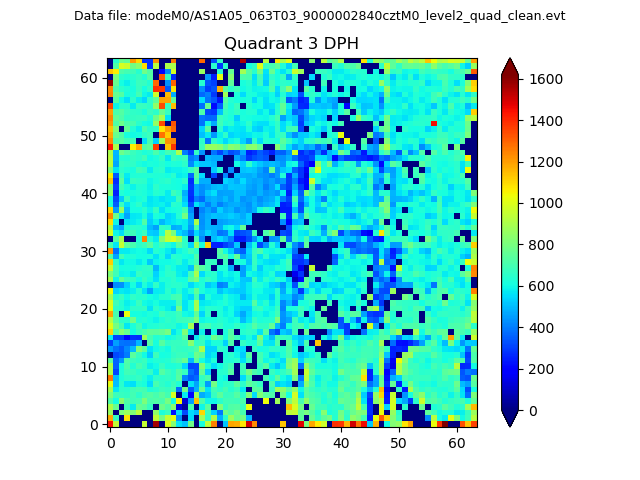 |
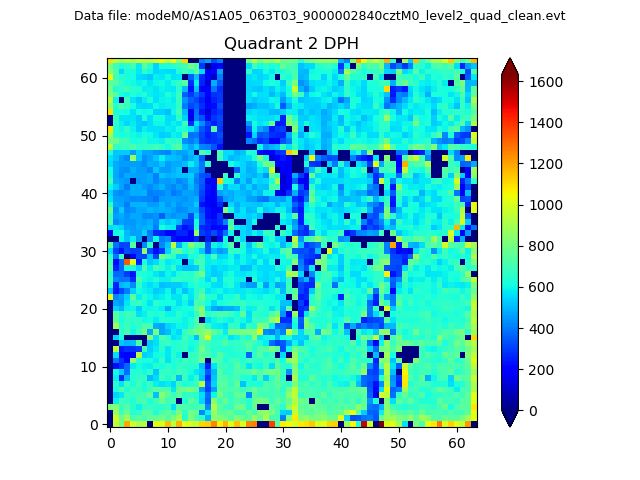 |
Quadrant C |
| Plot type | Count rate plots | Images |
|---|---|---|
| Comparison with Poisson distribution Blue bars denote a histogram of data divided into 1 sec bins. Red curve is a Poisson curve with rate = median count rate of data. |
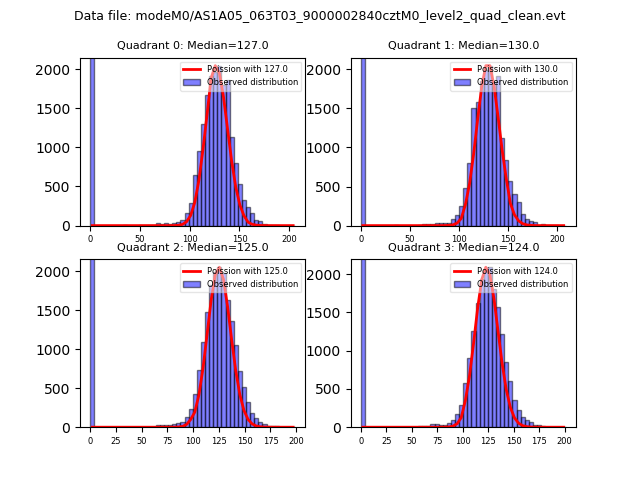 |
 |
| Quadrant-wise count rates Data is divided into 100 sec bins |
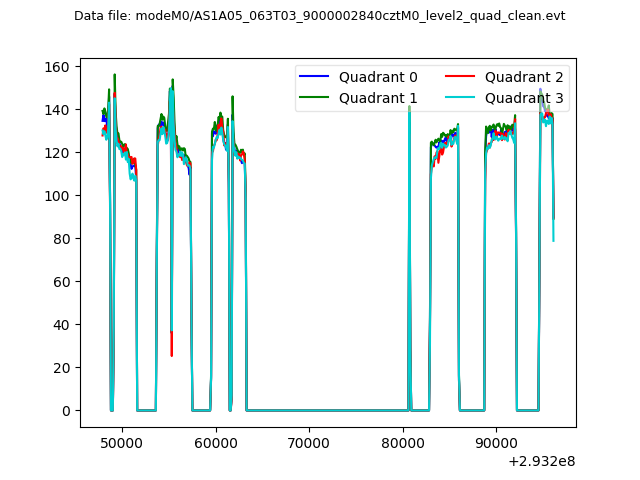 |
|
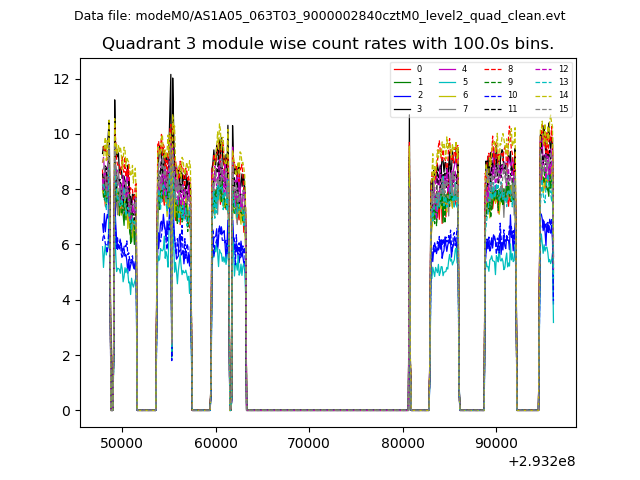
| Module-wise count rates for Quadrant A Data is divided into 100 sec bins |
 |
 |
| Module-wise count rates for Quadrant B Data is divided into 100 sec bins |
 |
 |
| Module-wise count rates for Quadrant C Data is divided into 100 sec bins |
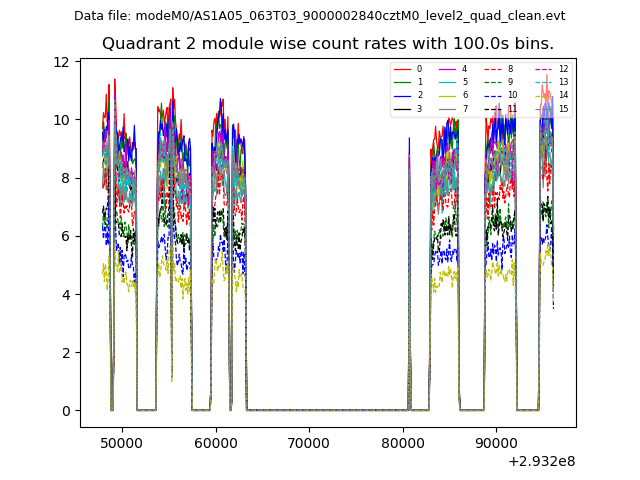 |
 |
| Module-wise count rates for Quadrant D Data is divided into 100 sec bins |
 |
 |
| Parameter | Plot |
|---|---|
| CZT HV Monitor | 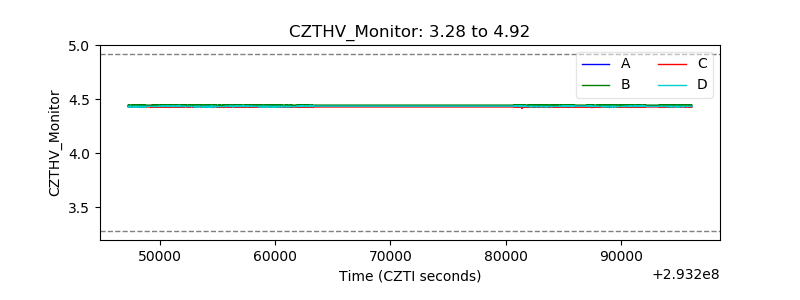 |
| D_VDD | 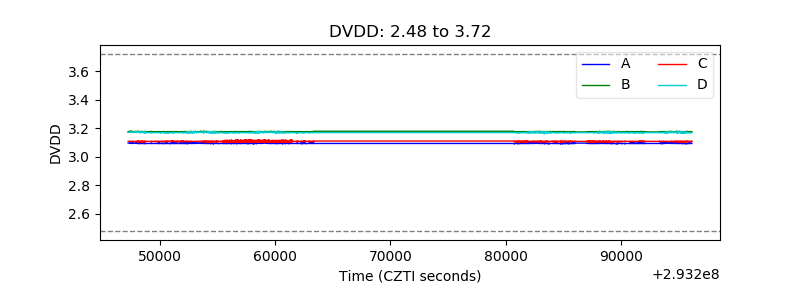 |
| Temperature 1 | 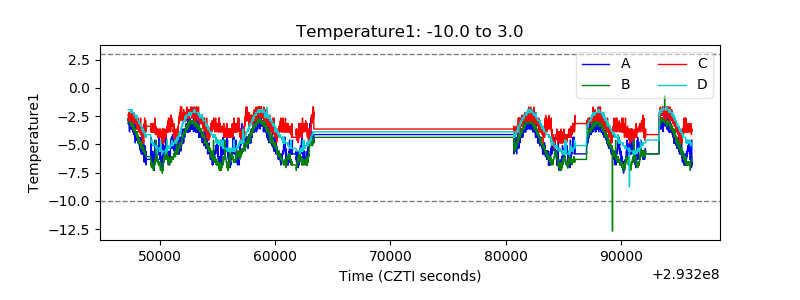 |
| Veto HV Monitor | 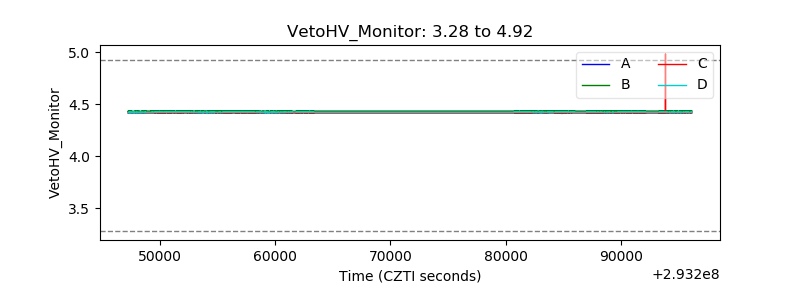 |
| Veto LLD | 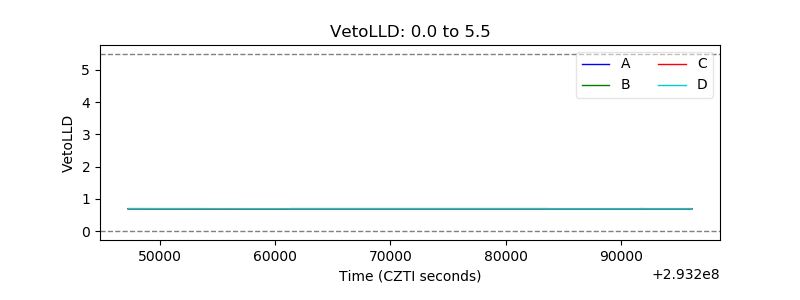 |
| Alpha Counter | 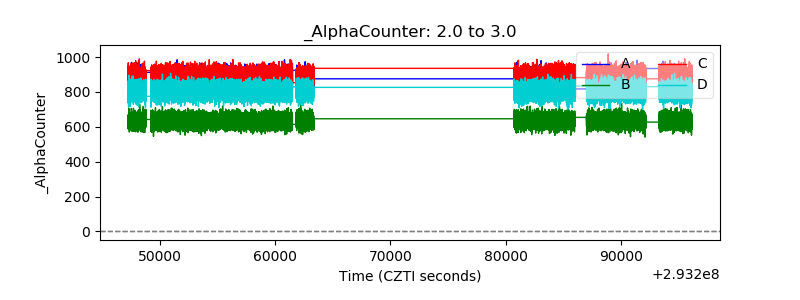 |
| _CPM_Rate | 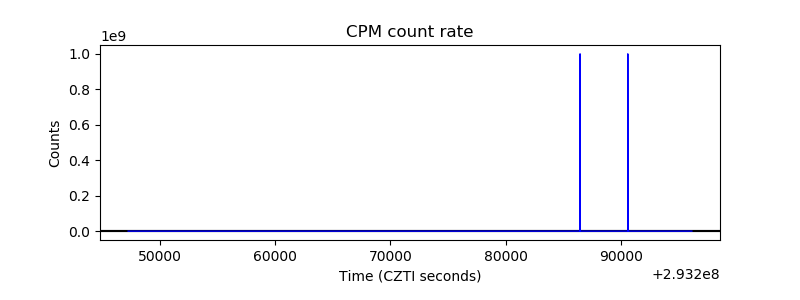 |
| CZT Counter |  |
| +2.5 Volts monitor |  |
| +5 Volts monitor |  |
| _ROLL_ROT | 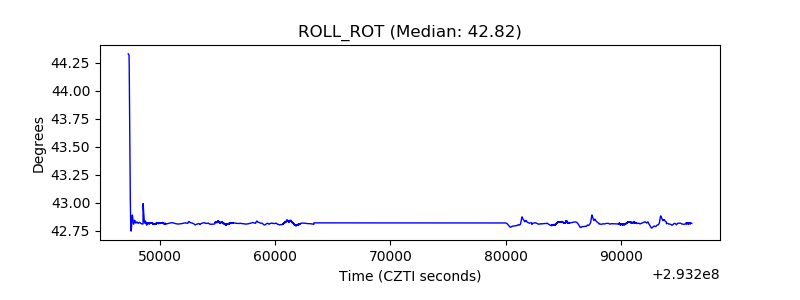 |
| _Roll_DEC |  |
| _Roll_RA | 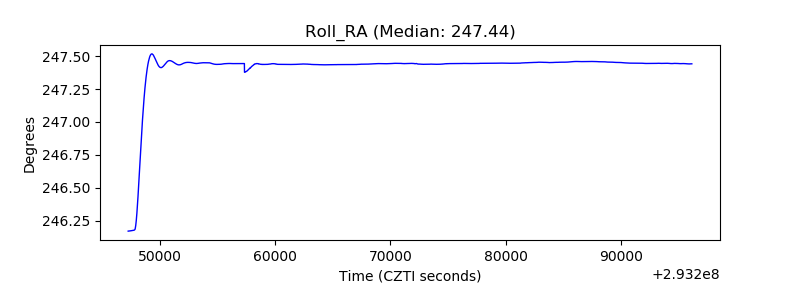 |
| Veto Counter |  |