| Param | Original file | Final file |
|---|---|---|
| Filename | modeM0/AS1A05_063T03_9000002840_19212cztM0_level2.evt | modeM0/AS1A05_063T03_9000002840_19212cztM0_level2_quad_clean.evt |
| Size (bytes) | 584,294,400 | 110,551,680 |
| Size | 557.2 MB | 105.4 MB |
| Events in quadrant A | 3,608,545 | 700,023 |
| Events in quadrant B | 3,697,364 | 720,898 |
| Events in quadrant C | 5,194,723 | 696,605 |
| Events in quadrant D | 4,667,862 | 689,938 |
| Mode M9 | |||
|---|---|---|---|
| Quadrant | BADHDUFLAG | Total packets | Discarded packets |
| A | 0 | 3 | 0 |
| B | 0 | 3 | 0 |
| C | 0 | 3 | 0 |
| D | 0 | 4 | 0 |
| Mode SS | |||
|---|---|---|---|
| Quadrant | BADHDUFLAG | Total packets | Discarded packets |
| A | 0 | 158 | 0 |
| B | 0 | 158 | 0 |
| C | 0 | 158 | 0 |
| D | 0 | 158 | 0 |
| Mode M0 | |||
|---|---|---|---|
| Quadrant | BADHDUFLAG | Total packets | Discarded packets |
| A | 0 | 16078 | 3 |
| B | 0 | 16198 | 2 |
| C | 0 | 20997 | 2 |
| D | 0 | 19389 | 2 |
| Quadrant | Total seconds | Saturated seconds | Saturation percentage |
|---|---|---|---|
| A | 7769 | 159 | 2.046595% |
| B | 7769 | 202 | 2.600077% |
| C | 7769 | 285 | 3.668426% |
| D | 7769 | 117 | 1.505985% |
Noise dominated data is calculated using 1-second bins in cleaned event files. If a bin has >2000 counts, and if more than 50% of those come from <1% of pixels, then it is considered to be noise-dominated and hence unusable.
| Quadrant | # 1 sec bins | Bins with >0 counts | Bins with >2000 counts | High rate bins dominated by noise | Noise dominated (total time) | Noise dominated (detector-on time) | Marked lightcurve |
|---|---|---|---|---|---|---|---|
| A | 7844 | 7770 | 0 | 0 | 0.00% | 0.00% | 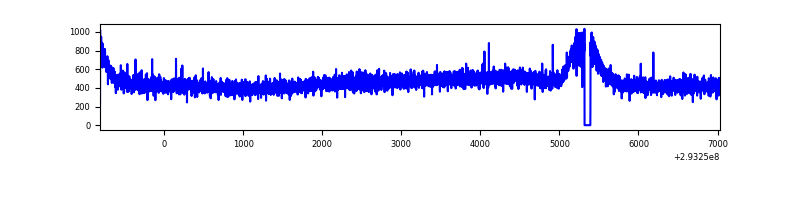 |
| B | 7844 | 7770 | 1 | 1 | 0.01% | 0.01% |  |
| C | 7844 | 7770 | 2 | 2 | 0.03% | 0.03% | 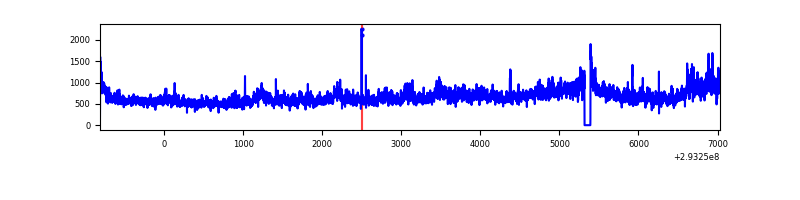 |
| D | 7844 | 7770 | 35 | 35 | 0.45% | 0.45% | 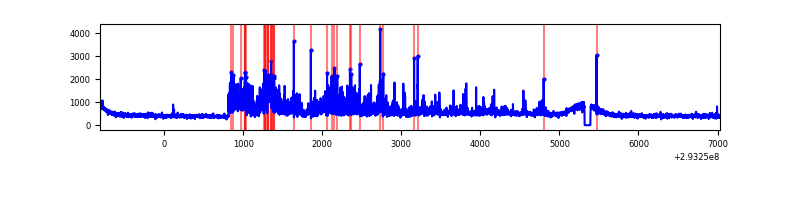 |
Top three noisy pixels from each quadrant. If the there are fewer than three noisy pixels in the level2.evt file, extra rows are filled as -1
| Pixel properties | Quadrant properties | ||||||
|---|---|---|---|---|---|---|---|
| Quadrant | DetID | PixID | Counts | Sigma | Mean | Median | Sigma |
| A | 13 | 254 | 9558 | 45.39 | 934 | 910 | 190.5 |
| A | 0 | 226 | 8042 | 37.43 | 934 | 910 | 190.5 |
| A | 3 | 137 | 7808 | 36.2 | 934 | 910 | 190.5 |
| B | 12 | 111 | 22499 | 118.87 | 936 | 912 | 181.6 |
| B | 11 | 111 | 19590 | 102.85 | 936 | 912 | 181.6 |
| B | 10 | 247 | 18315 | 95.83 | 936 | 912 | 181.6 |
| C | 3 | 233 | 1551626 | 7404.83 | 898 | 903 | 209.4 |
| C | 14 | 238 | 136095 | 645.55 | 898 | 903 | 209.4 |
| C | 13 | 61 | 6416 | 26.33 | 898 | 903 | 209.4 |
| D | 1 | 52 | 1110302 | 4990.39 | 910 | 881 | 222.3 |
| D | 11 | 176 | 51801 | 229.05 | 910 | 881 | 222.3 |
| D | 10 | 66 | 45504 | 200.72 | 910 | 881 | 222.3 |
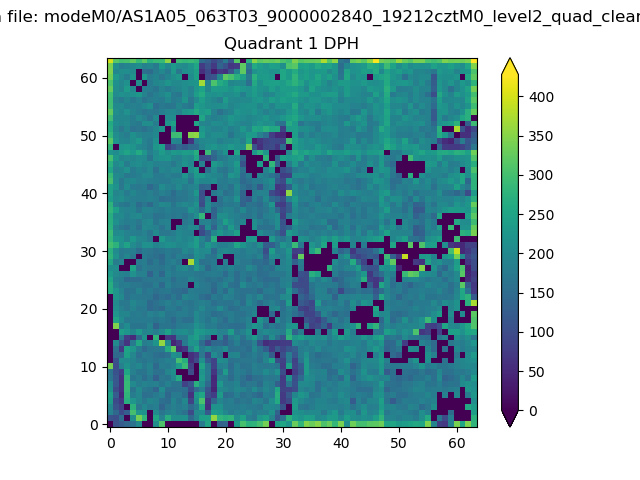
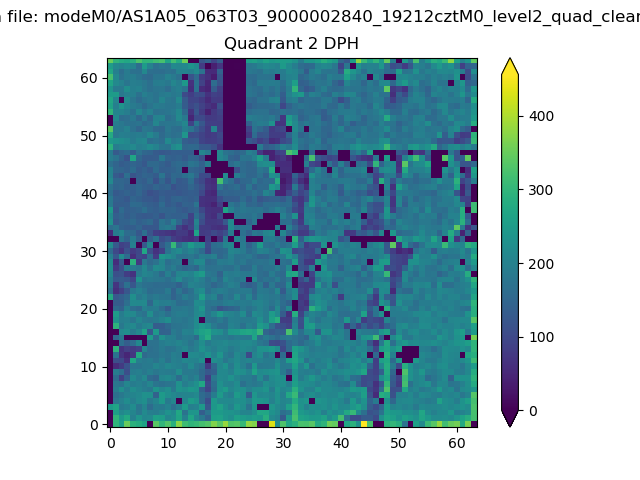
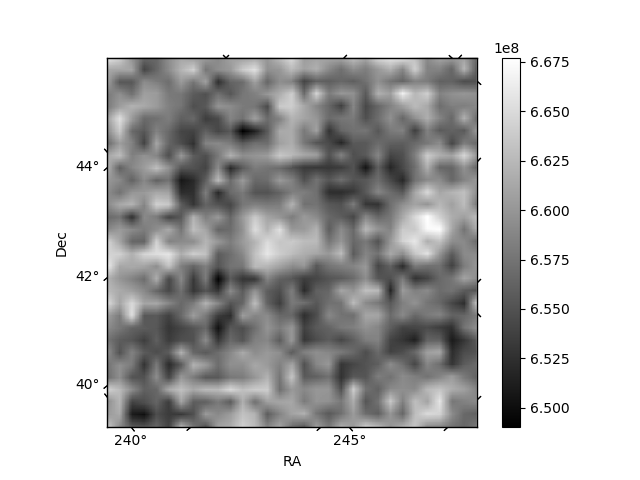
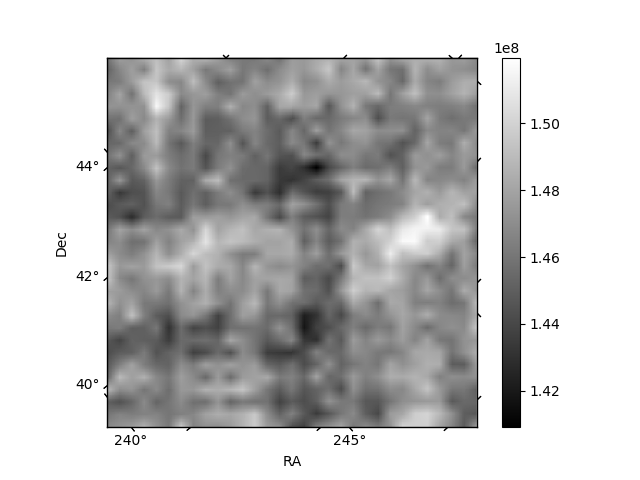
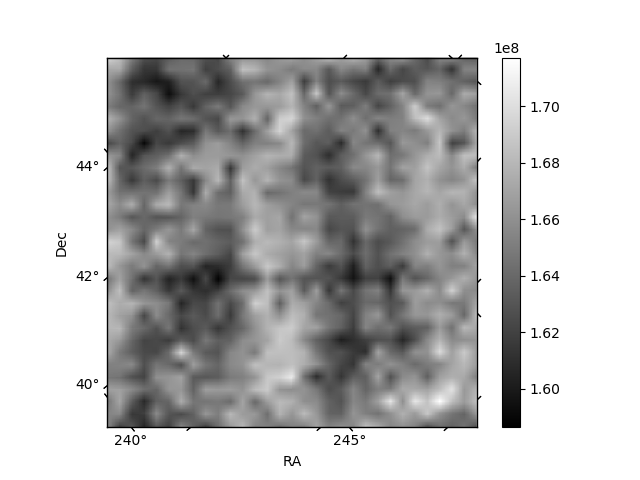
Histogram calculated using DETX and DETY for each event in the final _common_clean file
| Quadrant A | 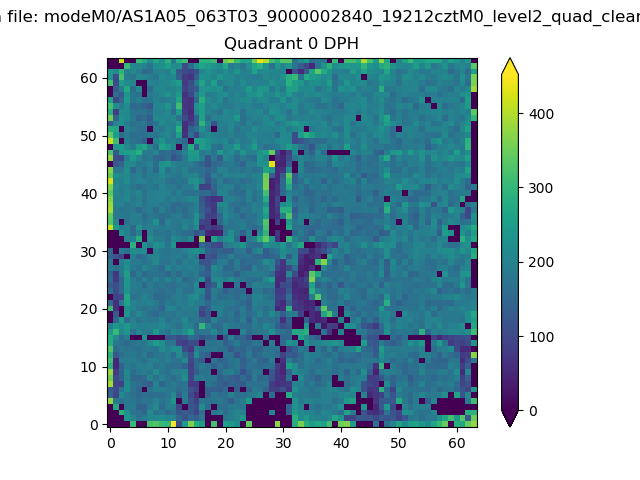 |
 |
Quadrant B |
|---|---|---|---|
| Quadrant D | 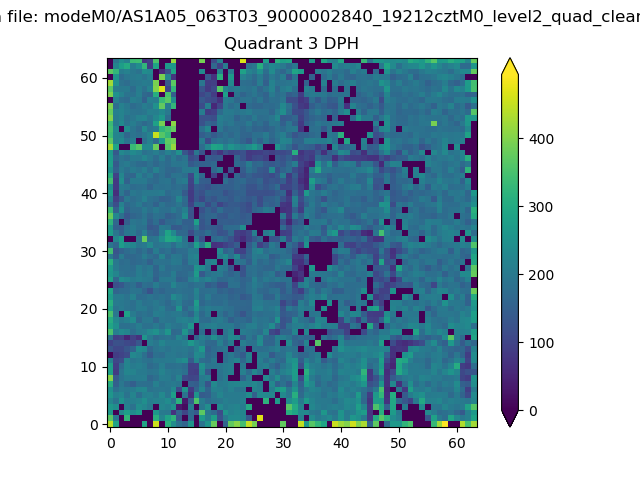 |
 |
Quadrant C |
| Plot type | Count rate plots | Images |
|---|---|---|
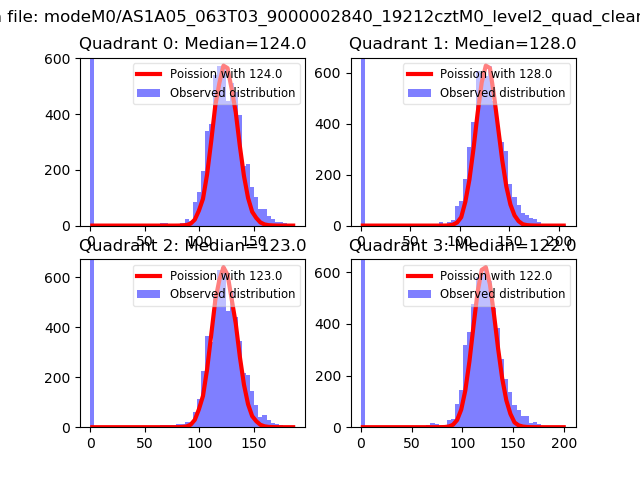
| Comparison with Poisson distribution Blue bars denote a histogram of data divided into 1 sec bins. Red curve is a Poisson curve with rate = median count rate of data. |
 |
 |
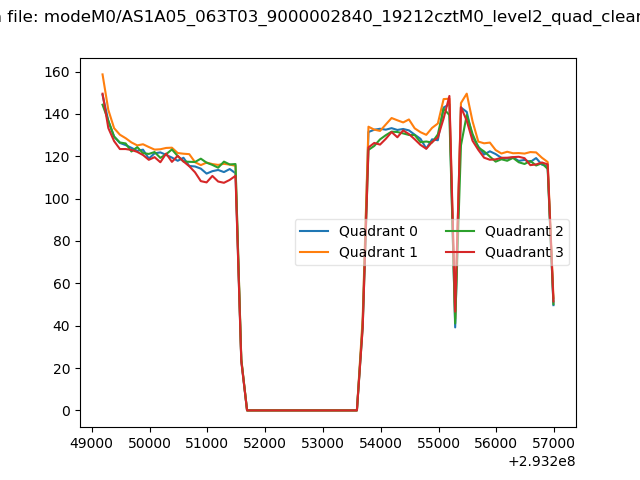
| Quadrant-wise count rates Data is divided into 100 sec bins |
 |
|
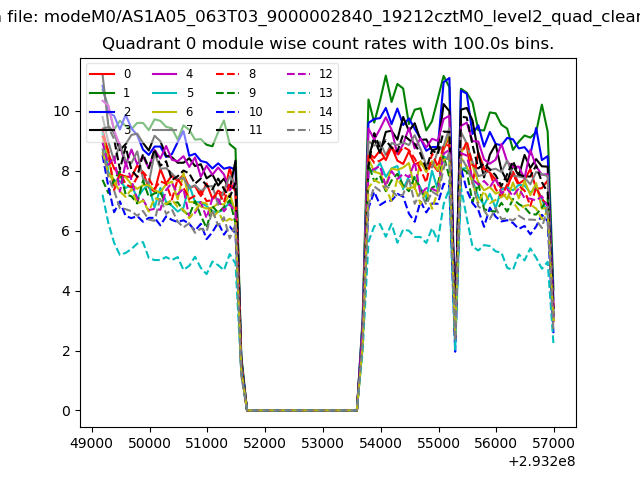
| Module-wise count rates for Quadrant A Data is divided into 100 sec bins |
 |
 |
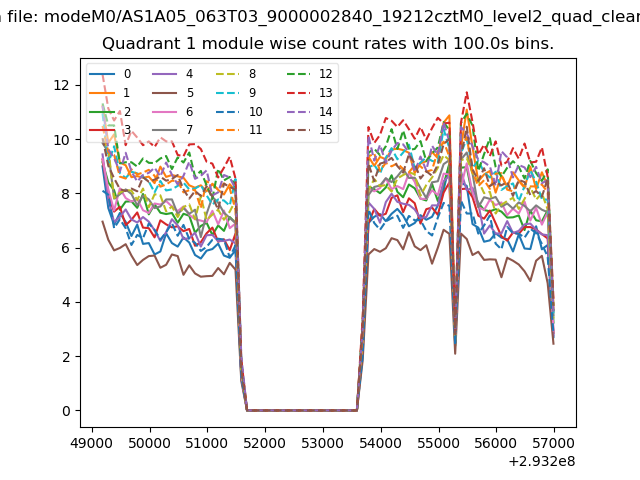
| Module-wise count rates for Quadrant B Data is divided into 100 sec bins |
 |
 |
| Module-wise count rates for Quadrant C Data is divided into 100 sec bins |
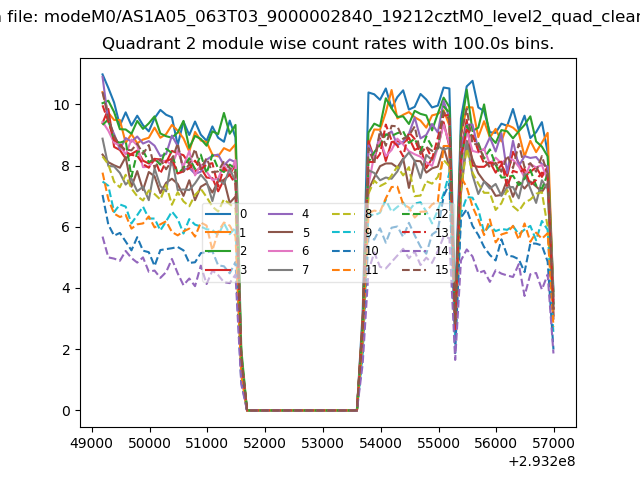 |
 |
| Module-wise count rates for Quadrant D Data is divided into 100 sec bins |
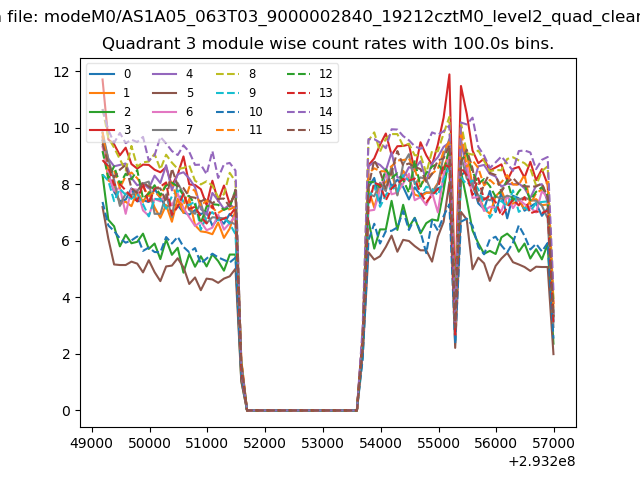 |
 |
| Parameter | Plot |
|---|---|
| CZT HV Monitor | 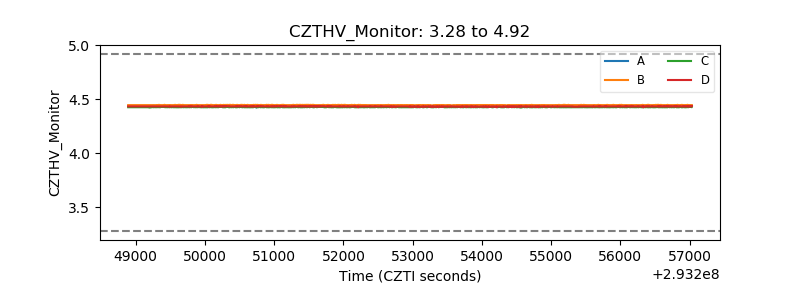 |
| D_VDD | 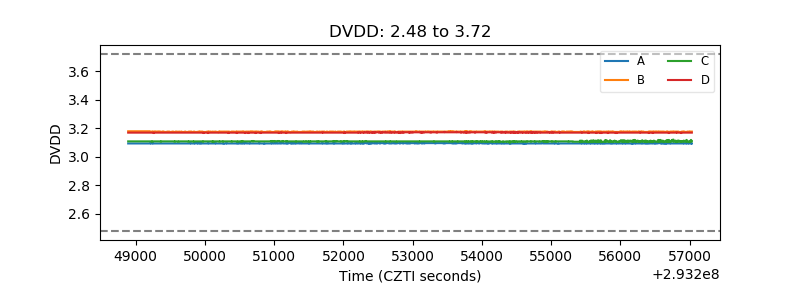 |
| Temperature 1 | 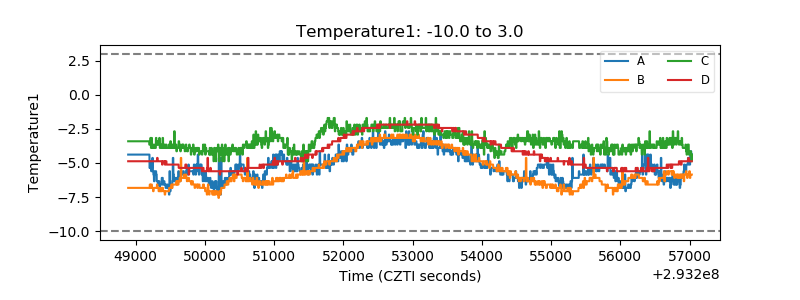 |
| Veto HV Monitor | 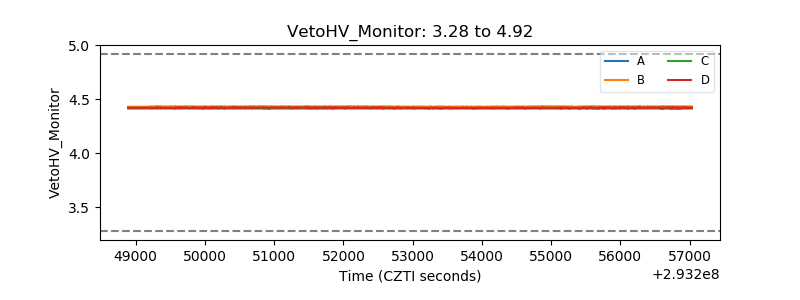 |
| Veto LLD | 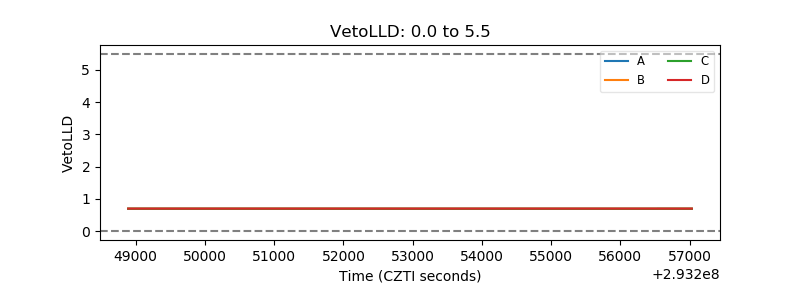 |
| Alpha Counter | 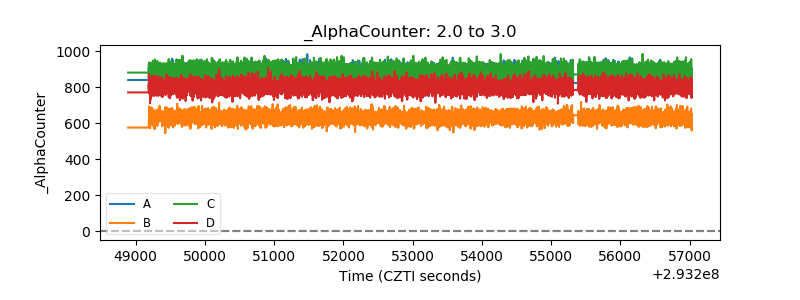 |
| _CPM_Rate | 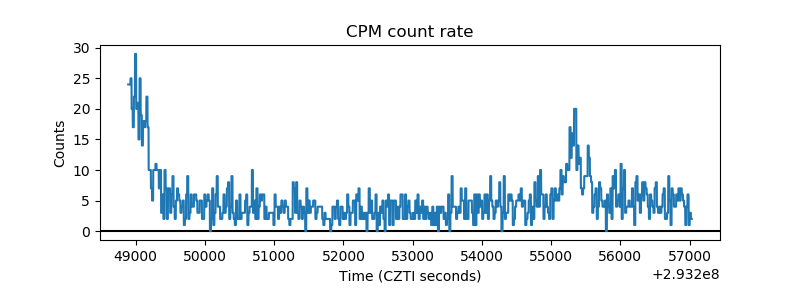 |
| CZT Counter | 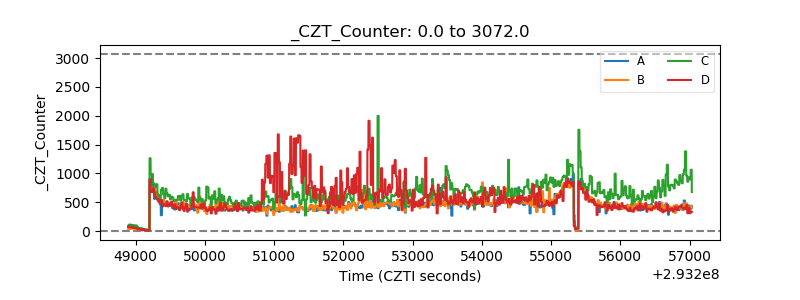 |
| +2.5 Volts monitor |  |
| +5 Volts monitor |  |
| _ROLL_ROT | 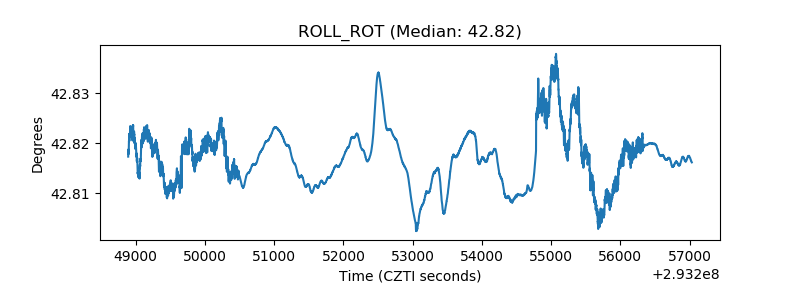 |
| _Roll_DEC | 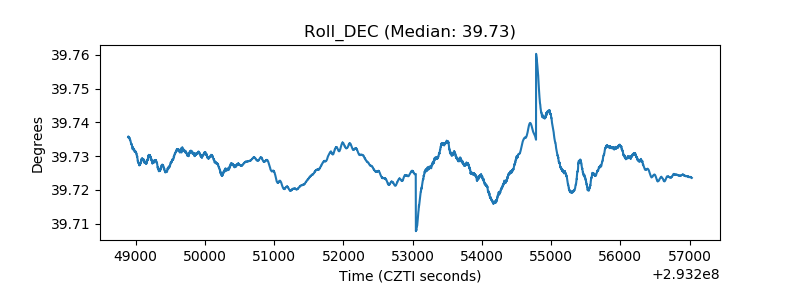 |
| _Roll_RA | 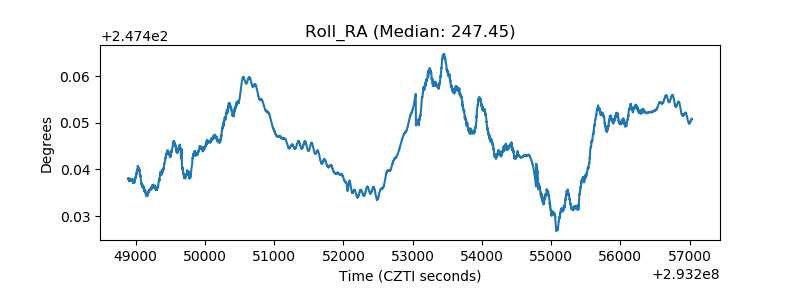 |
| Veto Counter | 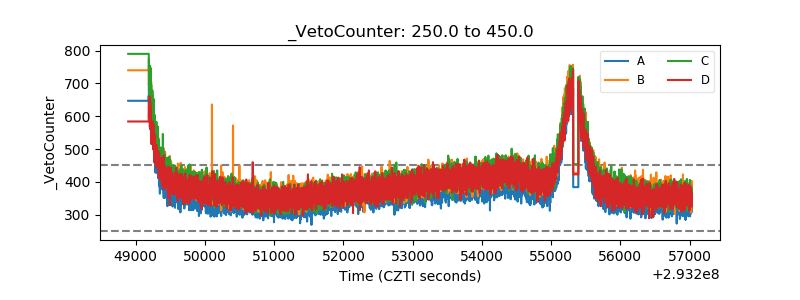 |