| Param | Original file | Final file |
|---|---|---|
| Filename | modeM0/AS1A05_063T03_9000002840_19213cztM0_level2.evt | modeM0/AS1A05_063T03_9000002840_19213cztM0_level2_quad_clean.evt |
| Size (bytes) | 544,112,640 | 106,404,480 |
| Size | 518.9 MB | 101.5 MB |
| Events in quadrant A | 3,479,033 | 672,269 |
| Events in quadrant B | 3,604,134 | 689,982 |
| Events in quadrant C | 5,391,837 | 665,500 |
| Events in quadrant D | 3,485,248 | 663,386 |
| Mode M9 | |||
|---|---|---|---|
| Quadrant | BADHDUFLAG | Total packets | Discarded packets |
| A | 0 | 3 | 0 |
| B | 0 | 3 | 0 |
| C | 0 | 3 | 0 |
| D | 0 | 3 | 0 |
| Mode SS | |||
|---|---|---|---|
| Quadrant | BADHDUFLAG | Total packets | Discarded packets |
| A | 0 | 154 | 0 |
| B | 0 | 154 | 0 |
| C | 0 | 154 | 0 |
| D | 0 | 154 | 0 |
| Mode M0 | |||
|---|---|---|---|
| Quadrant | BADHDUFLAG | Total packets | Discarded packets |
| A | 0 | 15620 | 3 |
| B | 0 | 15793 | 2 |
| C | 0 | 21668 | 2 |
| D | 0 | 15873 | 2 |
| Quadrant | Total seconds | Saturated seconds | Saturation percentage |
|---|---|---|---|
| A | 7638 | 114 | 1.492537% |
| B | 7638 | 157 | 2.055512% |
| C | 7638 | 227 | 2.971982% |
| D | 7638 | 69 | 0.903378% |
Noise dominated data is calculated using 1-second bins in cleaned event files. If a bin has >2000 counts, and if more than 50% of those come from <1% of pixels, then it is considered to be noise-dominated and hence unusable.
| Quadrant | # 1 sec bins | Bins with >0 counts | Bins with >2000 counts | High rate bins dominated by noise | Noise dominated (total time) | Noise dominated (detector-on time) | Marked lightcurve |
|---|---|---|---|---|---|---|---|
| A | 7953 | 7638 | 0 | 0 | 0.00% | 0.00% | 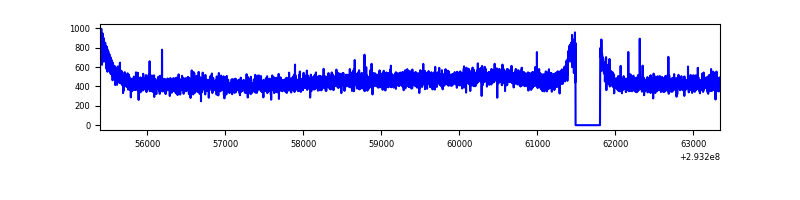 |
| B | 7953 | 7639 | 3 | 3 | 0.04% | 0.04% | 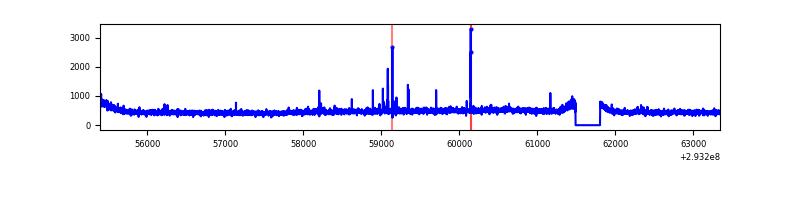 |
| C | 7953 | 7639 | 0 | 0 | 0.00% | 0.00% | 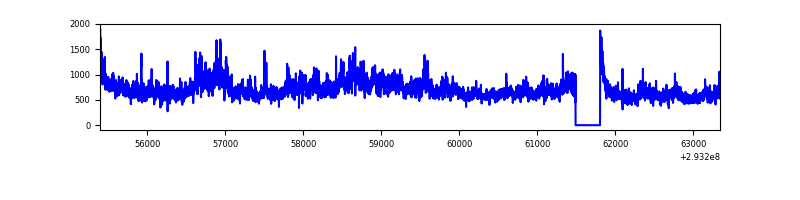 |
| D | 7953 | 7639 | 6 | 6 | 0.08% | 0.08% | 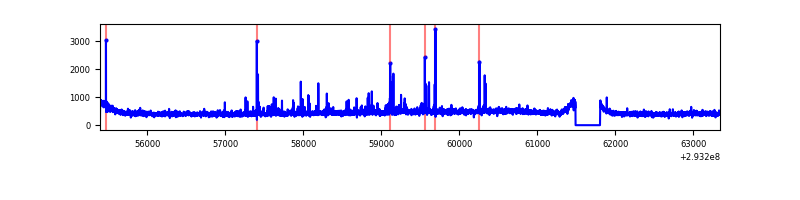 |
Top three noisy pixels from each quadrant. If the there are fewer than three noisy pixels in the level2.evt file, extra rows are filled as -1
| Pixel properties | Quadrant properties | ||||||
|---|---|---|---|---|---|---|---|
| Quadrant | DetID | PixID | Counts | Sigma | Mean | Median | Sigma |
| A | 13 | 254 | 11248 | 56.21 | 902 | 880 | 184.4 |
| A | 3 | 137 | 7719 | 37.08 | 902 | 880 | 184.4 |
| A | 0 | 226 | 7678 | 36.86 | 902 | 880 | 184.4 |
| B | 12 | 111 | 21640 | 119.45 | 904 | 879 | 173.8 |
| B | 0 | 190 | 20816 | 114.71 | 904 | 879 | 173.8 |
| B | 11 | 111 | 19029 | 104.43 | 904 | 879 | 173.8 |
| C | 3 | 233 | 1860905 | 9225.43 | 865 | 871 | 201.6 |
| C | 14 | 238 | 132994 | 655.31 | 865 | 871 | 201.6 |
| C | 8 | 128 | 14656 | 68.37 | 865 | 871 | 201.6 |
| D | 1 | 52 | 96089 | 445.03 | 879 | 850 | 214.0 |
| D | 2 | 234 | 30607 | 139.05 | 879 | 850 | 214.0 |
| D | 11 | 176 | 28372 | 128.6 | 879 | 850 | 214.0 |
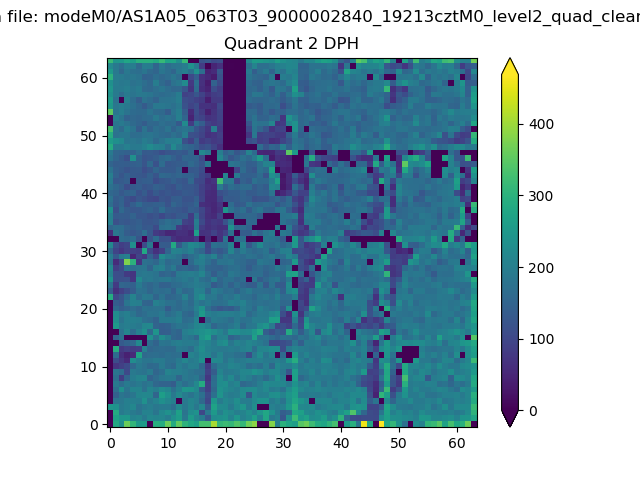
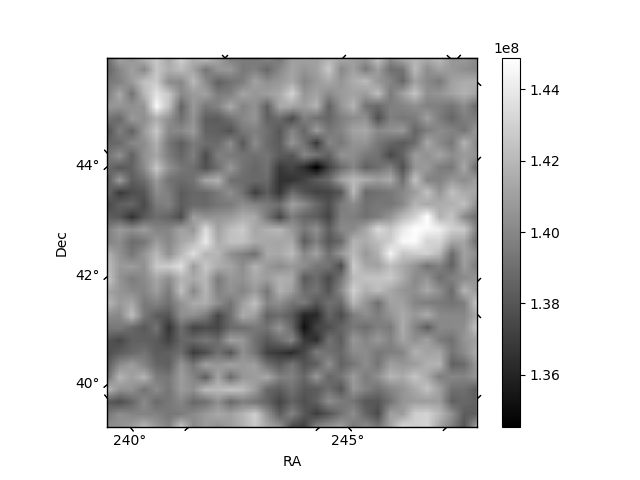
Histogram calculated using DETX and DETY for each event in the final _common_clean file
| Quadrant A | 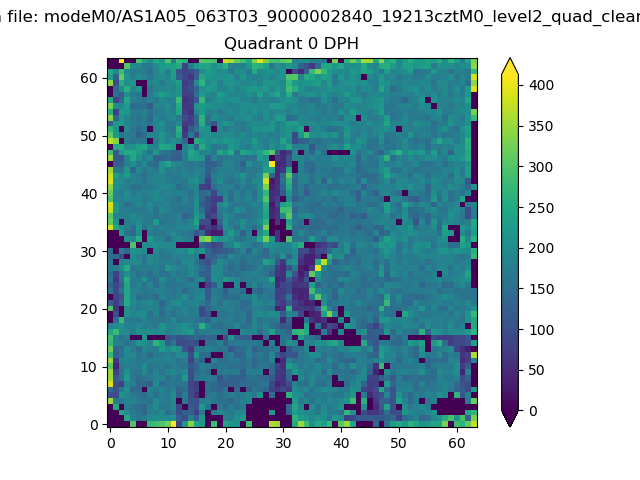 |
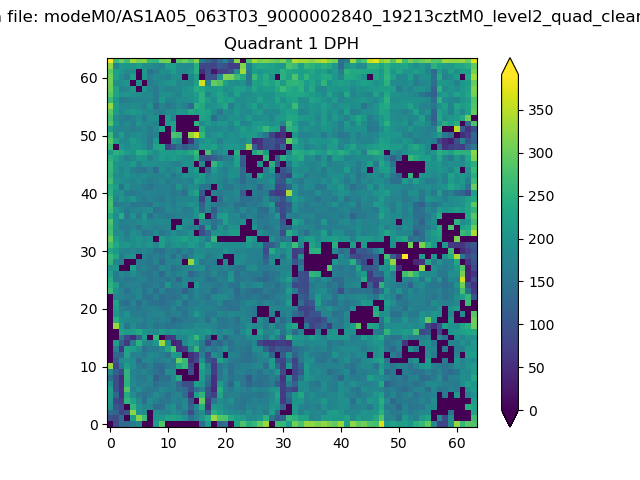 |
Quadrant B |
|---|---|---|---|
| Quadrant D | 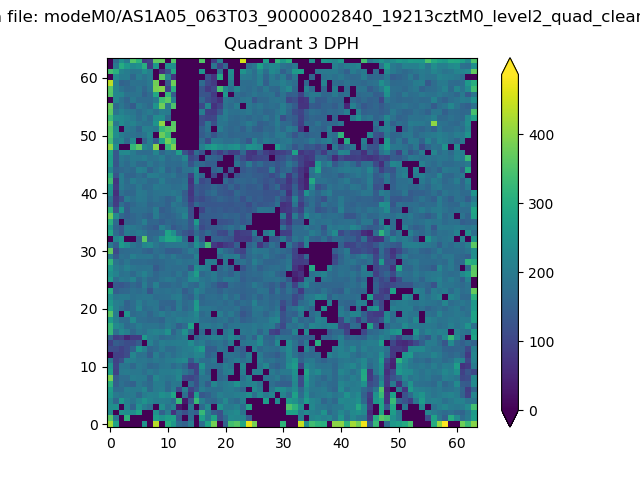 |
 |
Quadrant C |
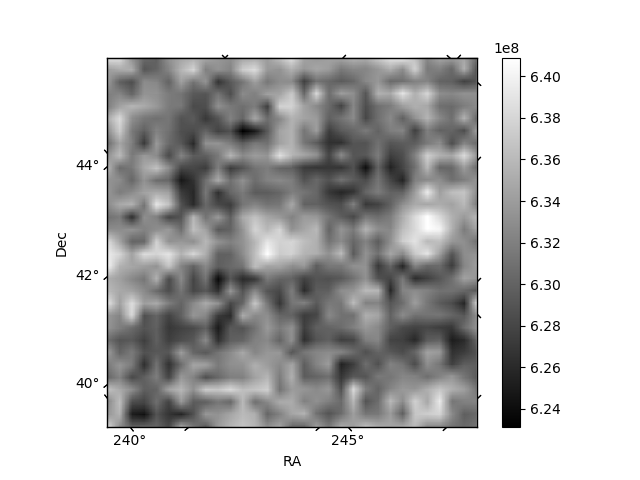
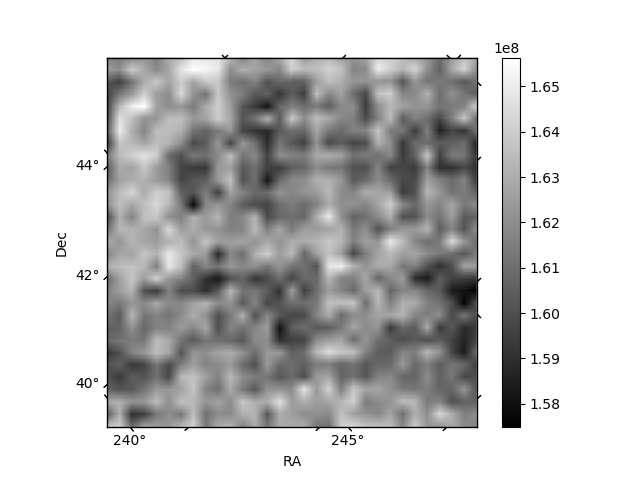
| Plot type | Count rate plots | Images |
|---|---|---|
| Comparison with Poisson distribution Blue bars denote a histogram of data divided into 1 sec bins. Red curve is a Poisson curve with rate = median count rate of data. |
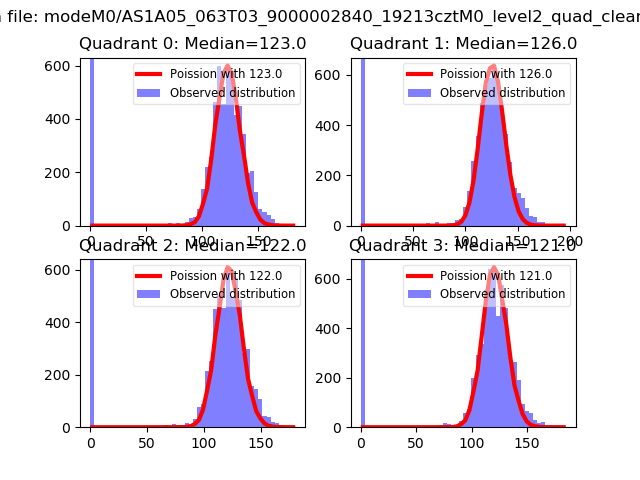 |
 |
| Quadrant-wise count rates Data is divided into 100 sec bins |
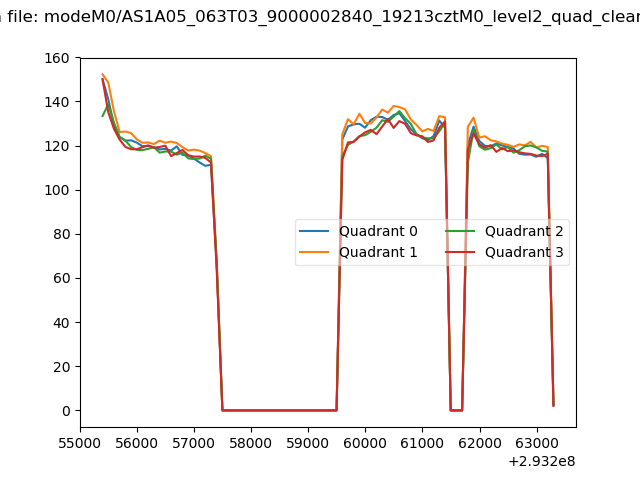 |
|
| Module-wise count rates for Quadrant A Data is divided into 100 sec bins |
 |
 |
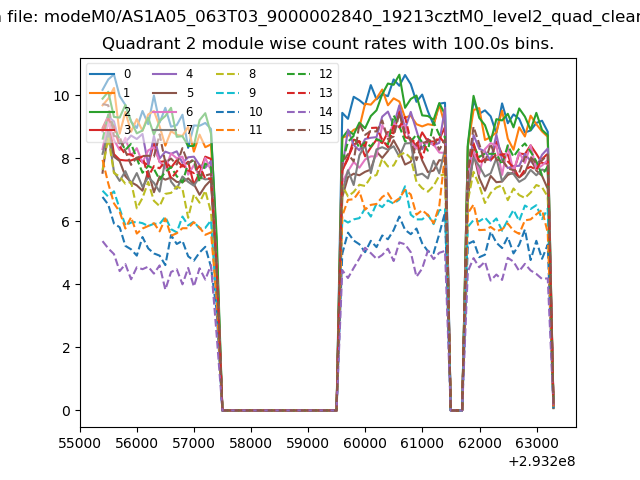
| Module-wise count rates for Quadrant B Data is divided into 100 sec bins |
 |
 |
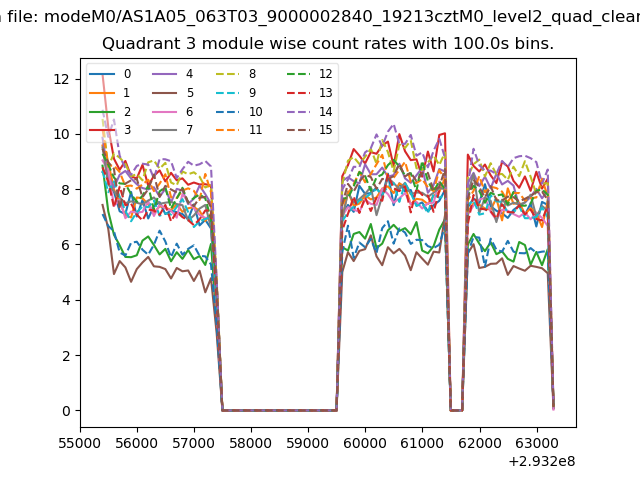
| Module-wise count rates for Quadrant C Data is divided into 100 sec bins |
 |
 |
| Module-wise count rates for Quadrant D Data is divided into 100 sec bins |
 |
 |
| Parameter | Plot |
|---|---|
| CZT HV Monitor | 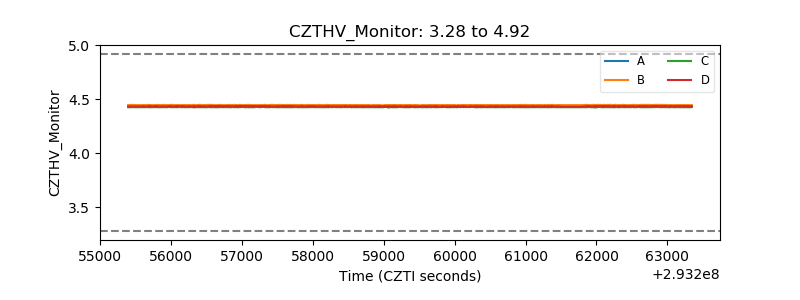 |
| D_VDD | 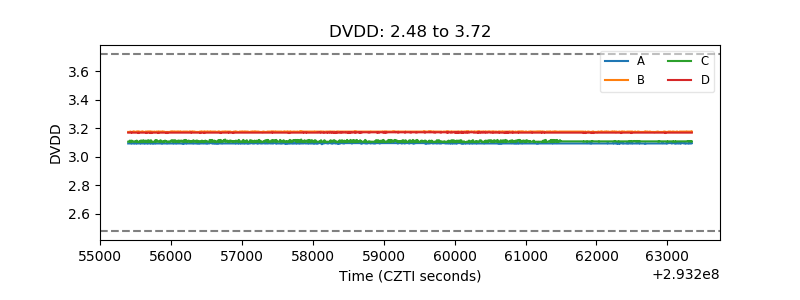 |
| Temperature 1 | 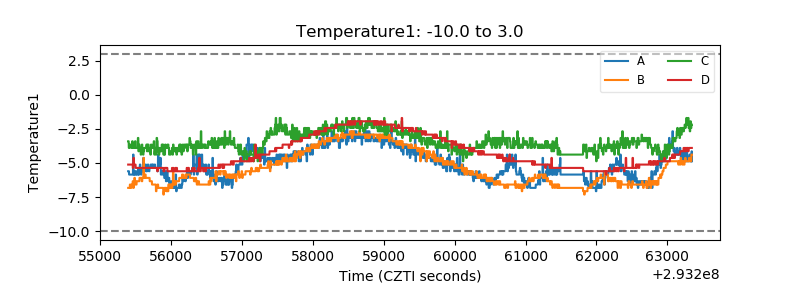 |
| Veto HV Monitor | 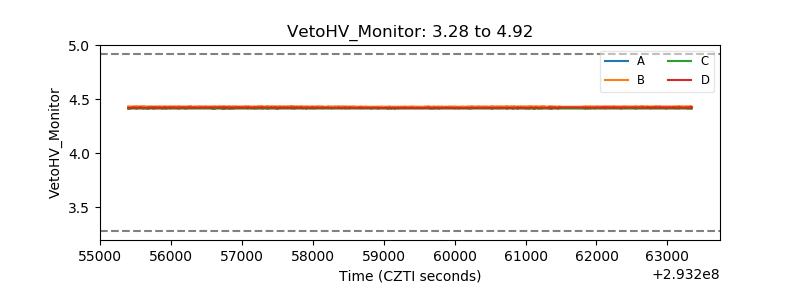 |
| Veto LLD | 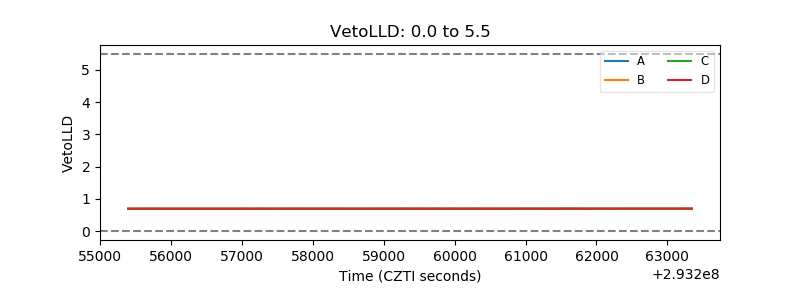 |
| Alpha Counter | 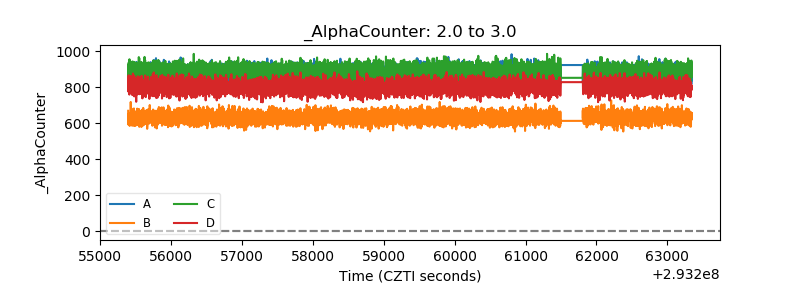 |
| _CPM_Rate | 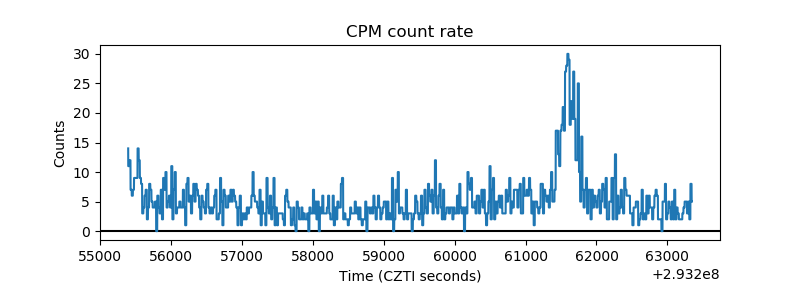 |
| CZT Counter | 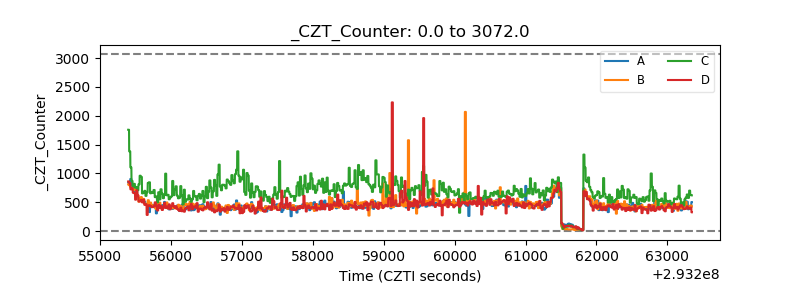 |
| +2.5 Volts monitor | 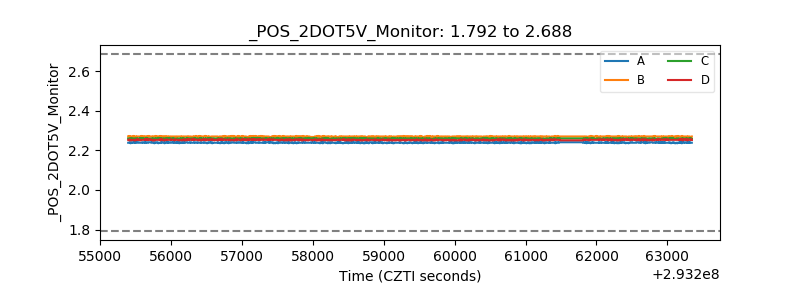 |
| +5 Volts monitor |  |
| _ROLL_ROT | 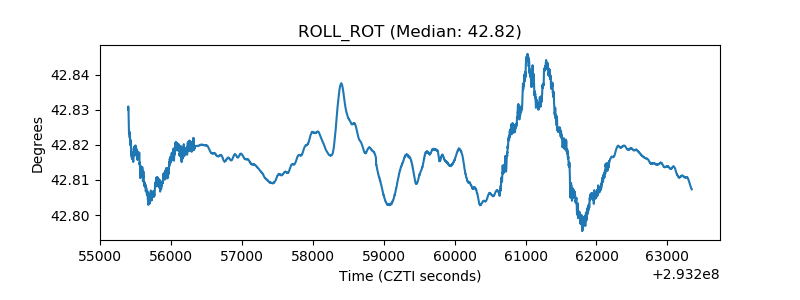 |
| _Roll_DEC | 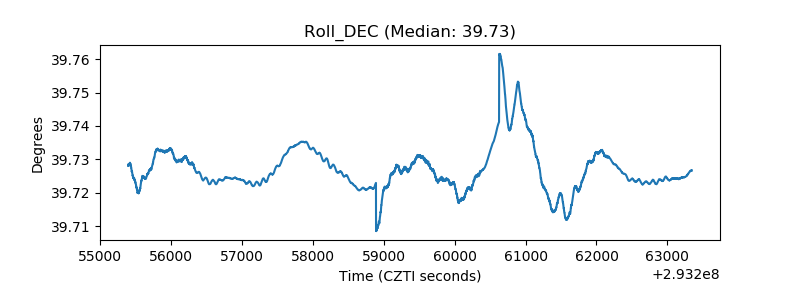 |
| _Roll_RA | 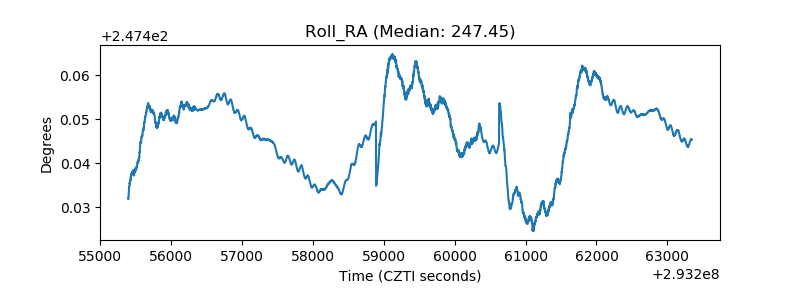 |
| Veto Counter | 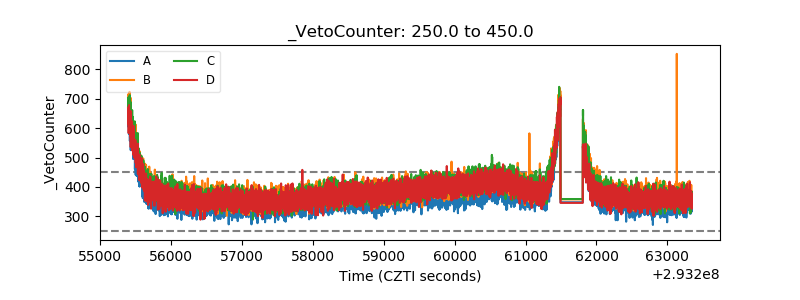 |