| Param | Original file | Final file |
|---|---|---|
| Filename | modeM0/AS1A05_063T03_9000002840_19216cztM0_level2.evt | modeM0/AS1A05_063T03_9000002840_19216cztM0_level2_quad_clean.evt |
| Size (bytes) | 1,334,361,600 | 212,662,080 |
| Size | 1.2 GB | 202.8 MB |
| Events in quadrant A | 8,432,335 | 1,298,770 |
| Events in quadrant B | 8,672,495 | 1,331,110 |
| Events in quadrant C | 12,903,386 | 1,279,427 |
| Events in quadrant D | 9,164,851 | 1,268,098 |
| Mode M9 | |||
|---|---|---|---|
| Quadrant | BADHDUFLAG | Total packets | Discarded packets |
| A | 0 | 20 | 0 |
| B | 0 | 20 | 0 |
| C | 0 | 20 | 0 |
| D | 0 | 20 | 0 |
| Mode SS | |||
|---|---|---|---|
| Quadrant | BADHDUFLAG | Total packets | Discarded packets |
| A | 0 | 372 | 0 |
| B | 0 | 372 | 0 |
| C | 0 | 372 | 0 |
| D | 0 | 372 | 0 |
| Mode M0 | |||
|---|---|---|---|
| Quadrant | BADHDUFLAG | Total packets | Discarded packets |
| A | 0 | 37242 | 4 |
| B | 0 | 37339 | 3 |
| C | 0 | 52331 | 3 |
| D | 0 | 40047 | 3 |
| Quadrant | Total seconds | Saturated seconds | Saturation percentage |
|---|---|---|---|
| A | 18332 | 218 | 1.189177% |
| B | 18332 | 236 | 1.287366% |
| C | 18332 | 465 | 2.536548% |
| D | 18332 | 222 | 1.210997% |
Noise dominated data is calculated using 1-second bins in cleaned event files. If a bin has >2000 counts, and if more than 50% of those come from <1% of pixels, then it is considered to be noise-dominated and hence unusable.
| Quadrant | # 1 sec bins | Bins with >0 counts | Bins with >2000 counts | High rate bins dominated by noise | Noise dominated (total time) | Noise dominated (detector-on time) | Marked lightcurve |
|---|---|---|---|---|---|---|---|
| A | 20302 | 18332 | 3 | 3 | 0.01% | 0.02% | 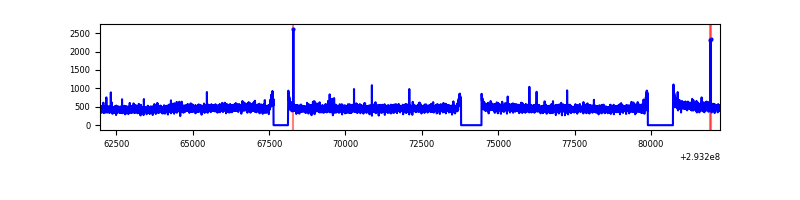 |
| B | 20302 | 18332 | 0 | 0 | 0.00% | 0.00% | 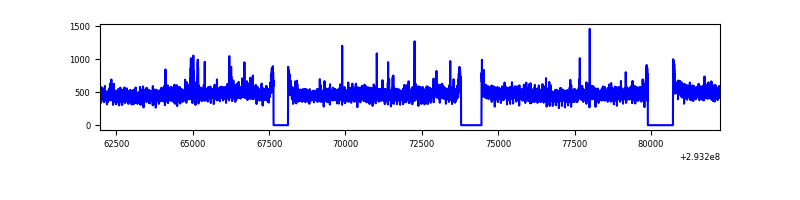 |
| C | 20302 | 18332 | 30 | 30 | 0.15% | 0.16% | 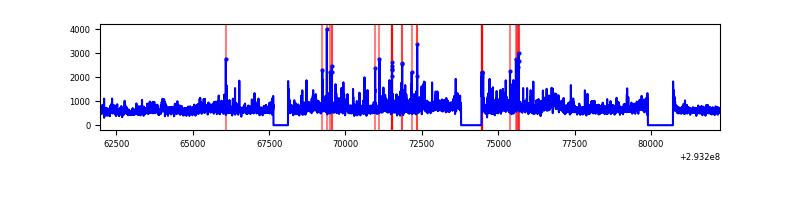 |
| D | 20302 | 18332 | 42 | 42 | 0.21% | 0.23% | 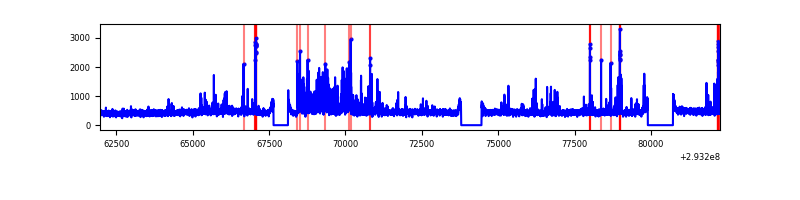 |
Top three noisy pixels from each quadrant. If the there are fewer than three noisy pixels in the level2.evt file, extra rows are filled as -1
| Pixel properties | Quadrant properties | ||||||
|---|---|---|---|---|---|---|---|
| Quadrant | DetID | PixID | Counts | Sigma | Mean | Median | Sigma |
| A | 13 | 254 | 24156 | 50.08 | 2185 | 2138 | 439.7 |
| A | 0 | 226 | 18797 | 37.89 | 2185 | 2138 | 439.7 |
| A | 3 | 137 | 18183 | 36.49 | 2185 | 2138 | 439.7 |
| B | 12 | 111 | 52456 | 121.43 | 2180 | 2122 | 414.5 |
| B | 11 | 111 | 46297 | 106.57 | 2180 | 2122 | 414.5 |
| B | 14 | 111 | 39978 | 91.33 | 2180 | 2122 | 414.5 |
| C | 3 | 233 | 4415432 | 9093.86 | 2089 | 2104 | 485.3 |
| C | 14 | 238 | 321190 | 657.49 | 2089 | 2104 | 485.3 |
| C | 6 | 96 | 27036 | 51.37 | 2089 | 2104 | 485.3 |
| D | 1 | 52 | 779480 | 1506.31 | 2126 | 2065 | 516.1 |
| D | 11 | 176 | 229857 | 441.37 | 2126 | 2065 | 516.1 |
| D | 7 | 96 | 86561 | 163.72 | 2126 | 2065 | 516.1 |
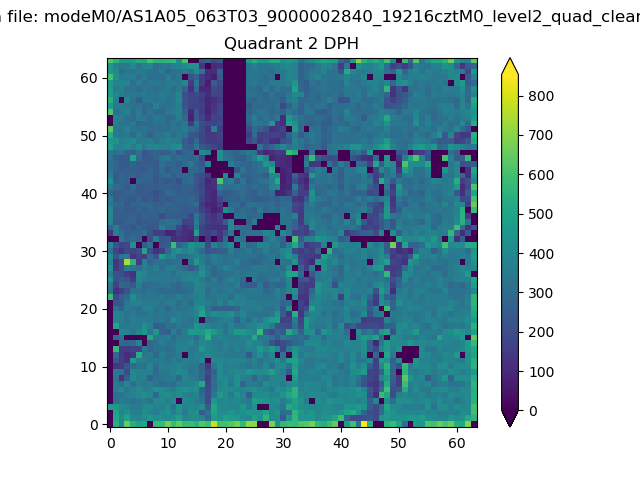
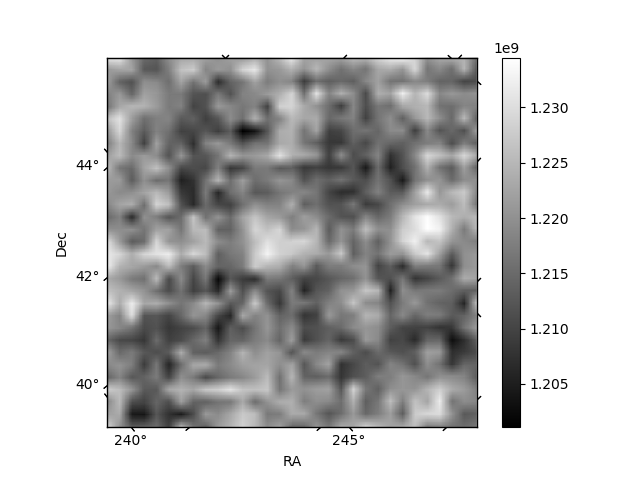
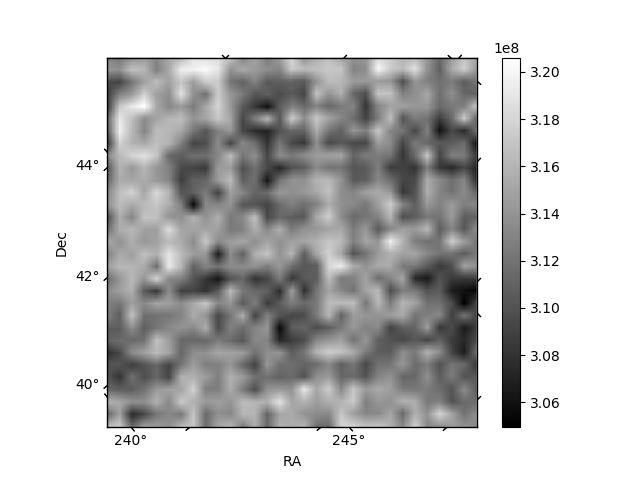
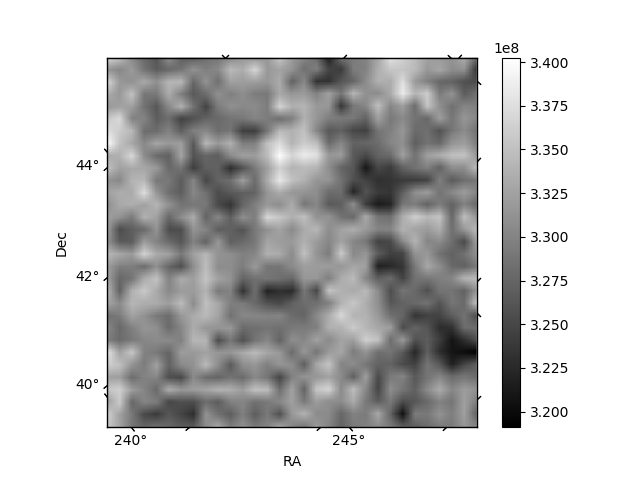
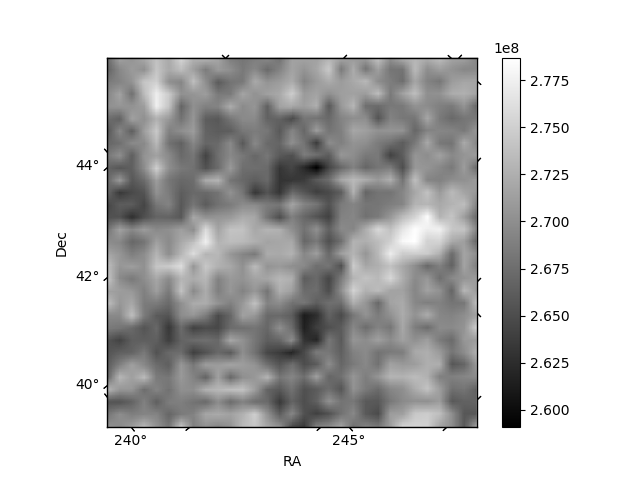
Histogram calculated using DETX and DETY for each event in the final _common_clean file
| Quadrant A | 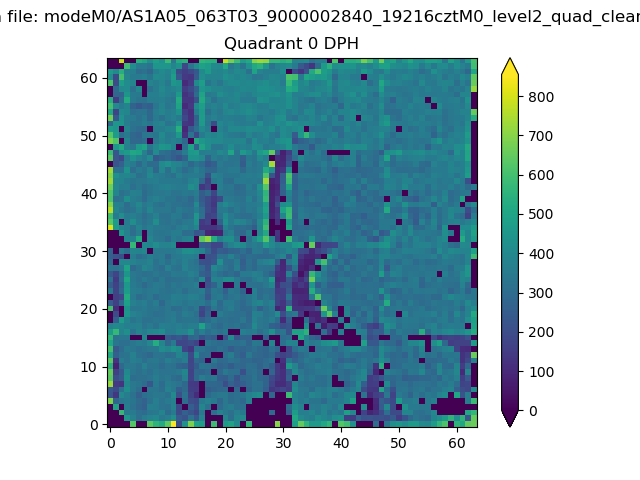 |
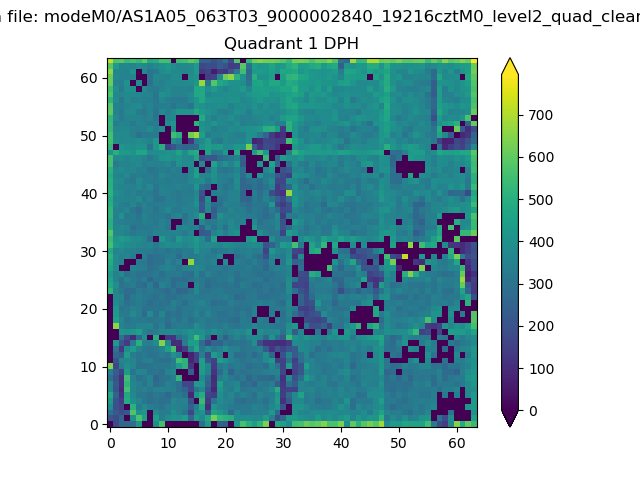 |
Quadrant B |
|---|---|---|---|
| Quadrant D | 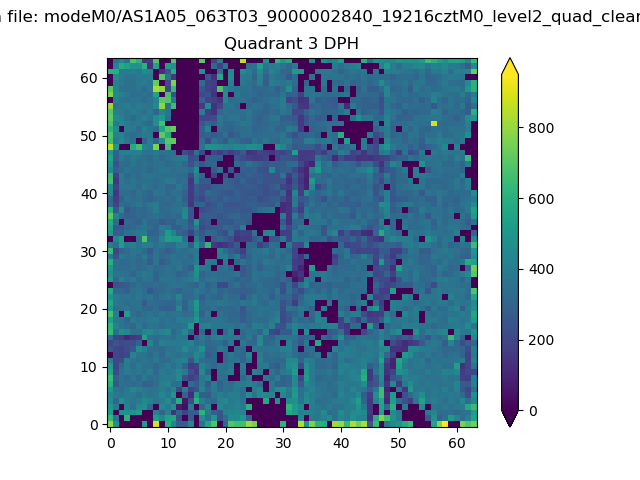 |
 |
Quadrant C |
| Plot type | Count rate plots | Images |
|---|---|---|
| Comparison with Poisson distribution Blue bars denote a histogram of data divided into 1 sec bins. Red curve is a Poisson curve with rate = median count rate of data. |
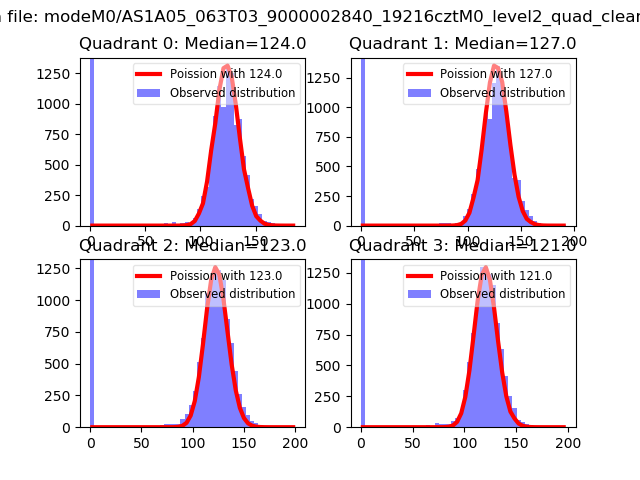 |
 |
| Quadrant-wise count rates Data is divided into 100 sec bins |
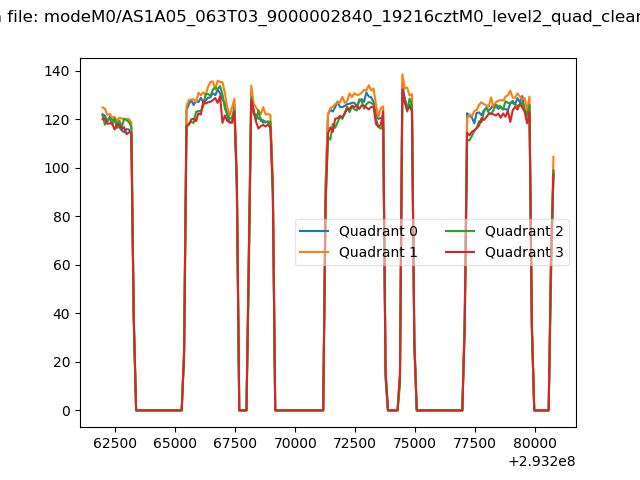 |
|
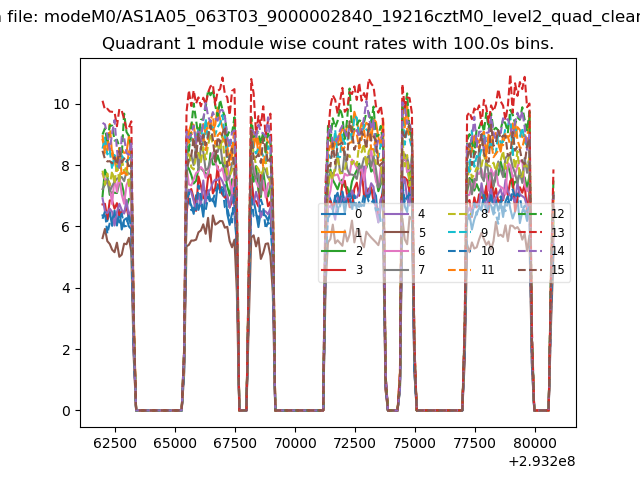
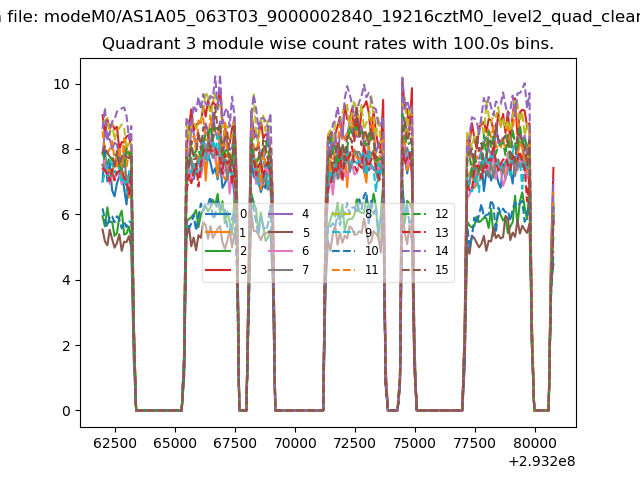
| Module-wise count rates for Quadrant A Data is divided into 100 sec bins |
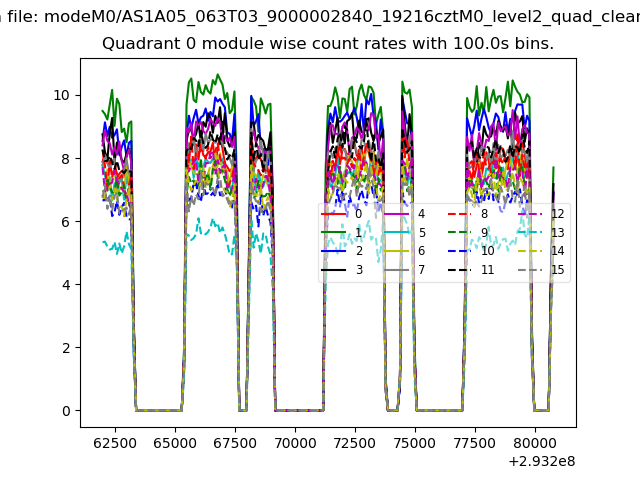 |
 |
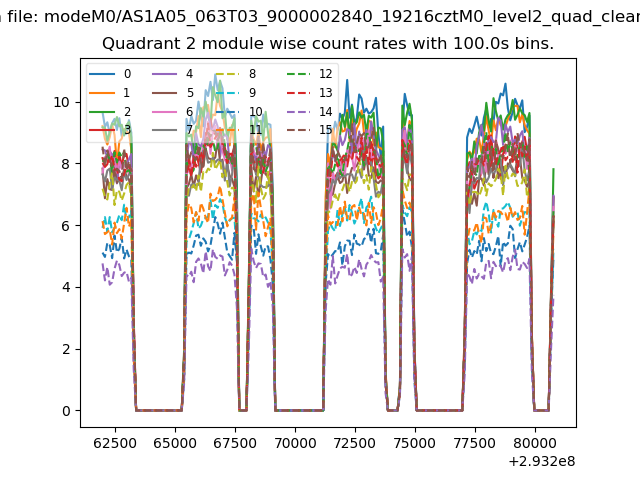
| Module-wise count rates for Quadrant B Data is divided into 100 sec bins |
 |
 |
| Module-wise count rates for Quadrant C Data is divided into 100 sec bins |
 |
 |
| Module-wise count rates for Quadrant D Data is divided into 100 sec bins |
 |
 |
| Parameter | Plot |
|---|---|
| CZT HV Monitor | 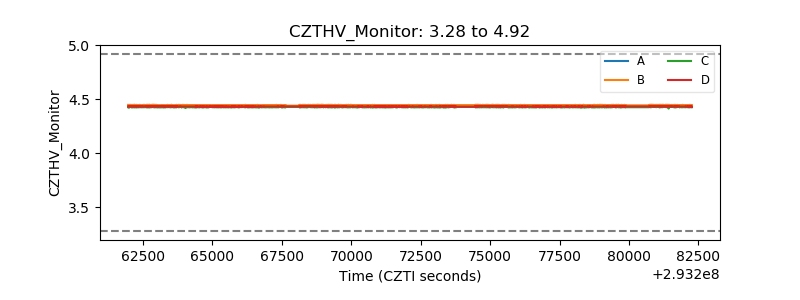 |
| D_VDD | 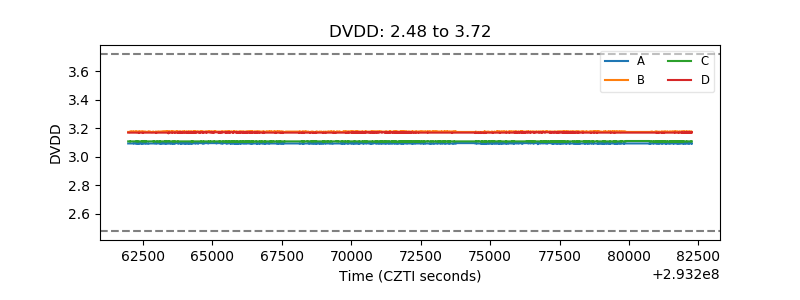 |
| Temperature 1 | 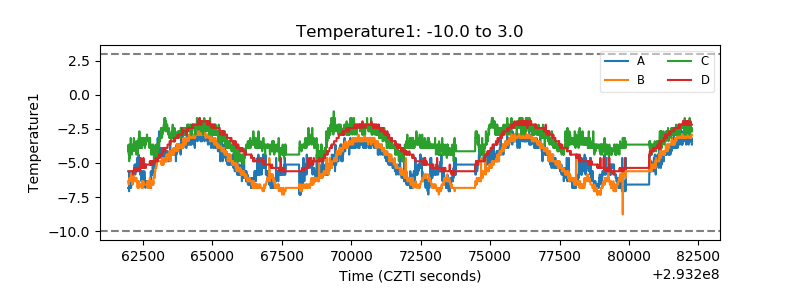 |
| Veto HV Monitor | 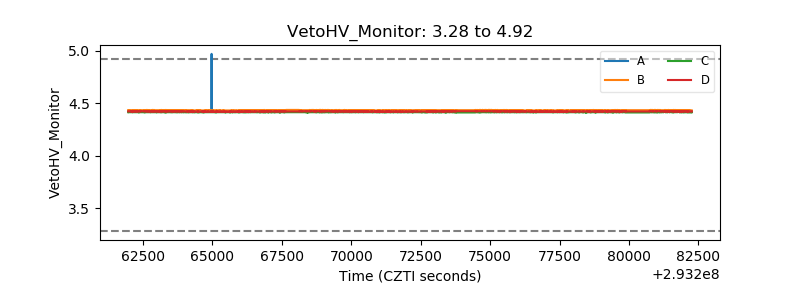 |
| Veto LLD | 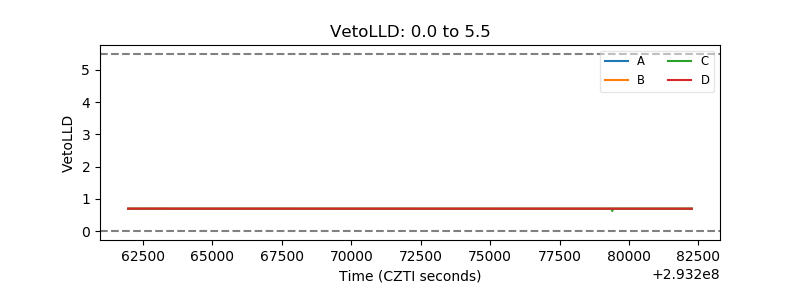 |
| Alpha Counter | 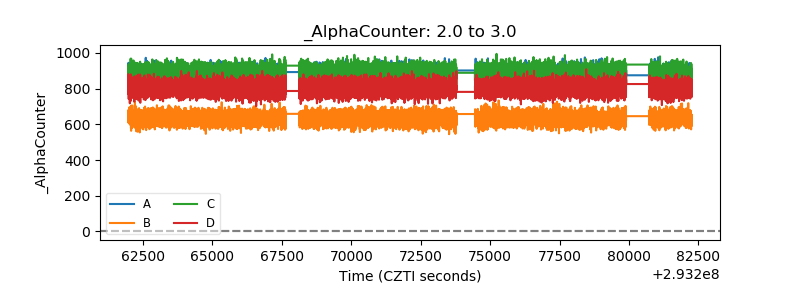 |
| _CPM_Rate | 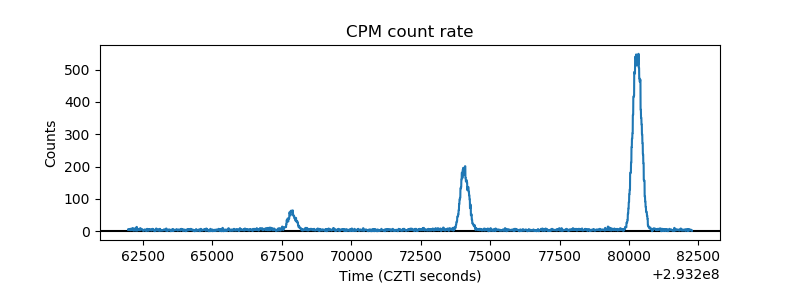 |
| CZT Counter | 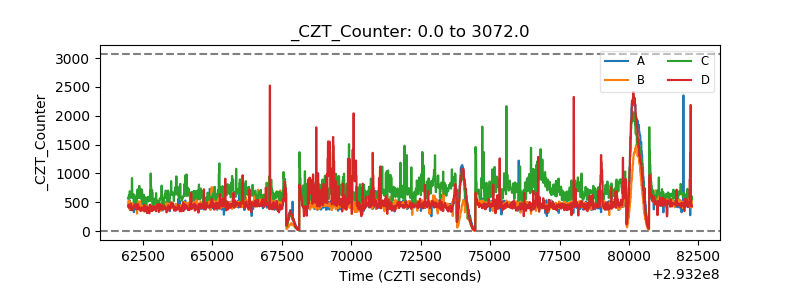 |
| +2.5 Volts monitor |  |
| +5 Volts monitor |  |
| _ROLL_ROT | 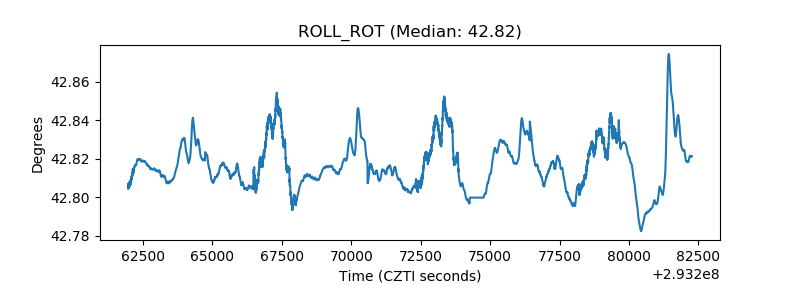 |
| _Roll_DEC | 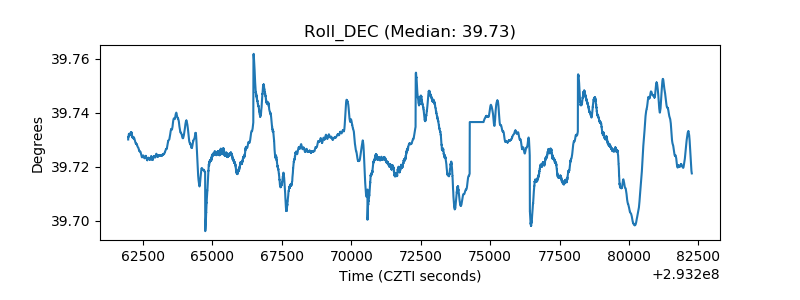 |
| _Roll_RA | 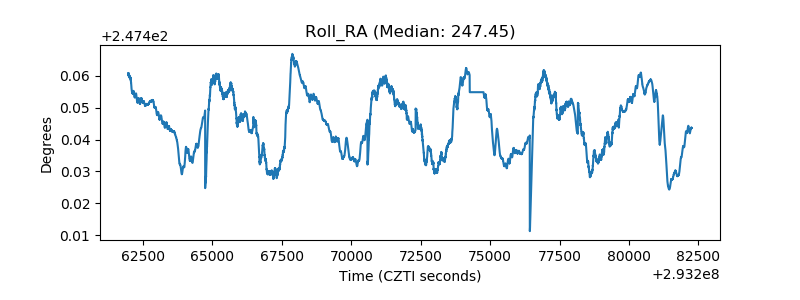 |
| Veto Counter | 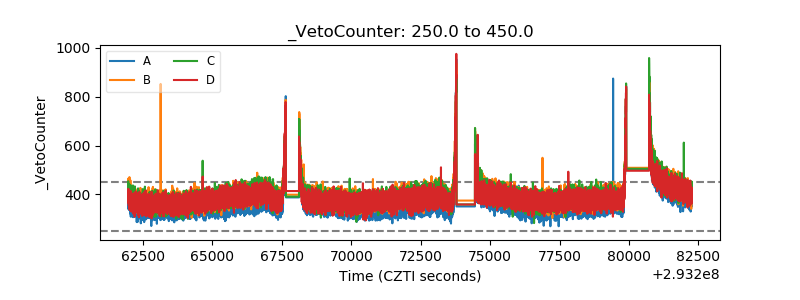 |