| Param | Original file | Final file |
|---|---|---|
| Filename | modeM0/AS1A05_063T03_9000002840_19217cztM0_level2.evt | modeM0/AS1A05_063T03_9000002840_19217cztM0_level2_quad_clean.evt |
| Size (bytes) | 510,445,440 | 67,515,840 |
| Size | 486.8 MB | 64.4 MB |
| Events in quadrant A | 3,260,175 | 398,373 |
| Events in quadrant B | 3,295,855 | 407,074 |
| Events in quadrant C | 4,866,546 | 385,787 |
| Events in quadrant D | 3,583,123 | 387,305 |
| Mode M9 | |||
|---|---|---|---|
| Quadrant | BADHDUFLAG | Total packets | Discarded packets |
| A | 0 | 17 | 0 |
| B | 0 | 17 | 0 |
| C | 0 | 17 | 0 |
| D | 0 | 17 | 0 |
| Mode SS | |||
|---|---|---|---|
| Quadrant | BADHDUFLAG | Total packets | Discarded packets |
| A | 0 | 136 | 0 |
| B | 0 | 136 | 0 |
| C | 0 | 136 | 0 |
| D | 0 | 136 | 0 |
| Mode M0 | |||
|---|---|---|---|
| Quadrant | BADHDUFLAG | Total packets | Discarded packets |
| A | 0 | 13974 | 3 |
| B | 0 | 13944 | 2 |
| C | 0 | 19545 | 2 |
| D | 0 | 15080 | 2 |
| Quadrant | Total seconds | Saturated seconds | Saturation percentage |
|---|---|---|---|
| A | 6677 | 70 | 1.048375% |
| B | 6677 | 80 | 1.198143% |
| C | 6677 | 219 | 3.279916% |
| D | 6677 | 148 | 2.216564% |
Noise dominated data is calculated using 1-second bins in cleaned event files. If a bin has >2000 counts, and if more than 50% of those come from <1% of pixels, then it is considered to be noise-dominated and hence unusable.
| Quadrant | # 1 sec bins | Bins with >0 counts | Bins with >2000 counts | High rate bins dominated by noise | Noise dominated (total time) | Noise dominated (detector-on time) | Marked lightcurve |
|---|---|---|---|---|---|---|---|
| A | 7682 | 6677 | 2 | 2 | 0.03% | 0.03% | 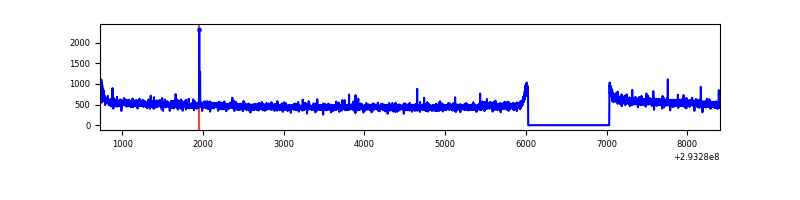 |
| B | 7682 | 6677 | 0 | 0 | 0.00% | 0.00% | 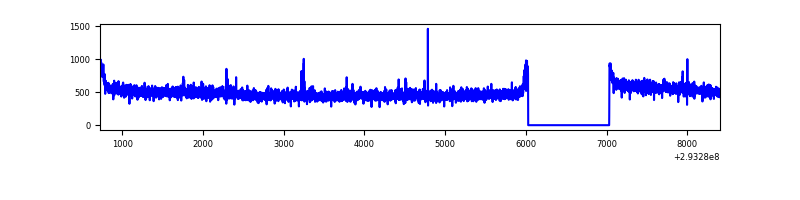 |
| C | 7682 | 6677 | 34 | 34 | 0.44% | 0.51% | 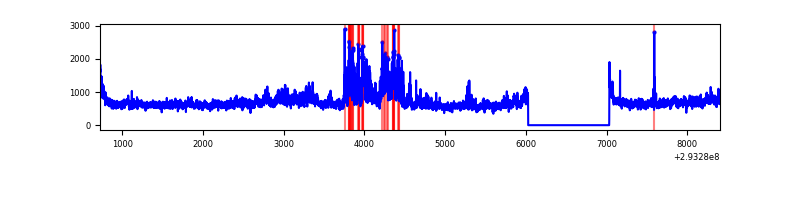 |
| D | 7682 | 6677 | 92 | 92 | 1.20% | 1.38% | 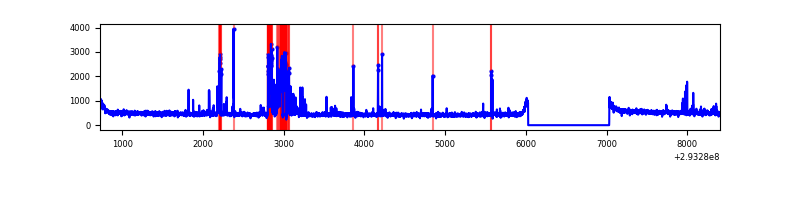 |
Top three noisy pixels from each quadrant. If the there are fewer than three noisy pixels in the level2.evt file, extra rows are filled as -1
| Pixel properties | Quadrant properties | ||||||
|---|---|---|---|---|---|---|---|
| Quadrant | DetID | PixID | Counts | Sigma | Mean | Median | Sigma |
| A | 9 | 143 | 21625 | 122.74 | 841 | 824 | 169.5 |
| A | 0 | 226 | 7207 | 37.67 | 841 | 824 | 169.5 |
| A | 13 | 254 | 6831 | 35.45 | 841 | 824 | 169.5 |
| B | 12 | 111 | 19726 | 118.12 | 837 | 817 | 160.1 |
| B | 11 | 111 | 17489 | 104.14 | 837 | 817 | 160.1 |
| B | 14 | 111 | 15217 | 89.95 | 837 | 817 | 160.1 |
| C | 3 | 233 | 1622345 | 8686.99 | 800 | 804 | 186.7 |
| C | 14 | 238 | 124677 | 663.62 | 800 | 804 | 186.7 |
| C | 13 | 61 | 5782 | 26.67 | 800 | 804 | 186.7 |
| D | 11 | 176 | 457348 | 2301.64 | 817 | 795 | 198.4 |
| D | 2 | 234 | 26400 | 129.08 | 817 | 795 | 198.4 |
| D | 10 | 199 | 18598 | 89.75 | 817 | 795 | 198.4 |
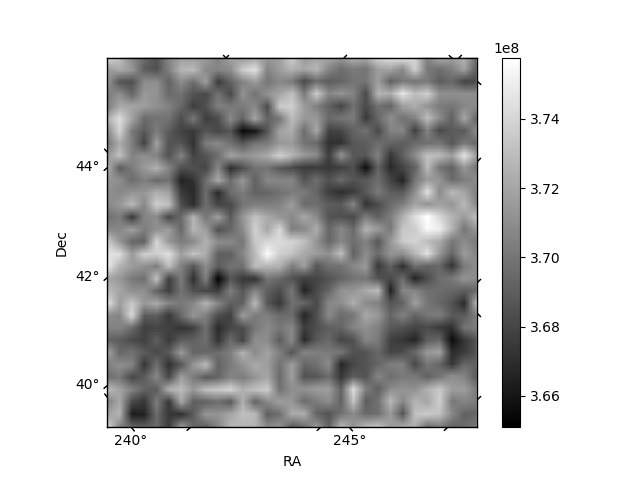
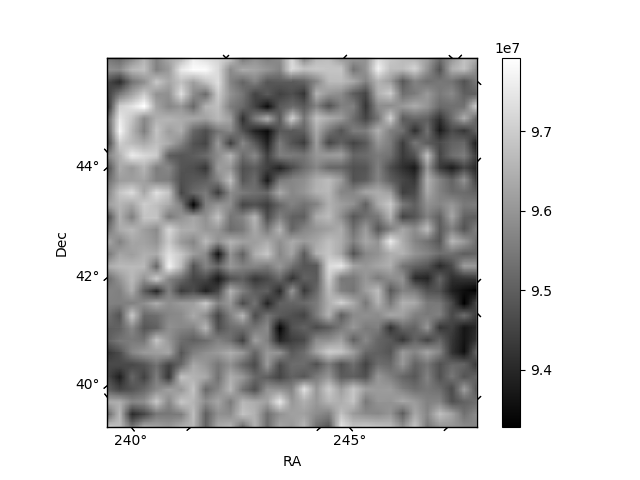
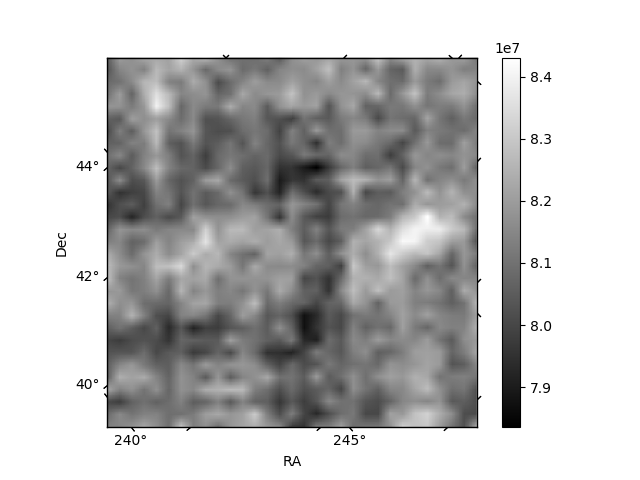
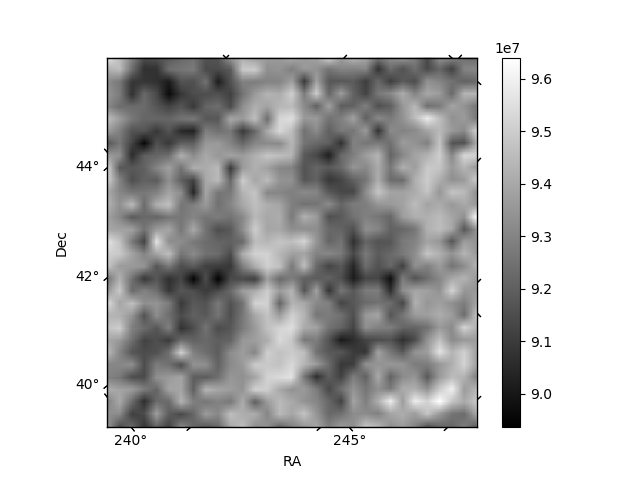
Histogram calculated using DETX and DETY for each event in the final _common_clean file
| Quadrant A | 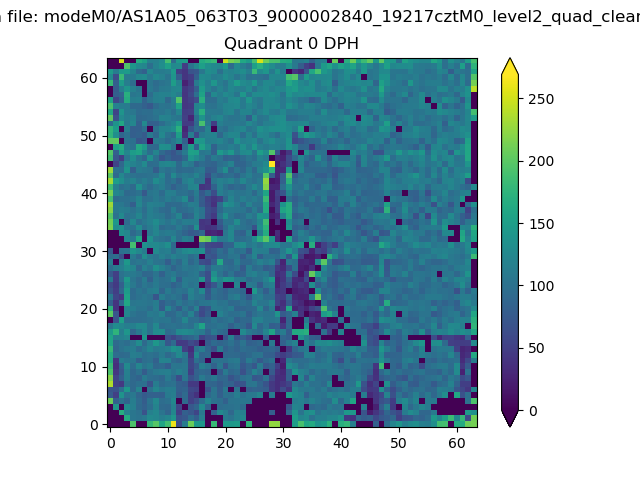 |
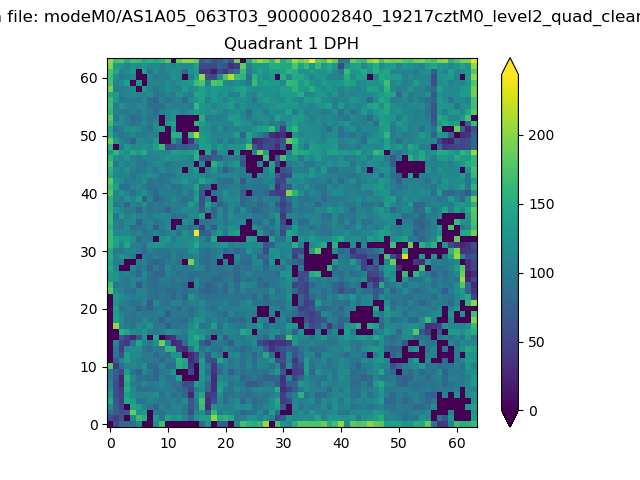 |
Quadrant B |
|---|---|---|---|
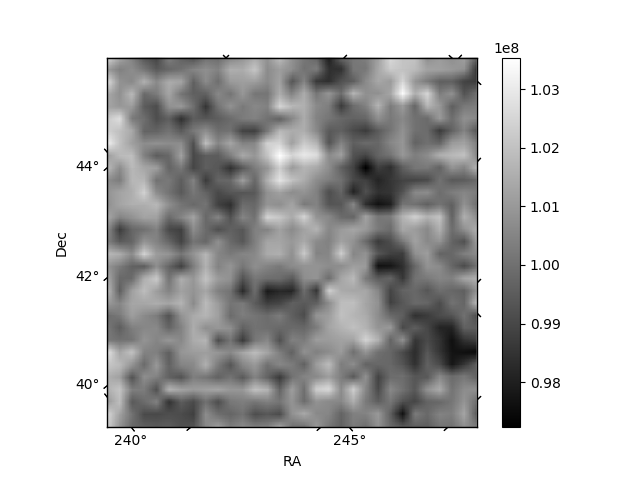
| Quadrant D | 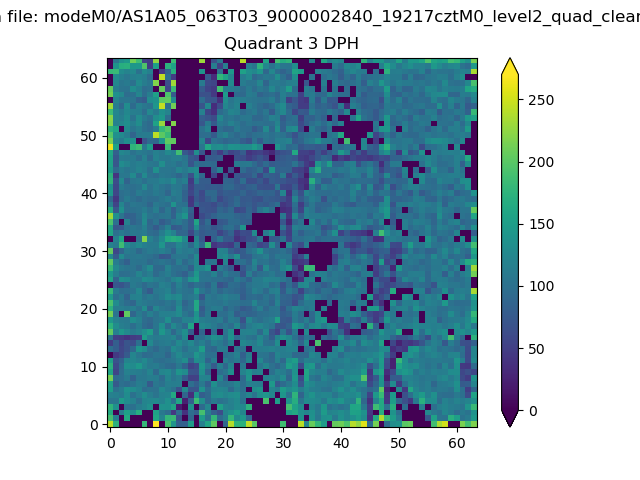 |
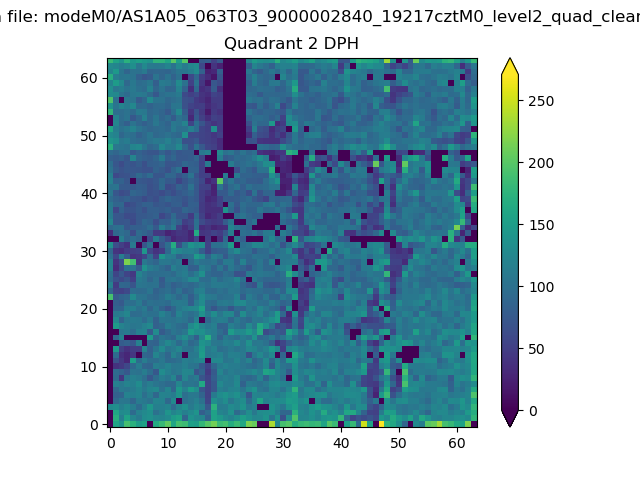 |
Quadrant C |
| Plot type | Count rate plots | Images |
|---|---|---|
| Comparison with Poisson distribution Blue bars denote a histogram of data divided into 1 sec bins. Red curve is a Poisson curve with rate = median count rate of data. |
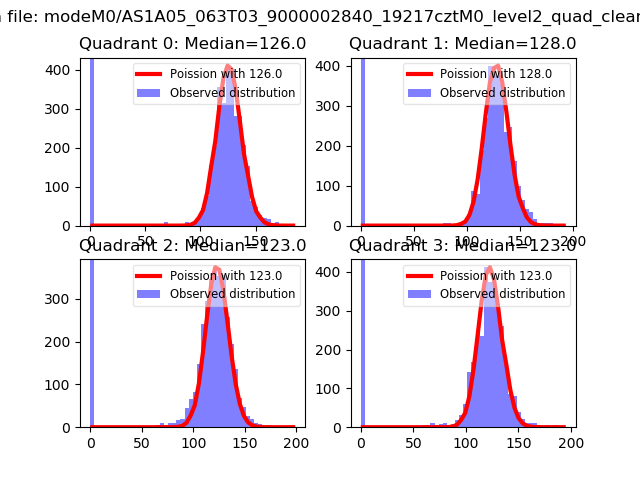 |
 |
| Quadrant-wise count rates Data is divided into 100 sec bins |
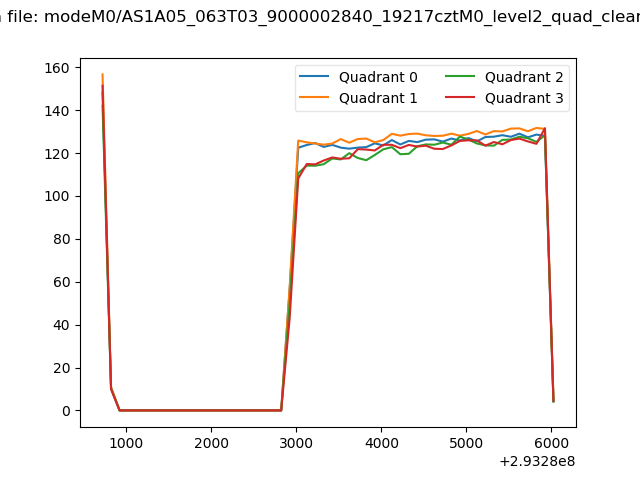 |
|
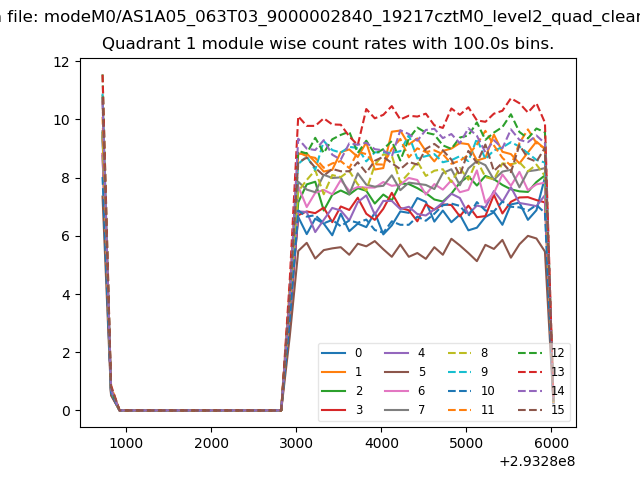
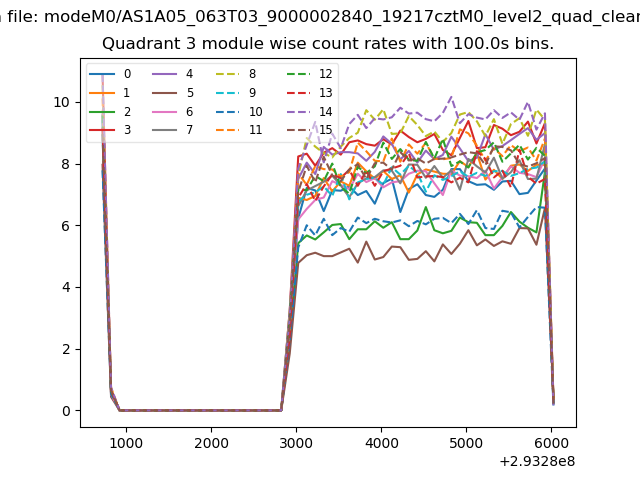
| Module-wise count rates for Quadrant A Data is divided into 100 sec bins |
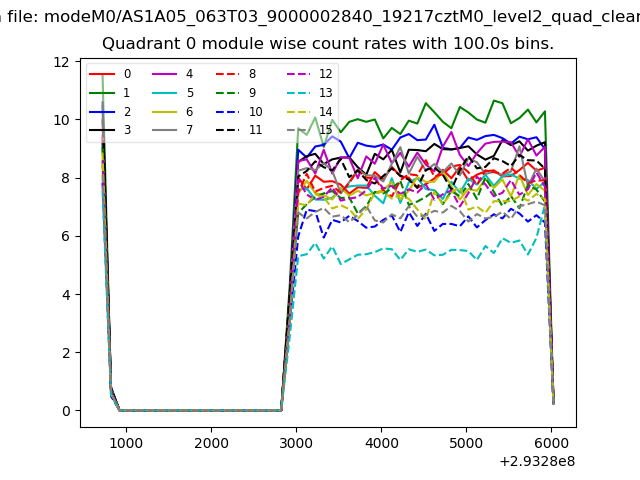 |
 |
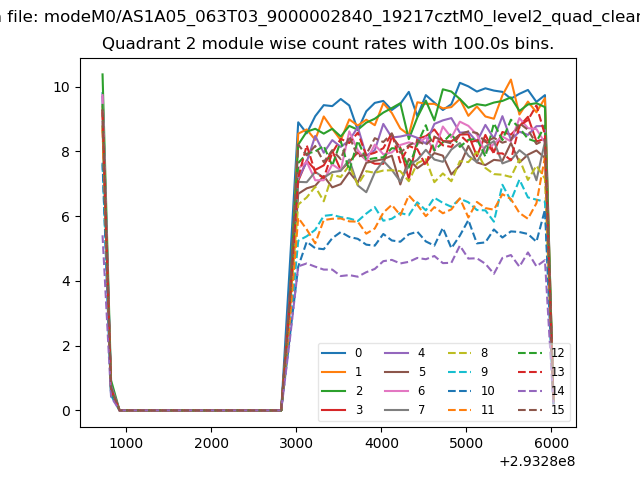
| Module-wise count rates for Quadrant B Data is divided into 100 sec bins |
 |
 |
| Module-wise count rates for Quadrant C Data is divided into 100 sec bins |
 |
 |
| Module-wise count rates for Quadrant D Data is divided into 100 sec bins |
 |
 |
| Parameter | Plot |
|---|---|
| CZT HV Monitor | 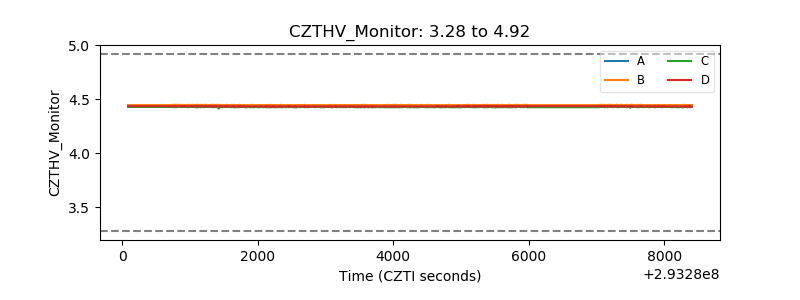 |
| D_VDD | 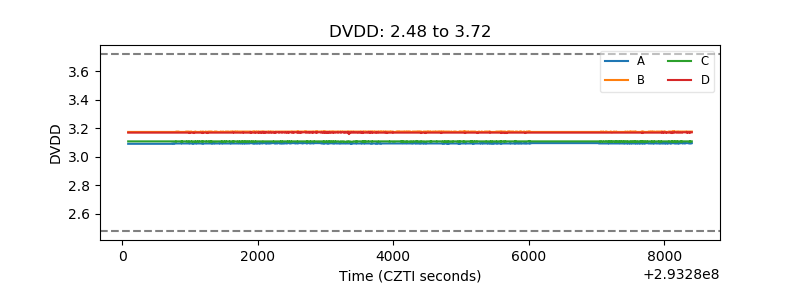 |
| Temperature 1 | 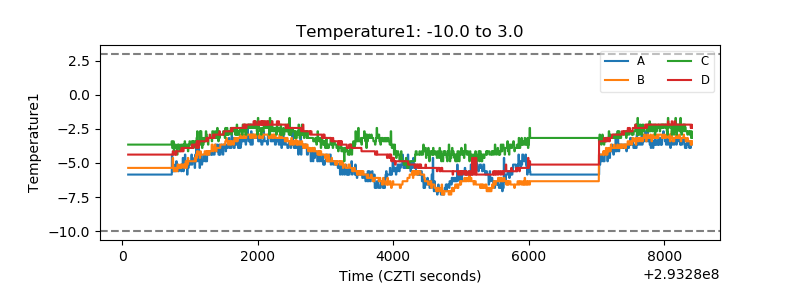 |
| Veto HV Monitor | 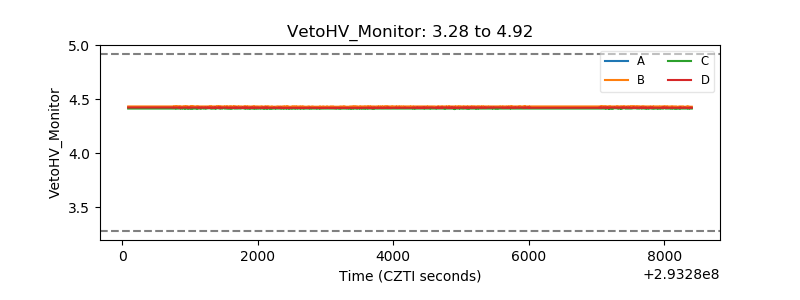 |
| Veto LLD | 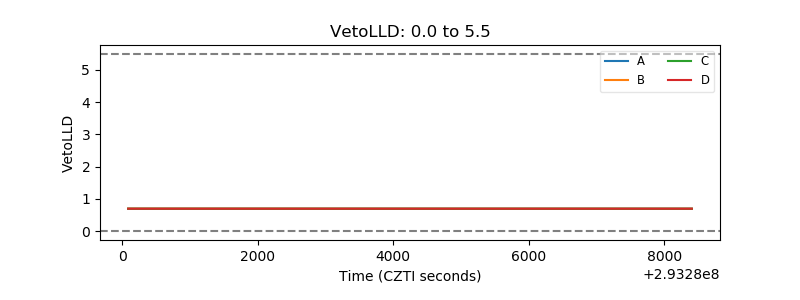 |
| Alpha Counter | 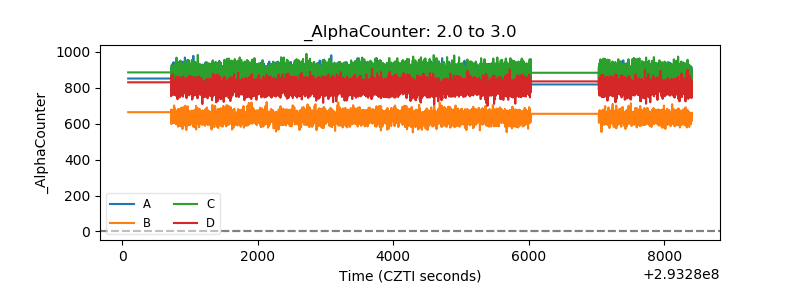 |
| _CPM_Rate | 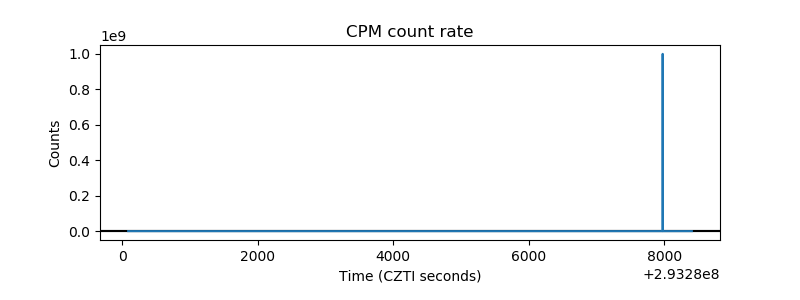 |
| CZT Counter | 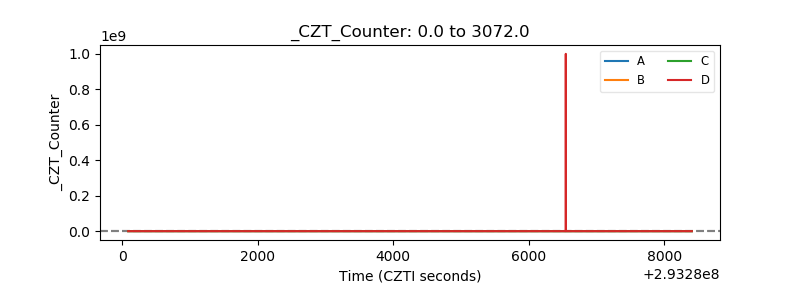 |
| +2.5 Volts monitor | 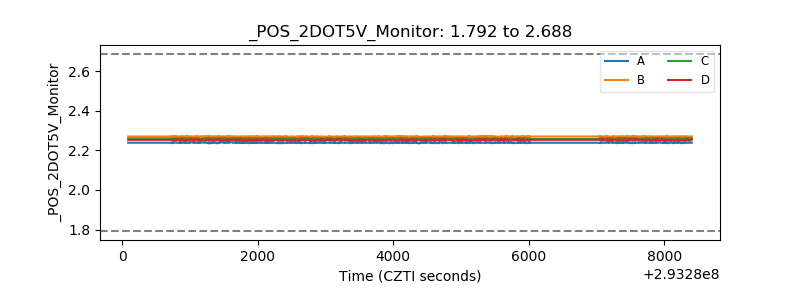 |
| +5 Volts monitor | 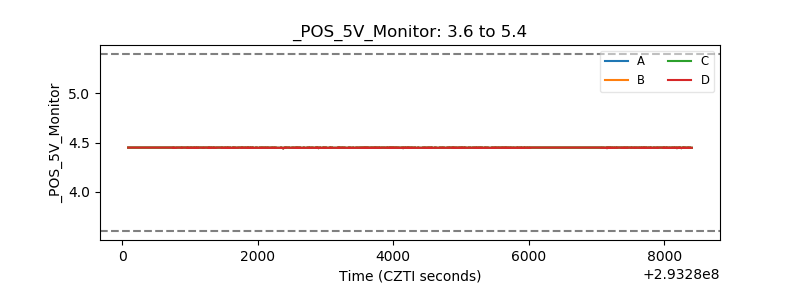 |
| _ROLL_ROT | 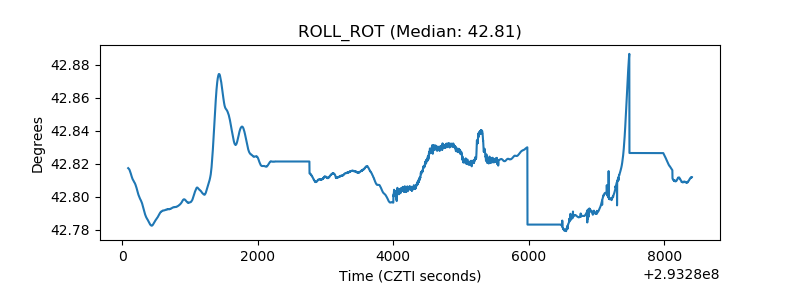 |
| _Roll_DEC | 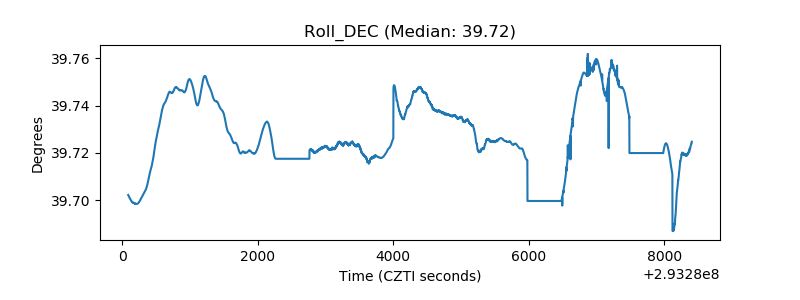 |
| _Roll_RA | 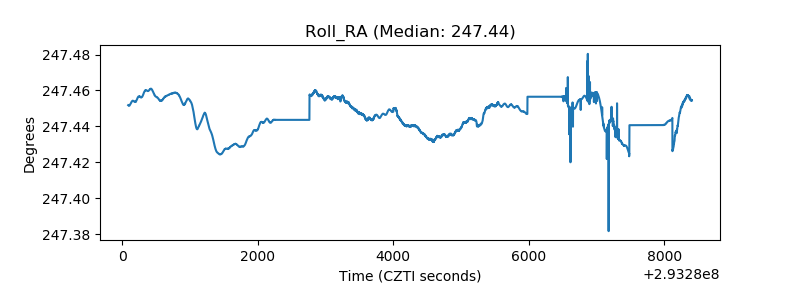 |
| Veto Counter | 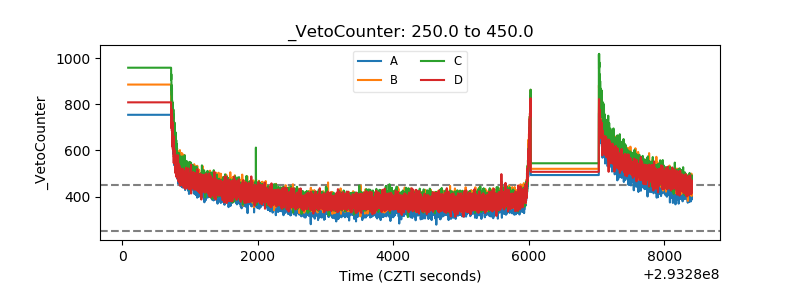 |