| Param | Original file | Final file |
|---|---|---|
| Filename | modeM0/AS1A05_063T03_9000002840_19220cztM0_level2.evt | modeM0/AS1A05_063T03_9000002840_19220cztM0_level2_quad_clean.evt |
| Size (bytes) | 207,120,960 | 34,018,560 |
| Size | 197.5 MB | 32.4 MB |
| Events in quadrant A | 1,530,652 | 211,295 |
| Events in quadrant B | 1,452,019 | 214,074 |
| Events in quadrant C | 1,630,057 | 207,180 |
| Events in quadrant D | 1,474,281 | 203,488 |
| Mode SS | |||
|---|---|---|---|
| Quadrant | BADHDUFLAG | Total packets | Discarded packets |
| A | 0 | 54 | 0 |
| B | 0 | 54 | 0 |
| C | 0 | 54 | 0 |
| D | 0 | 54 | 0 |
| Mode M0 | |||
|---|---|---|---|
| Quadrant | BADHDUFLAG | Total packets | Discarded packets |
| A | 0 | 6328 | 0 |
| B | 0 | 6092 | 0 |
| C | 0 | 6632 | 0 |
| D | 0 | 6074 | 0 |
| Quadrant | Total seconds | Saturated seconds | Saturation percentage |
|---|---|---|---|
| A | 2704 | 44 | 1.627219% |
| B | 2704 | 15 | 0.554734% |
| C | 2705 | 30 | 1.109057% |
| D | 2705 | 21 | 0.776340% |
Noise dominated data is calculated using 1-second bins in cleaned event files. If a bin has >2000 counts, and if more than 50% of those come from <1% of pixels, then it is considered to be noise-dominated and hence unusable.
| Quadrant | # 1 sec bins | Bins with >0 counts | Bins with >2000 counts | High rate bins dominated by noise | Noise dominated (total time) | Noise dominated (detector-on time) | Marked lightcurve |
|---|---|---|---|---|---|---|---|
| A | 2704 | 2704 | 26 | 26 | 0.96% | 0.96% | 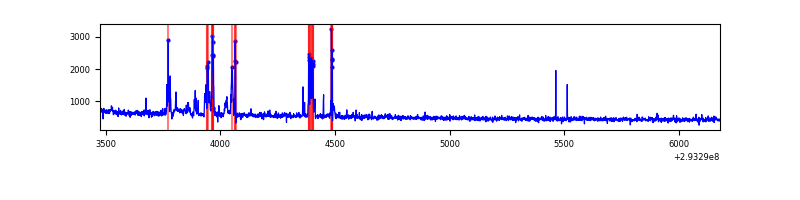 |
| B | 2704 | 2704 | 5 | 5 | 0.18% | 0.18% | 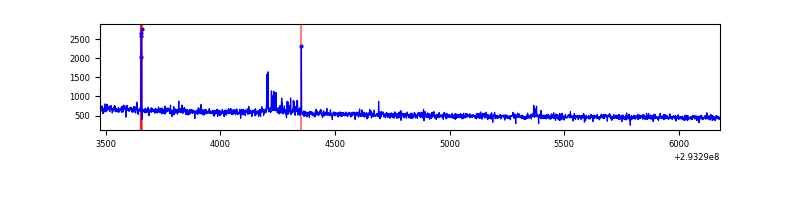 |
| C | 2705 | 2705 | 0 | 0 | 0.00% | 0.00% | 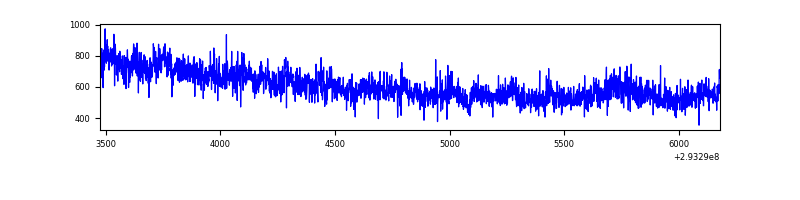 |
| D | 2705 | 2705 | 18 | 18 | 0.67% | 0.67% | 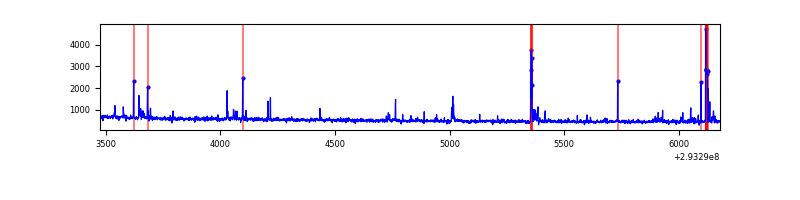 |
Top three noisy pixels from each quadrant. If the there are fewer than three noisy pixels in the level2.evt file, extra rows are filled as -1
| Pixel properties | Quadrant properties | ||||||
|---|---|---|---|---|---|---|---|
| Quadrant | DetID | PixID | Counts | Sigma | Mean | Median | Sigma |
| A | 9 | 143 | 146872 | 2017.04 | 359 | 353 | 72.6 |
| A | 13 | 254 | 3097 | 37.78 | 359 | 353 | 72.6 |
| A | 0 | 226 | 3076 | 37.49 | 359 | 353 | 72.6 |
| B | 0 | 190 | 13022 | 185.7 | 359 | 351 | 68.2 |
| B | 3 | 64 | 11284 | 160.23 | 359 | 351 | 68.2 |
| B | 0 | 229 | 10255 | 145.15 | 359 | 351 | 68.2 |
| C | 3 | 233 | 203346 | 2480.78 | 351 | 354 | 81.8 |
| C | 14 | 238 | 56078 | 681.01 | 351 | 354 | 81.8 |
| C | 6 | 96 | 2698 | 28.65 | 351 | 354 | 81.8 |
| D | 11 | 176 | 87045 | 991.33 | 357 | 347 | 87.5 |
| D | 5 | 222 | 31533 | 356.59 | 357 | 347 | 87.5 |
| D | 2 | 234 | 11069 | 122.6 | 357 | 347 | 87.5 |
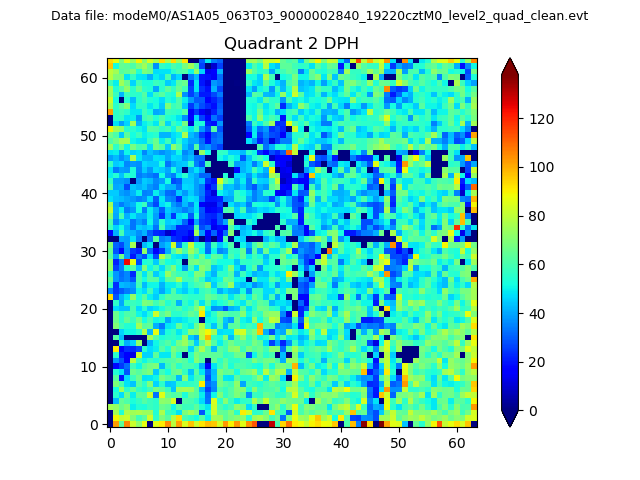
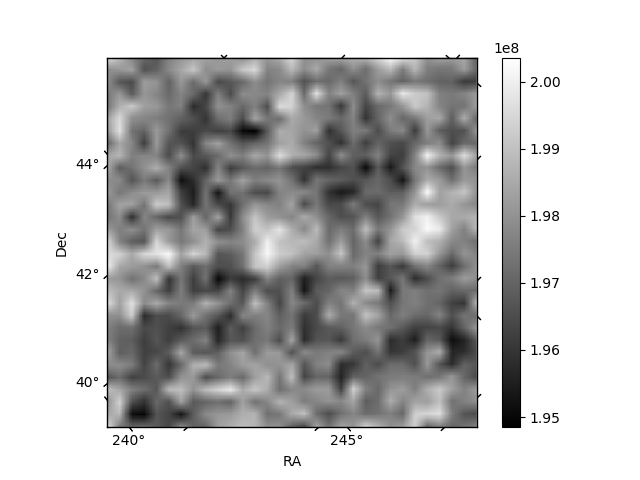
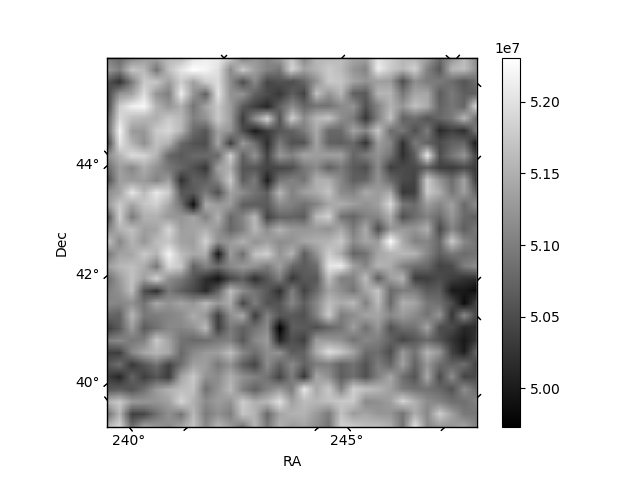
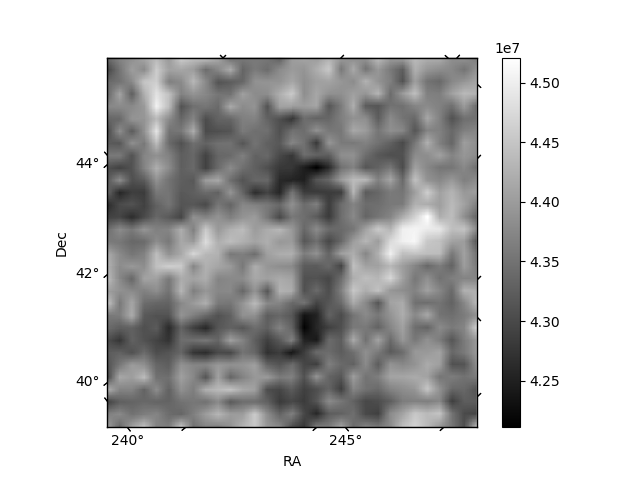
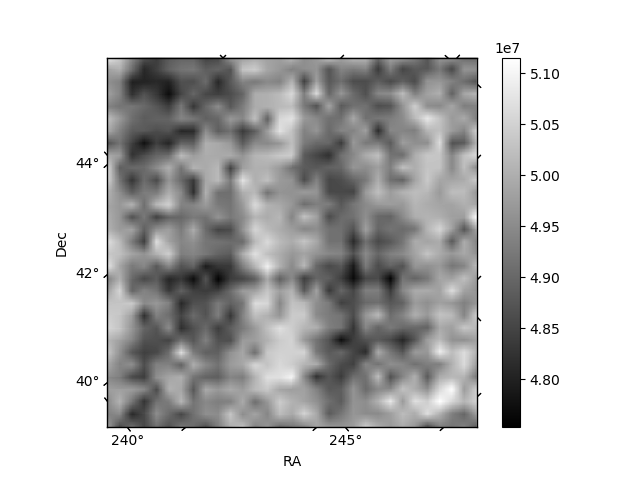
Histogram calculated using DETX and DETY for each event in the final _common_clean file
| Quadrant A | 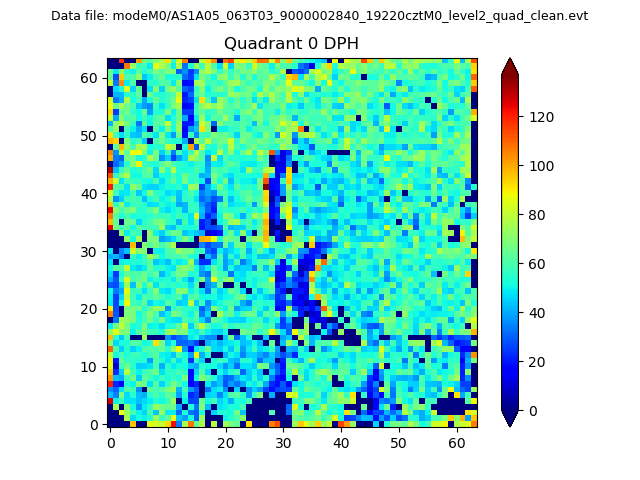 |
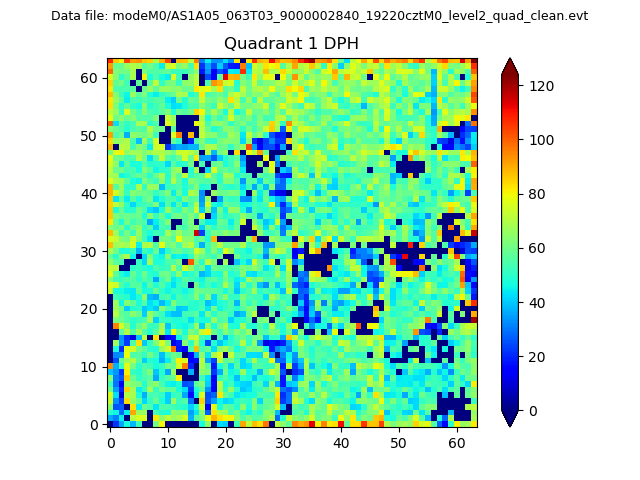 |
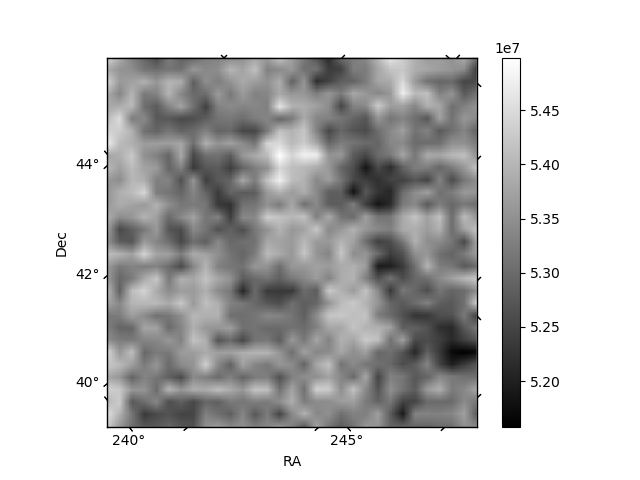
Quadrant B |
|---|---|---|---|
| Quadrant D | 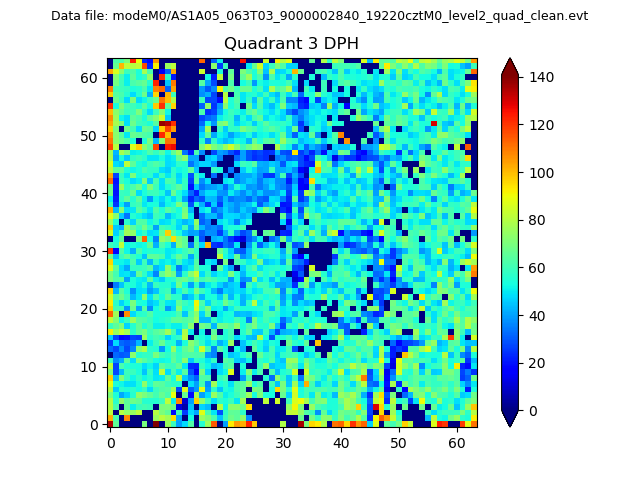 |
 |
Quadrant C |
| Plot type | Count rate plots | Images |
|---|---|---|
| Comparison with Poisson distribution Blue bars denote a histogram of data divided into 1 sec bins. Red curve is a Poisson curve with rate = median count rate of data. |
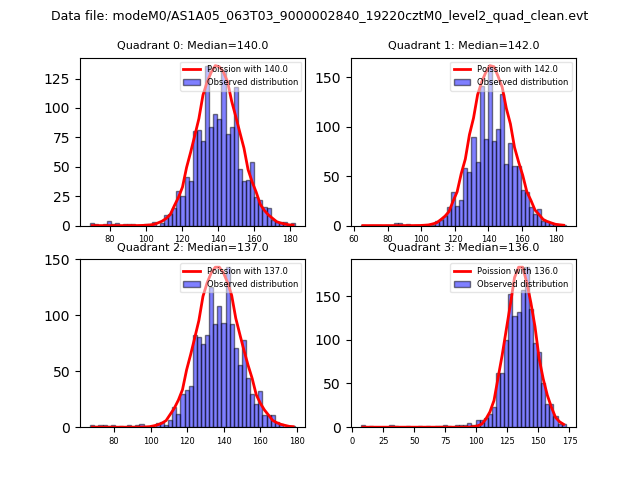 |
 |
| Quadrant-wise count rates Data is divided into 100 sec bins |
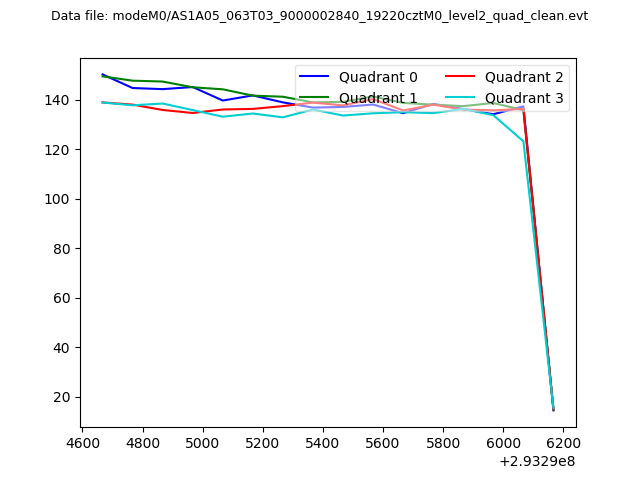 |
|
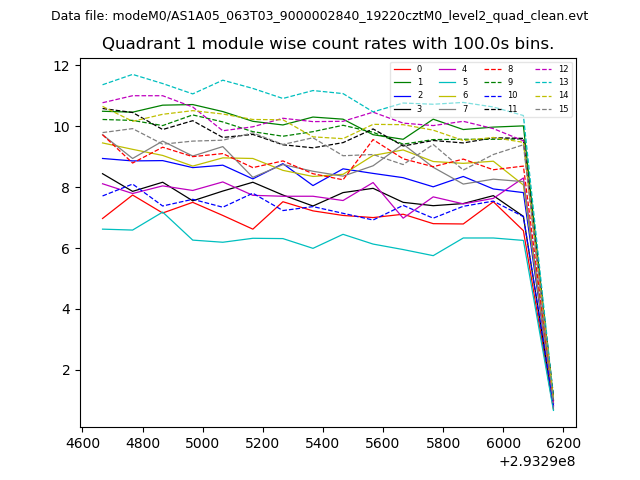
| Module-wise count rates for Quadrant A Data is divided into 100 sec bins |
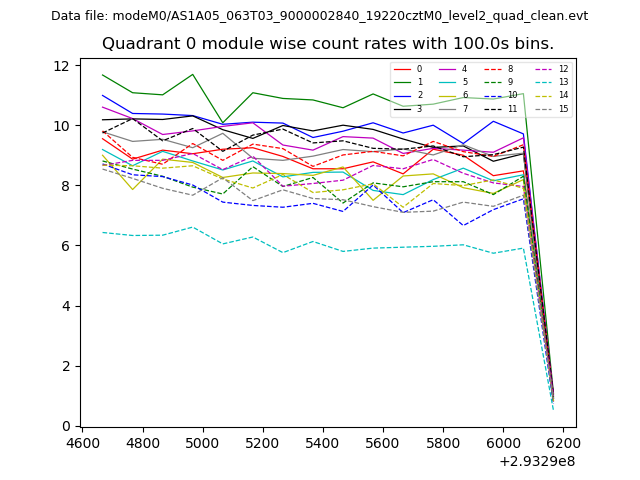 |
 |
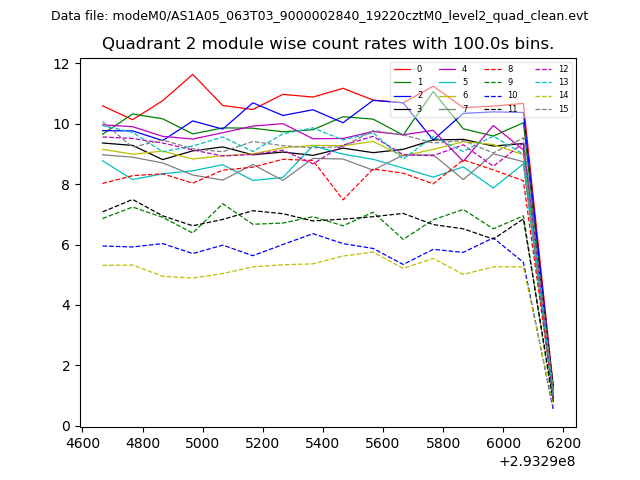
| Module-wise count rates for Quadrant B Data is divided into 100 sec bins |
 |
 |
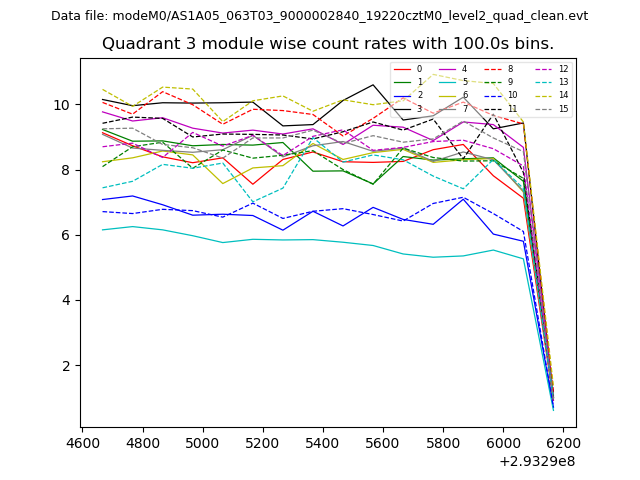
| Module-wise count rates for Quadrant C Data is divided into 100 sec bins |
 |
 |
| Module-wise count rates for Quadrant D Data is divided into 100 sec bins |
 |
 |
| Parameter | Plot |
|---|---|
| CZT HV Monitor | 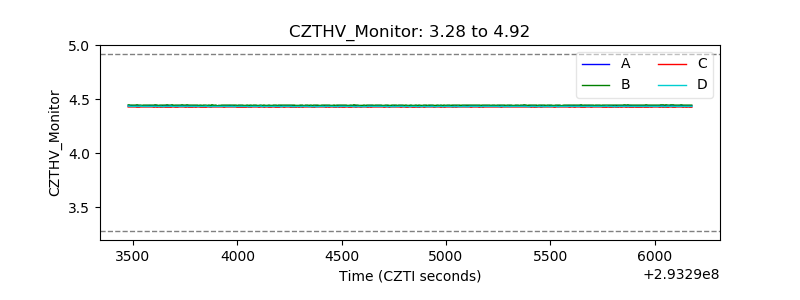 |
| D_VDD | 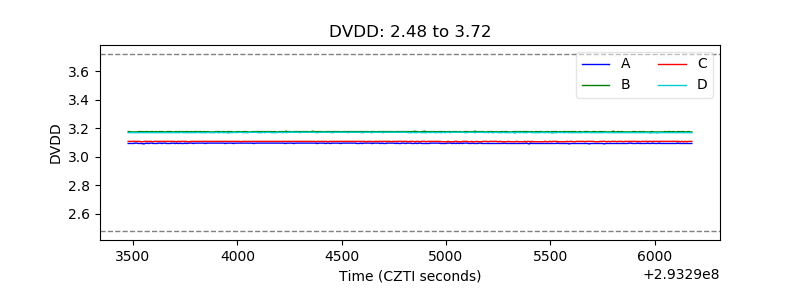 |
| Temperature 1 |  |
| Veto HV Monitor | 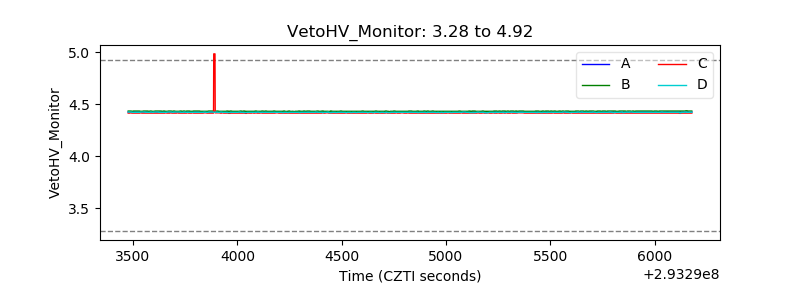 |
| Veto LLD |  |
| Alpha Counter | 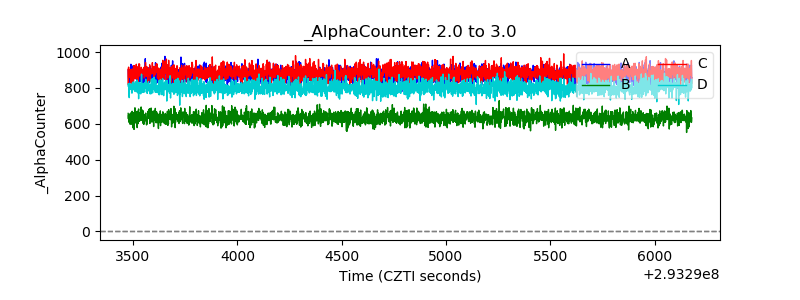 |
| _CPM_Rate | 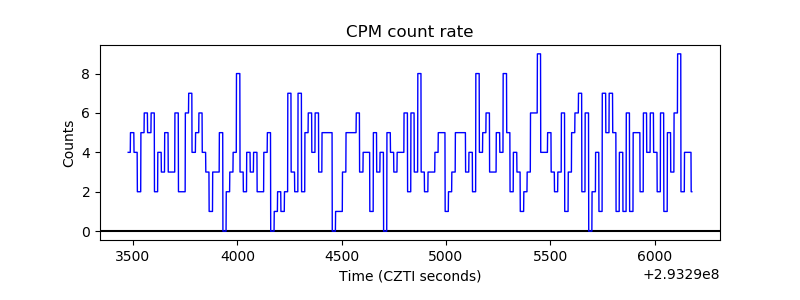 |
| CZT Counter | 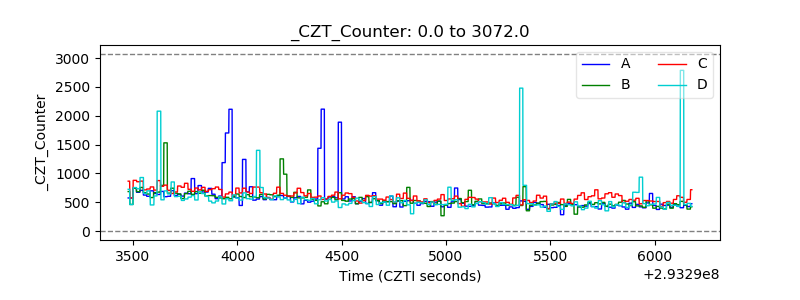 |
| +2.5 Volts monitor |  |
| +5 Volts monitor |  |
| _ROLL_ROT | 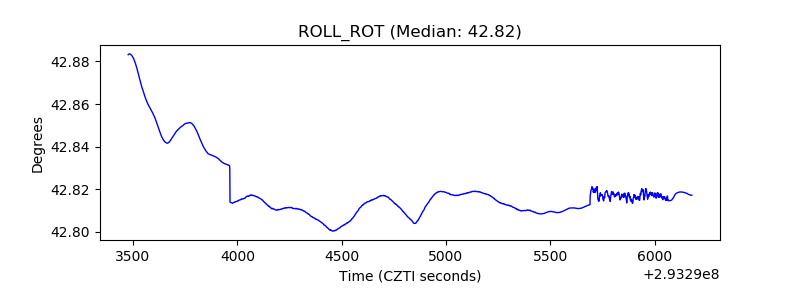 |
| _Roll_DEC | 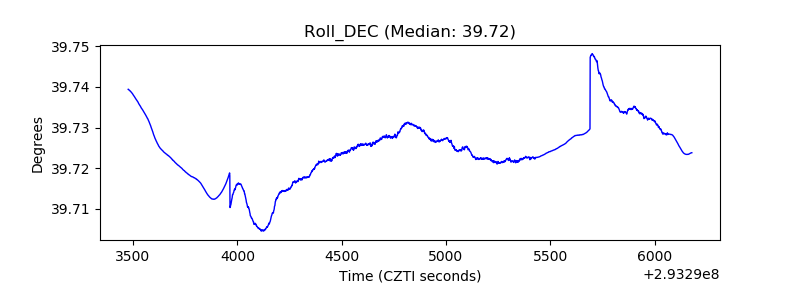 |
| _Roll_RA | 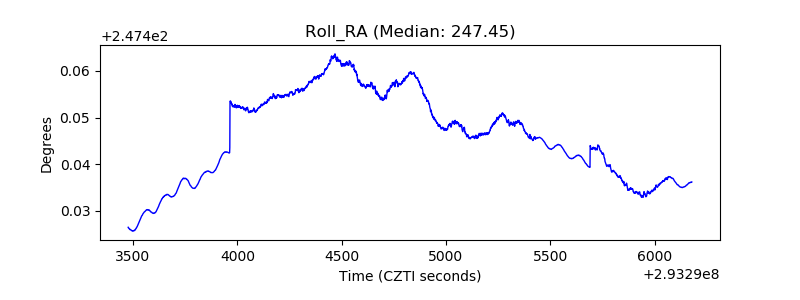 |
| Veto Counter | 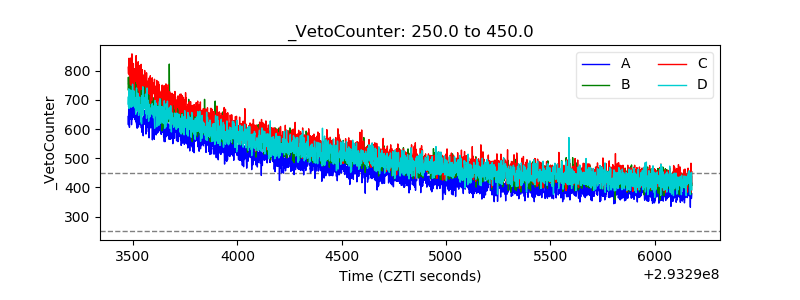 |