| Param | Original file | Final file |
|---|---|---|
| Filename | modeM0/AS1A05_063T03_9000002840_19221cztM0_level2.evt | modeM0/AS1A05_063T03_9000002840_19221cztM0_level2_quad_clean.evt |
| Size (bytes) | 519,549,120 | 100,797,120 |
| Size | 495.5 MB | 96.1 MB |
| Events in quadrant A | 3,559,361 | 645,787 |
| Events in quadrant B | 3,531,338 | 656,915 |
| Events in quadrant C | 4,594,594 | 633,528 |
| Events in quadrant D | 3,571,772 | 626,132 |
| Mode M9 | |||
|---|---|---|---|
| Quadrant | BADHDUFLAG | Total packets | Discarded packets |
| A | 0 | 12 | 0 |
| B | 0 | 12 | 0 |
| C | 0 | 12 | 0 |
| D | 0 | 12 | 0 |
| Mode SS | |||
|---|---|---|---|
| Quadrant | BADHDUFLAG | Total packets | Discarded packets |
| A | 0 | 142 | 0 |
| B | 0 | 142 | 0 |
| C | 0 | 142 | 0 |
| D | 0 | 142 | 0 |
| Mode M0 | |||
|---|---|---|---|
| Quadrant | BADHDUFLAG | Total packets | Discarded packets |
| A | 0 | 15256 | 1 |
| B | 0 | 15043 | 1 |
| C | 0 | 18726 | 1 |
| D | 0 | 15352 | 1 |
| Quadrant | Total seconds | Saturated seconds | Saturation percentage |
|---|---|---|---|
| A | 7041 | 91 | 1.292430% |
| B | 7041 | 62 | 0.880557% |
| C | 7041 | 128 | 1.817924% |
| D | 7041 | 78 | 1.107797% |
Noise dominated data is calculated using 1-second bins in cleaned event files. If a bin has >2000 counts, and if more than 50% of those come from <1% of pixels, then it is considered to be noise-dominated and hence unusable.
| Quadrant | # 1 sec bins | Bins with >0 counts | Bins with >2000 counts | High rate bins dominated by noise | Noise dominated (total time) | Noise dominated (detector-on time) | Marked lightcurve |
|---|---|---|---|---|---|---|---|
| A | 8196 | 7041 | 26 | 26 | 0.32% | 0.37% | 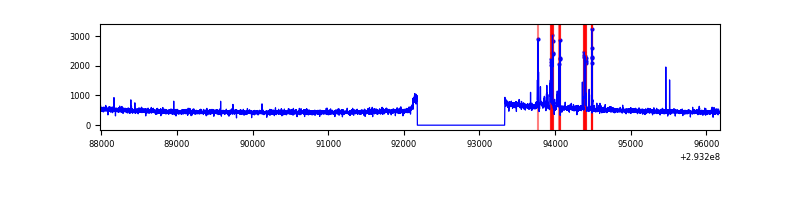 |
| B | 8196 | 7041 | 5 | 5 | 0.06% | 0.07% | 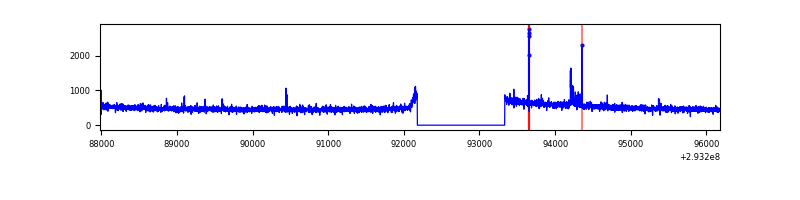 |
| C | 8196 | 7041 | 0 | 0 | 0.00% | 0.00% | 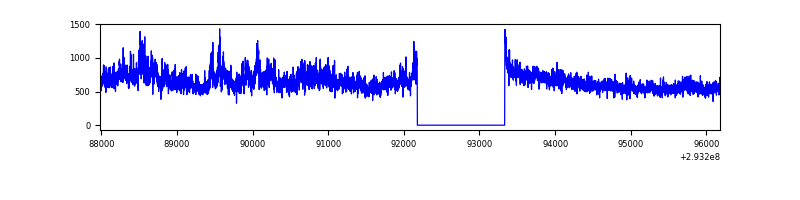 |
| D | 8196 | 7041 | 33 | 33 | 0.40% | 0.47% | 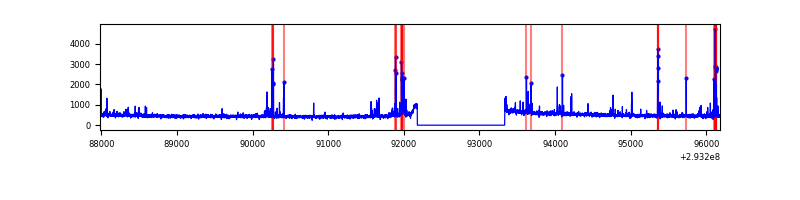 |
Top three noisy pixels from each quadrant. If the there are fewer than three noisy pixels in the level2.evt file, extra rows are filled as -1
| Pixel properties | Quadrant properties | ||||||
|---|---|---|---|---|---|---|---|
| Quadrant | DetID | PixID | Counts | Sigma | Mean | Median | Sigma |
| A | 9 | 143 | 150592 | 841.32 | 885 | 867 | 178.0 |
| A | 13 | 254 | 8063 | 40.43 | 885 | 867 | 178.0 |
| A | 0 | 226 | 7558 | 37.6 | 885 | 867 | 178.0 |
| B | 12 | 111 | 19661 | 112.53 | 885 | 863 | 167.0 |
| B | 11 | 111 | 17483 | 99.5 | 885 | 863 | 167.0 |
| B | 0 | 214 | 16218 | 91.92 | 885 | 863 | 167.0 |
| C | 3 | 233 | 1102590 | 5525.02 | 860 | 870 | 199.4 |
| C | 14 | 238 | 135840 | 676.86 | 860 | 870 | 199.4 |
| C | 13 | 61 | 5997 | 25.71 | 860 | 870 | 199.4 |
| D | 11 | 176 | 137418 | 643.39 | 873 | 848 | 212.3 |
| D | 5 | 222 | 117136 | 547.84 | 873 | 848 | 212.3 |
| D | 2 | 234 | 29663 | 135.75 | 873 | 848 | 212.3 |
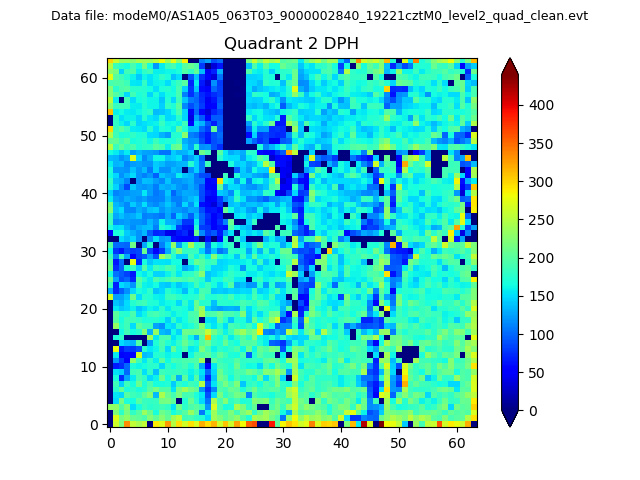
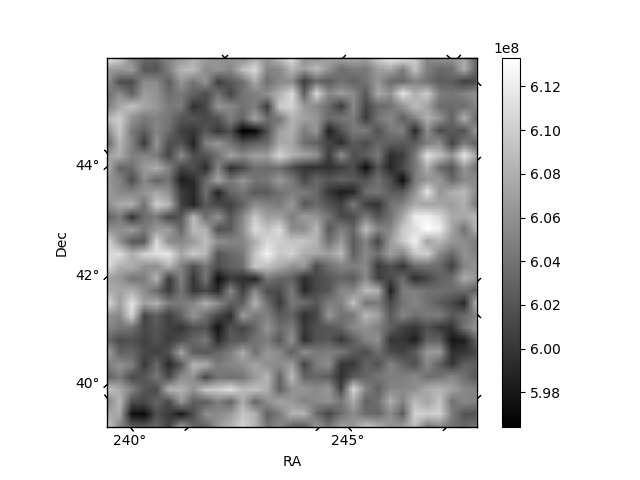
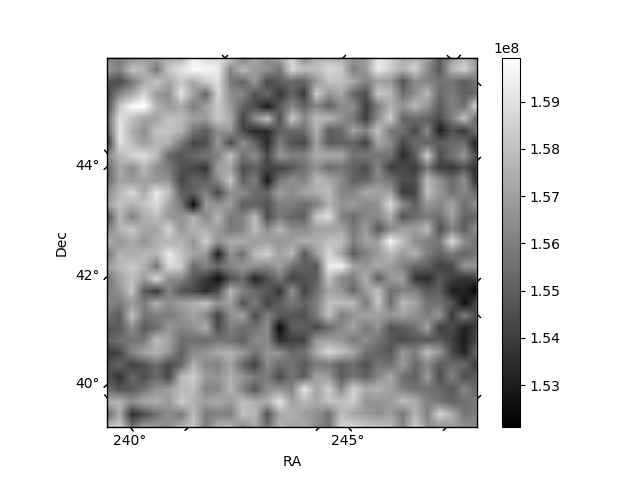
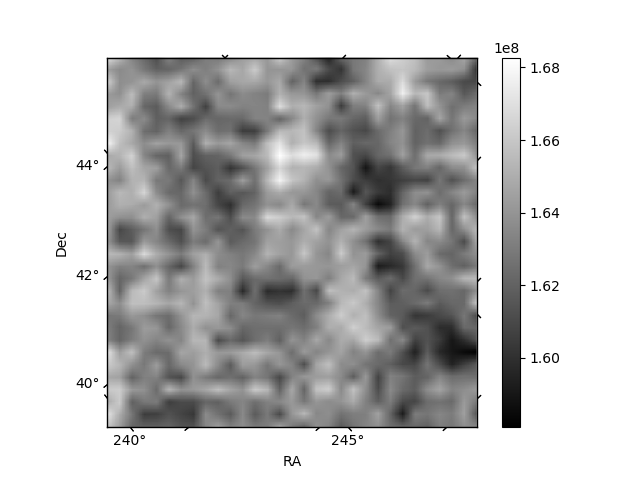
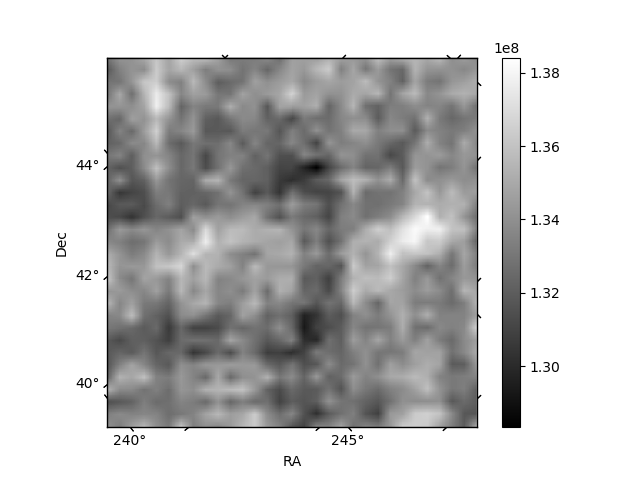
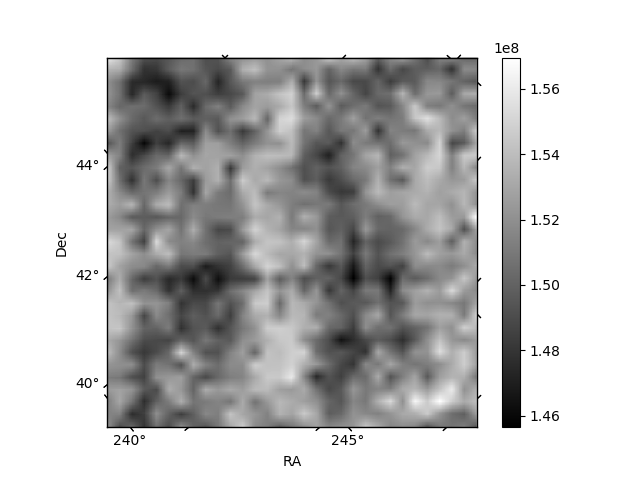
Histogram calculated using DETX and DETY for each event in the final _common_clean file
| Quadrant A | 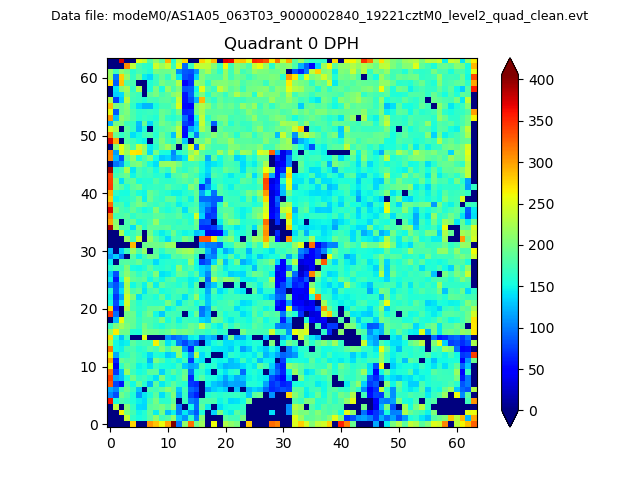 |
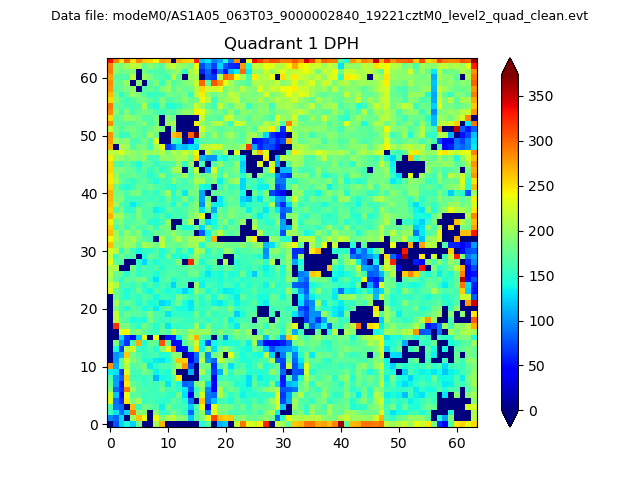 |
Quadrant B |
|---|---|---|---|
| Quadrant D | 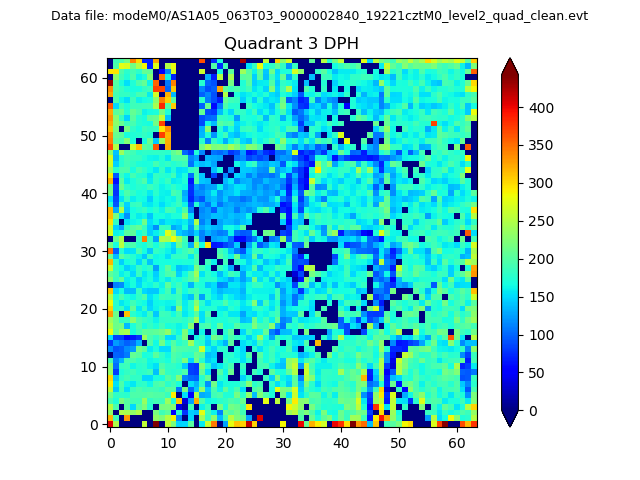 |
 |
Quadrant C |
| Plot type | Count rate plots | Images |
|---|---|---|
| Comparison with Poisson distribution Blue bars denote a histogram of data divided into 1 sec bins. Red curve is a Poisson curve with rate = median count rate of data. |
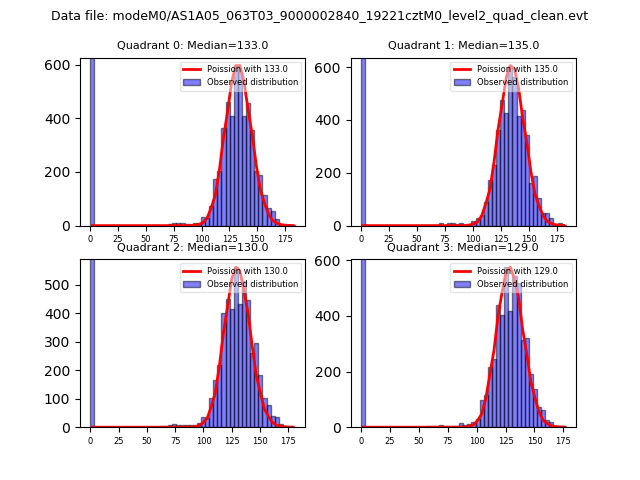 |
 |
| Quadrant-wise count rates Data is divided into 100 sec bins |
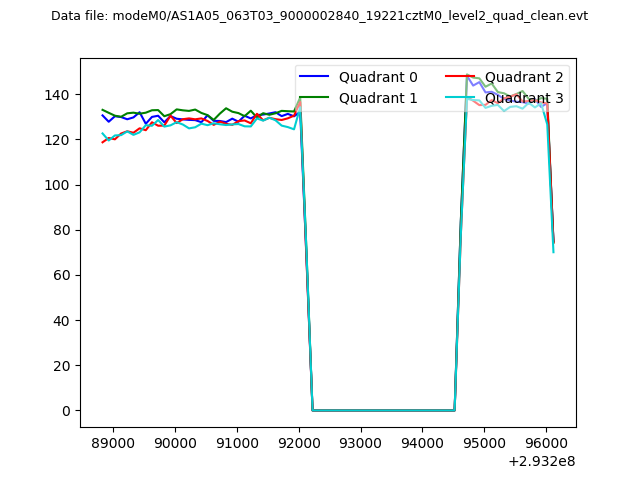 |
|
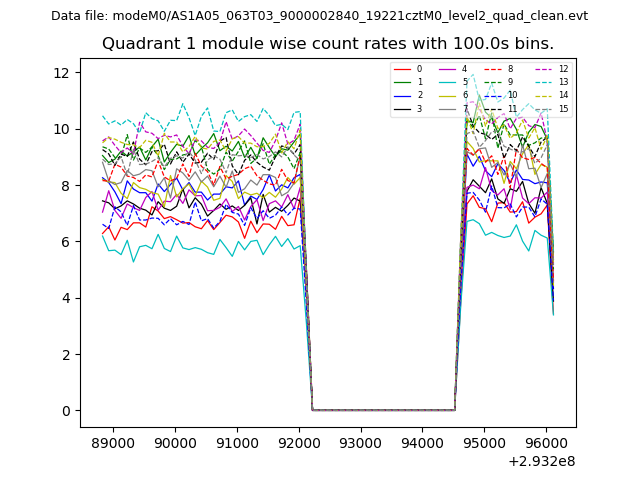
| Module-wise count rates for Quadrant A Data is divided into 100 sec bins |
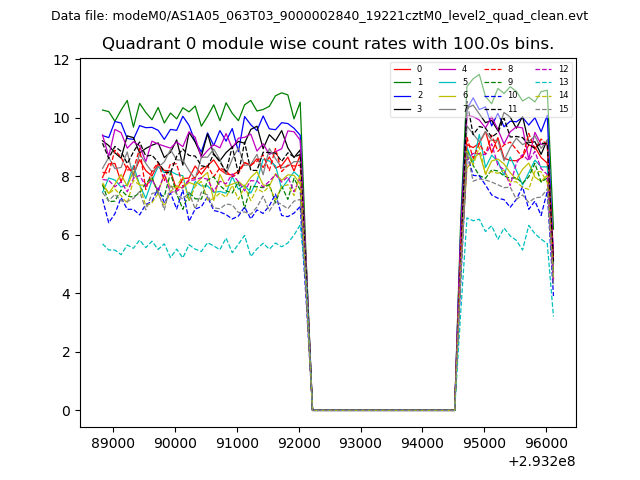 |
 |
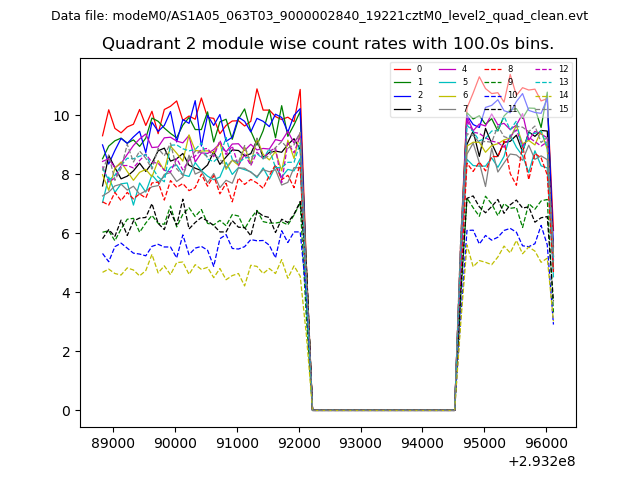
| Module-wise count rates for Quadrant B Data is divided into 100 sec bins |
 |
 |
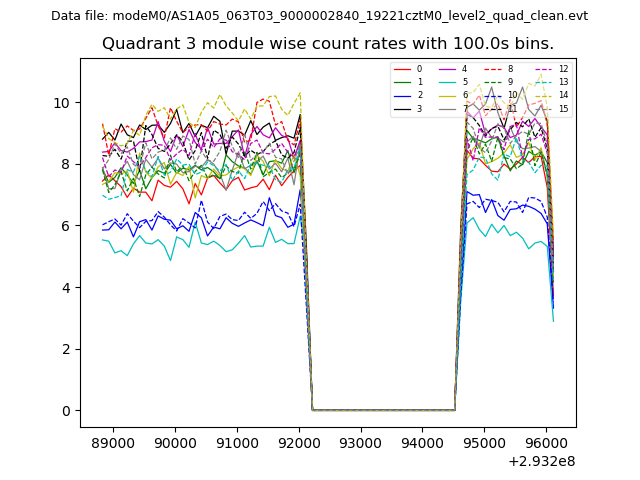
| Module-wise count rates for Quadrant C Data is divided into 100 sec bins |
 |
 |
| Module-wise count rates for Quadrant D Data is divided into 100 sec bins |
 |
 |
| Parameter | Plot |
|---|---|
| CZT HV Monitor | 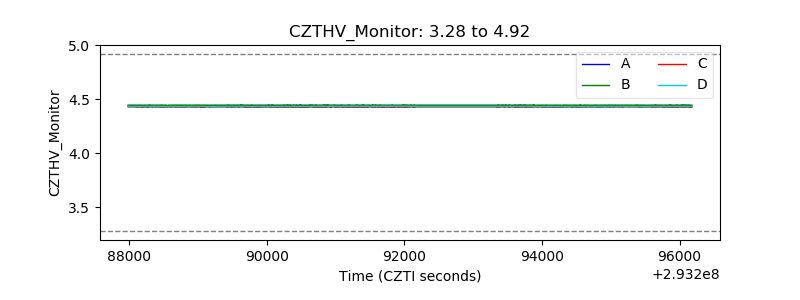 |
| D_VDD | 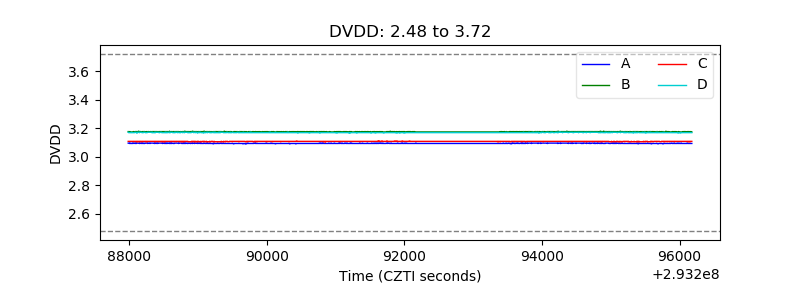 |
| Temperature 1 | 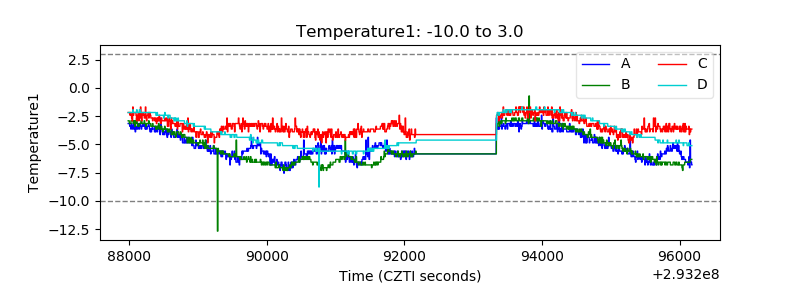 |
| Veto HV Monitor | 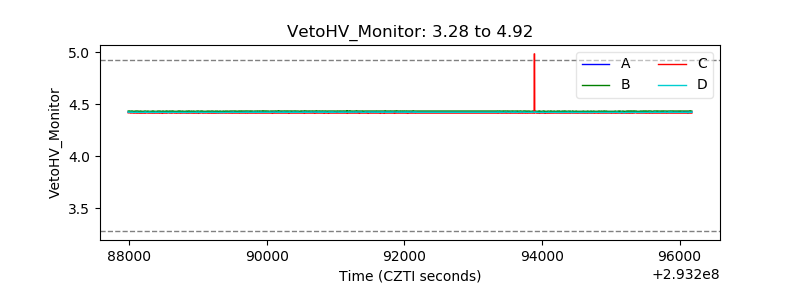 |
| Veto LLD | 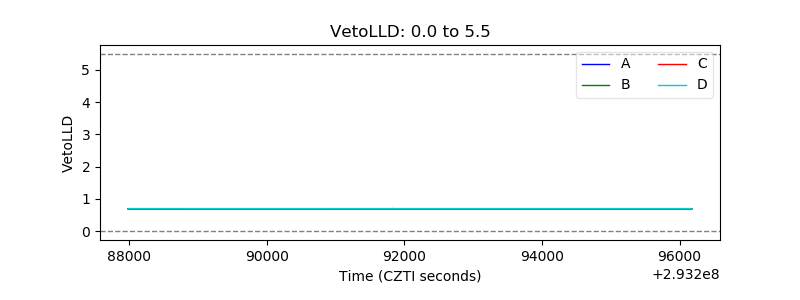 |
| Alpha Counter | 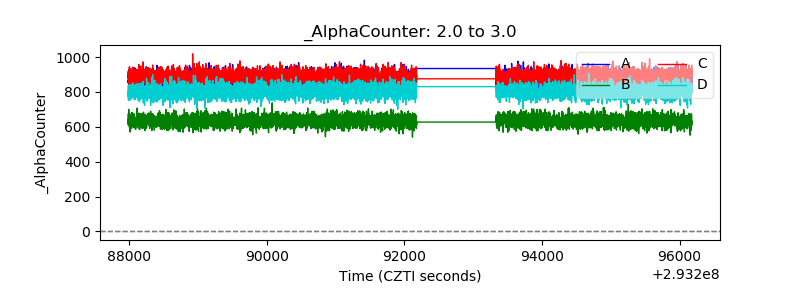 |
| _CPM_Rate | 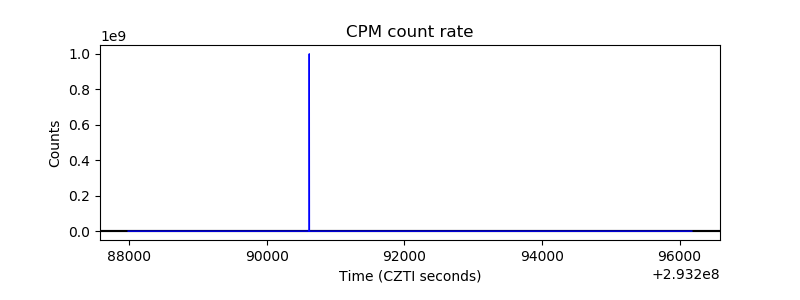 |
| CZT Counter | 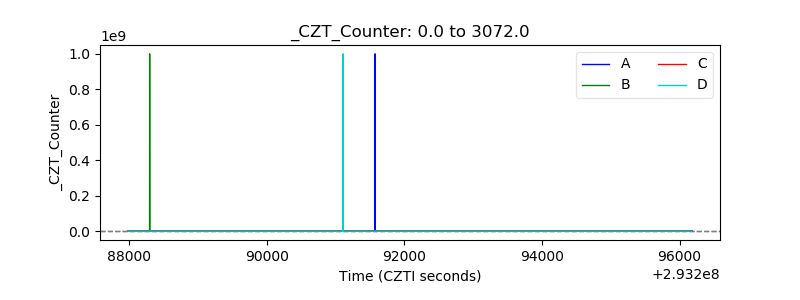 |
| +2.5 Volts monitor |  |
| +5 Volts monitor |  |
| _ROLL_ROT | 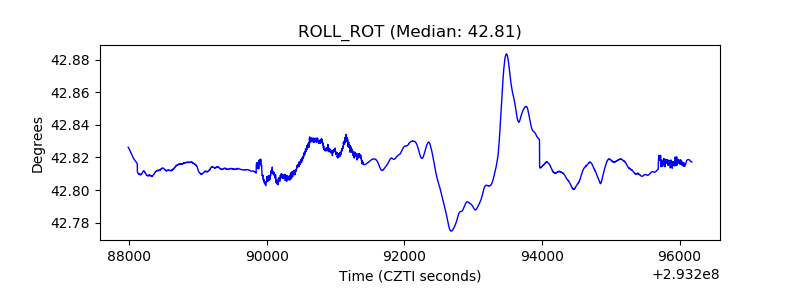 |
| _Roll_DEC | 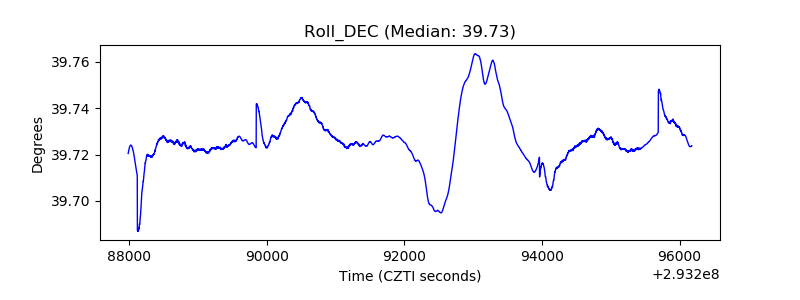 |
| _Roll_RA | 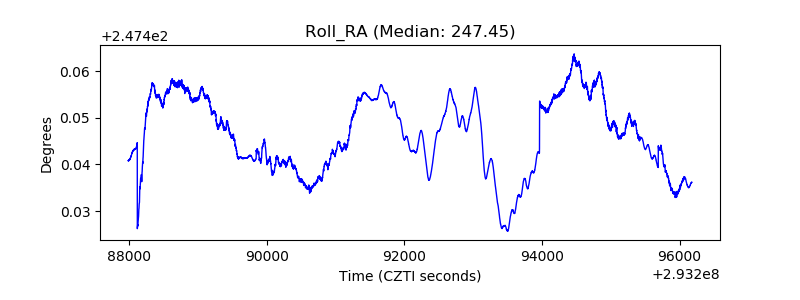 |
| Veto Counter | 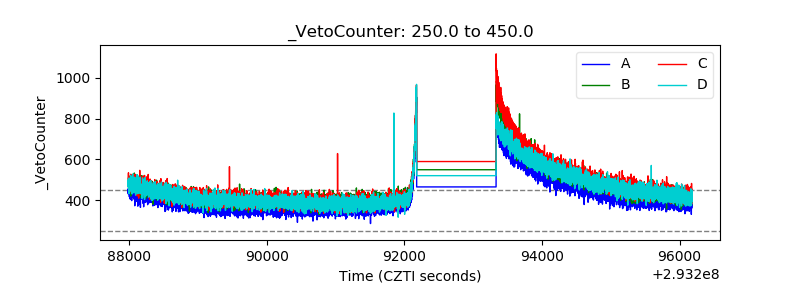 |